Download presentation
Presentation is loading. Please wait.

1
Downside Risk: Implications for Financial Management Robert Engle NYU Stern School of Business Tilburg April 22, 2004

2
WHAT IS ARCH? Autoregressive Conditional Heteroskedasticity Autoregressive Conditional Heteroskedasticity Predictive (conditional) Predictive (conditional) Uncertainty (heteroskedasticity) Uncertainty (heteroskedasticity) That fluctuates over time (autoregressive) That fluctuates over time (autoregressive)
 Predictive (conditional) Uncertainty (heteroskedasticity) Uncertainty (heteroskedasticity) That fluctuates over time (autoregressive) That fluctuates over time (autoregressive).")
3
THE SIMPLEST PROBLEM – WHAT IS VOLATILITY NOW? One answer is the standard deviation over the last 5 years One answer is the standard deviation over the last 5 years But this will include lots of old information that may not be relevant for short term forecasting But this will include lots of old information that may not be relevant for short term forecasting Another answer is the standard deviation over the last 5 days Another answer is the standard deviation over the last 5 days But this will be highly variable because there is so little information But this will be highly variable because there is so little information

4
THE ARCH ANSWER Use a weighted average of the volatility over a long period with higher weights on the recent past and small but non-zero weights on the distant past. Use a weighted average of the volatility over a long period with higher weights on the recent past and small but non-zero weights on the distant past. Choose these weights by looking at the past data; what forecasting model would have been best historically? This is a statistical estimation problem. Choose these weights by looking at the past data; what forecasting model would have been best historically? This is a statistical estimation problem.

5
FINANCIAL ECONOMETRICS THIS MAY ALSO BE THE BIRTH OF FINANCIAL ECONOMETRICS THIS MAY ALSO BE THE BIRTH OF FINANCIAL ECONOMETRICS STATISTICAL MODELS DEVELOPED SPECIFICALLY FOR FINANCIAL APPLICATIONS STATISTICAL MODELS DEVELOPED SPECIFICALLY FOR FINANCIAL APPLICATIONS TODAY THIS IS A VERY POPULAR AND ACTIVE RESEARCH AREA WITH MANY APPLICATIONS TODAY THIS IS A VERY POPULAR AND ACTIVE RESEARCH AREA WITH MANY APPLICATIONS

6
FROM THE SIMPLE ARCH GREW: GENERALIZED ARCH (Bollerslev) a most important extension GENERALIZED ARCH (Bollerslev) a most important extension Tomorrow’s variance is predicted to be a weighted average of the Tomorrow’s variance is predicted to be a weighted average of the Long run average variance Long run average variance Today’s variance forecast Today’s variance forecast The news (today’s squared return) The news (today’s squared return)
 a most important extension GENERALIZED ARCH (Bollerslev) a most important extension Tomorrow’s variance is predicted to be a weighted average of the Tomorrow’s variance is predicted to be a weighted average of the Long run average variance Long run average variance Today’s variance forecast Today’s variance forecast The news (today’s squared return) The news (today’s squared return)")
7
AND EGARCH (Nelson) very important as it introduced asymmetry EGARCH (Nelson) very important as it introduced asymmetry Weights are different for positive and negative returns Weights are different for positive and negative returns
 very important as it introduced asymmetry EGARCH (Nelson) very important as it introduced asymmetry Weights are different for positive and negative returns Weights are different for positive and negative returns")
8
NEW ARCH MODELS GJR-GARCH GJR-GARCH TARCH TARCH STARCH STARCH AARCH AARCH NARCH NARCH MARCH MARCH SWARCH SWARCH SNPARCH SNPARCH APARCH APARCH TAYLOR-SCHWERT TAYLOR-SCHWERT FIGARCH FIGARCH FIEGARCH FIEGARCH Component Component Asymmetric Component Asymmetric Component SQGARCH SQGARCH CESGARCH CESGARCH Student t Student t GED GED SPARCH SPARCH

9
ROLLING WINDOW VOLATILITIES NUMBER OF DAYS=5, 260, 1300

10
ARCH/GARCH VOLATILITIES

11
CONFIDENCE INTERVALS

12
FINANCIAL APPLICATIONS

13
VALUE AT RISK Future losses are uncertain. Find a LOSS that you are 99% sure is worse than whatever will occur. This is the Value at Risk. Future losses are uncertain. Find a LOSS that you are 99% sure is worse than whatever will occur. This is the Value at Risk. One day in advance One day in advance Many days in advance Many days in advance This single number (a quantile) is used to represent a full distribution. It can be misleading. This single number (a quantile) is used to represent a full distribution. It can be misleading.
 is used to represent a full distribution. It can be misleading. This single number (a quantile) is used to represent a full distribution. It can be misleading..")
14
CALCULATING VaR Forecast the one day standard deviation– GARCH style models are widely used. Then: Forecast the one day standard deviation– GARCH style models are widely used. Then: Assuming normality, multiply by 2.33 Assuming normality, multiply by 2.33 Without assuming normality, multiply by the quantile of the standardized residuals. Without assuming normality, multiply by the quantile of the standardized residuals. For the example, multiplier = 2.65 For the example, multiplier = 2.65

15
MULTI-DAY HORIZONS If volatility were constant, then the multi-day volatility would simply require multiplying by the square root of the days. If volatility were constant, then the multi-day volatility would simply require multiplying by the square root of the days. Because volatility is dynamic and asymmetric, the lower tail is more extreme and the VaR should be greater. Because volatility is dynamic and asymmetric, the lower tail is more extreme and the VaR should be greater.

16
TWO PERIOD RETURNS Two period return is the sum of two one period continuously compounded returns Two period return is the sum of two one period continuously compounded returns Look at binomial tree version Look at binomial tree version Asymmetry gives negative skewness Asymmetry gives negative skewness High variance Low variance

17
MULTIPLIER FOR 10 DAYS For a 10 day 99% value at risk, conventional practice multiplies the daily standard deviation by 7.36 For a 10 day 99% value at risk, conventional practice multiplies the daily standard deviation by 7.36 For the same multiplier with asymmetric GARCH it is simulated from the example to be 7.88 For the same multiplier with asymmetric GARCH it is simulated from the example to be 7.88 Bootstrapping from the residuals the multiplier becomes 8.52 Bootstrapping from the residuals the multiplier becomes 8.52

18
OPTIONS Traded options always have multiple days to expiration. Traded options always have multiple days to expiration. Hence the distribution of future price levels is negatively skewed. Hence the distribution of future price levels is negatively skewed. Thus the Black Scholes implied volatility should depend on strike if options are priced by GARCH. Thus the Black Scholes implied volatility should depend on strike if options are priced by GARCH. A skew in implied volatility will result from Asymmetric GARCH, at least for short maturities. A skew in implied volatility will result from Asymmetric GARCH, at least for short maturities.

19
IMPLIED VOLATILITY SKEW FOR 10 DAY OPTION From simulated (risk neutral) final values, find average put option payoff for each strike. From simulated (risk neutral) final values, find average put option payoff for each strike. Calculate Black Scholes implied volatilities and plot against strike. Calculate Black Scholes implied volatilities and plot against strike. Notice the clear downward slope. This would be zero for constant volatility. Notice the clear downward slope. This would be zero for constant volatility.
 final values, find average put option payoff for each strike. Calculate Black Scholes implied volatilities and plot against strike. Calculate Black Scholes implied volatilities and plot against strike. Notice the clear downward slope. This would be zero for constant volatility. Notice the clear downward slope. This would be zero for constant volatility..")
20
PUT PRICES

21
PUT IMPLIED VOLATILITIES

22
PRICING KERNEL The observed skew is even steeper than this. The observed skew is even steeper than this. Engle and Rosenberg(2002) explain the difference by a risk premium Engle and Rosenberg(2002) explain the difference by a risk premium Investors are especially willing to pay to avoid a big market drop. Investors are especially willing to pay to avoid a big market drop. Others describe this in terms of jumps and risk premia on the jumps Others describe this in terms of jumps and risk premia on the jumps
 explain the difference by a risk premium Engle and Rosenberg(2002) explain the difference by a risk premium Investors are especially willing to pay to avoid a big market drop. Investors are especially willing to pay to avoid a big market drop. Others describe this in terms of jumps and risk premia on the jumps Others describe this in terms of jumps and risk premia on the jumps.")
23
WHAT IS NEXT? MULTIVARIATE MODELS- DCC or Dynamic Conditional Correlation HIGH FREQUENCY MODELS- Market Microstructure

24
THE MULTIVARIATE PROBLEM Asset Allocation and Risk Management problems require large covariance matrices Asset Allocation and Risk Management problems require large covariance matrices Credit Risk now also requires big correlation matrices to accurately model loss or default correlations Credit Risk now also requires big correlation matrices to accurately model loss or default correlations Multivariate GARCH has never been widely used – it is too difficult to specify and estimate Multivariate GARCH has never been widely used – it is too difficult to specify and estimate

25
Dynamic Conditional Correlation DCC is a new type of multivariate GARCH model that is particularly convenient for big systems. See Engle(2002) or Engle(2004). DCC is a new type of multivariate GARCH model that is particularly convenient for big systems. See Engle(2002) or Engle(2004).
 or Engle(2004). DCC is a new type of multivariate GARCH model that is particularly convenient for big systems. See Engle(2002) or Engle(2004)..")
26
DCC 1. Estimate volatilities for each asset and compute the standardized residuals or volatility adjusted returns. 2. Estimate the time varying covariances between these using a maximum likelihood criterion and one of several models for the correlations. 3. Form the correlation matrix and covariance matrix. They are guaranteed to be positive definite.

27
HOW IT WORKS When two assets move in the same direction, the correlation is increased slightly. When two assets move in the same direction, the correlation is increased slightly. When they move in the opposite direction it is decreased. When they move in the opposite direction it is decreased. This effect may be stronger in down markets. This effect may be stronger in down markets. The correlations often are assumed to only temporarily deviate from a long run mean The correlations often are assumed to only temporarily deviate from a long run mean

28
Two period Joint Returns If returns are both negative in the first period, then correlations are higher. If returns are both negative in the first period, then correlations are higher. This leads to lower tail dependence This leads to lower tail dependence Up Market Down Market

29
DCC and the Copula A symmetric DCC model gives higher tail dependence for both upper and lower tails of the multi-period joint density. A symmetric DCC model gives higher tail dependence for both upper and lower tails of the multi-period joint density. An asymmetric DCC or ASY-DCC gives higher tail dependence in the lower tail of the multi-period density. An asymmetric DCC or ASY-DCC gives higher tail dependence in the lower tail of the multi-period density.

30
Testing and Valuing Dynamic Correlations for Asset Allocation Robert Engle and Riccardo Colacito NYU Stern

31
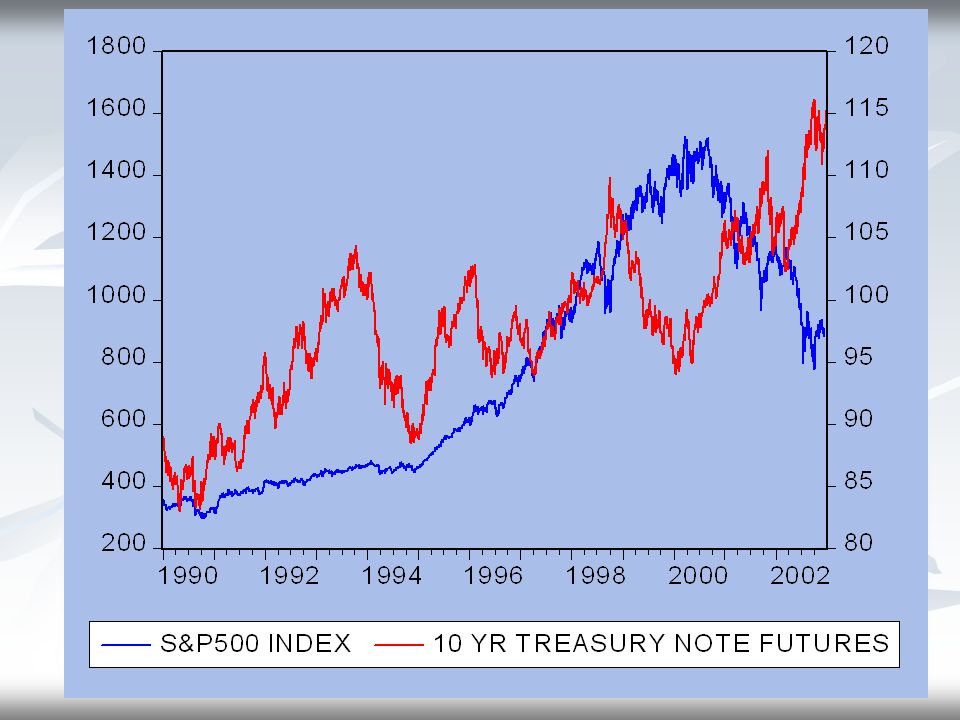
A Model for Stocks and Bonds Daily returns on S&P500 Futures Daily returns on S&P500 Futures Daily returns on 10-year Treasury Note Futures Daily returns on 10-year Treasury Note Futures Both from DataStream from Jan 1 1990 to Dec 18 2002 Both from DataStream from Jan 1 1990 to Dec 18 2002

32
SUMMARY STATISTICS S&P 500 10 Yr Treas Fut. Annual Mean 8.6%2.0% Annual Vol 17.2%6.2% Correlation.06 Kurtosis8.15.1

34
Volatilities and Correlations

37
THE FORMULATION Solve a series of portfolio problems with a riskless asset Solve a series of portfolio problems with a riskless asset Where r 0 is the required excess return and µ is a vector of excess expected returns Where r 0 is the required excess return and µ is a vector of excess expected returns With the true covariance matrix you can achieve lower volatility or higher required returns than with the incorrect one. With the true covariance matrix you can achieve lower volatility or higher required returns than with the incorrect one.

38
INTERPRETING RESULTS A number such as 105 means required excess returns can be 5% greater with correct correlations without increasing volatility. A number such as 105 means required excess returns can be 5% greater with correct correlations without increasing volatility. E.g. a 4% excess return with incorrect correlation would be a 4.2% return with correct correlations. E.g. a 4% excess return with incorrect correlation would be a 4.2% return with correct correlations. With 10% required return, the value of such correlations is 50 basis points. With 10% required return, the value of such correlations is 50 basis points.

40
AN EXPERIMENT Simulate 10,000 days of the DCC model documented above. Simulate 10,000 days of the DCC model documented above. One investor knows the volatilities and correlations every day, Ω. One investor knows the volatilities and correlations every day, Ω. The other only knows the unconditional volatilities and correlations, H The other only knows the unconditional volatilities and correlations, H What is the gain to the informed investor? What is the gain to the informed investor?

41
VALUE GAINS Stocks vs Bonds, Simulated Data, Full Covariance

42
Extreme Correlations (simulated data, full covariance)
")
43
Volatility ratios Stocks vs Bonds ( actual data with estimated DCC)
")
44
SP500 vs. DOW JONES Correlation and return structure of equity indices is very different Correlation and return structure of equity indices is very different Unconditional correlations are about.9 Unconditional correlations are about.9 Asymmetry is greater Asymmetry is greater Expected returns are probably nearly equal Expected returns are probably nearly equal RESULTS ARE ABOUT THE SAME RESULTS ARE ABOUT THE SAME

45
VALUE GAINS SP500 vs DOW, Simulated Data, Full Covariance

46
MONTHLY REBALANCING Monthly rebalancing lies between rebalancing every day and never rebalancing. Monthly rebalancing lies between rebalancing every day and never rebalancing. The monthly joint distribution is asymmetric with important lower tail dependence. The monthly joint distribution is asymmetric with important lower tail dependence. Daily myopic rebalancing takes account of this asymmetry Daily myopic rebalancing takes account of this asymmetry Additional gains are possible with daily multi- period optimization Additional gains are possible with daily multi- period optimization

47
INTEGRATING RISK MANAGEMENT AND ASSET ALLOCATION Asset Allocation is considered monthly because only at this frequency can expected returns be updated Asset Allocation is considered monthly because only at this frequency can expected returns be updated Within the month, volatilities can be updated Within the month, volatilities can be updated Rebalancing can be done with futures – portfolio volatility can be reduced Rebalancing can be done with futures – portfolio volatility can be reduced Risk management can be done with futures or other derivatives Risk management can be done with futures or other derivatives In this way, firms can integrate risk management and asset allocation In this way, firms can integrate risk management and asset allocation

48
CONCLUSIONS The value of accurate daily correlations is moderate – maybe 5% of the required return. Possibly why asset allocation is done monthly and ignores covariances. The value of accurate daily correlations is moderate – maybe 5% of the required return. Possibly why asset allocation is done monthly and ignores covariances. On some days, the value is much greater. Possibly why risk management is done daily. On some days, the value is much greater. Possibly why risk management is done daily. Additional value may flow from coordinating these decisions. Additional value may flow from coordinating these decisions.

Similar presentations


 K. Cuthbertson and D. Nitzsche Lecture VaR:>")
