Download presentation
Presentation is loading. Please wait.

1
DYNAMIC CONDITIONAL CORRELATION : ECONOMETRIC RESULTS AND FINANCIAL APPLICATIONS Robert Engle New York University Prepared for CARLOS III, MAY 24, 2004 CARLOS III, MAY 24, 2004

2
ABSTRACT A new model for measuring and predicting correlations as well as volatilities is examined. This Dynamic Conditional Correlation model or DCC, models the volatilities and correlations in two steps. The specification of the correlation dynamics is extended to allow asymmetries important for financial practice. The presentation develops the econometric methods for estimating the DCC model. The DCC provides a joint density function with tail dependence greater than the normal. This is explored both by simulation and empirically. The time aggregated DCC is presented as a useful copula for financial decision making. As an example, a covariance matrix is estimated between 34 country equity and bond returns. The role of asymmetry is examined in both volatilities and correlations. The dispersion of equity and bond volatilities and their pairwise correlations are examined over time and after the formation of the EURO.

3
OUTLINE WHAT IS DCC? WHAT IS DCC? ESTIMATION THEORY ESTIMATION THEORY TWO STEP TWO STEP QMLE QMLE STANDARD ERRORS STANDARD ERRORS BEYOND LINEAR DEPENDENCE BEYOND LINEAR DEPENDENCE DEPENDENCE MEASURES DEPENDENCE MEASURES MULTI-STEP DISTRIBUTION MULTI-STEP DISTRIBUTION ASYMMETRIC GLOBAL CORRELATIONS ASYMMETRIC GLOBAL CORRELATIONS

4
Conditional Correlations Definition of conditional correlation Definition of conditional correlation And letting And letting

5
Multivariate Definitions Let r be a vector of returns and D a diagonal matrix with standard deviations on the diagonal Let r be a vector of returns and D a diagonal matrix with standard deviations on the diagonal R is a time varying correlation matrix R is a time varying correlation matrix

6
DYNAMIC CONDITIONAL CORRELATION A NEW SOLUTION in Engle(2002) THE STRATEGY: THE STRATEGY: ESTIMATE UNIVARIATE VOLATILITY MODELS FOR ALL ASSETS ESTIMATE UNIVARIATE VOLATILITY MODELS FOR ALL ASSETS CONSTRUCT STANDARDIZED RESIDUALS (returns divided by conditional standard deviations) CONSTRUCT STANDARDIZED RESIDUALS (returns divided by conditional standard deviations) ESTIMATE CORRELATIONS BETWEEN STANDARDIZED RESIDUALS WITH A SMALL NUMBER OF PARAMETERS ESTIMATE CORRELATIONS BETWEEN STANDARDIZED RESIDUALS WITH A SMALL NUMBER OF PARAMETERS
 THE STRATEGY: THE STRATEGY: ESTIMATE UNIVARIATE VOLATILITY MODELS FOR ALL ASSETS ESTIMATE UNIVARIATE VOLATILITY MODELS FOR ALL ASSETS CONSTRUCT STANDARDIZED RESIDUALS (returns divided by conditional standard deviations) CONSTRUCT STANDARDIZED RESIDUALS (returns divided by conditional standard deviations) ESTIMATE CORRELATIONS BETWEEN STANDARDIZED RESIDUALS WITH A SMALL NUMBER OF PARAMETERS ESTIMATE CORRELATIONS BETWEEN STANDARDIZED RESIDUALS WITH A SMALL NUMBER OF PARAMETERS")
7
MODELS FOR CONDITIONAL CORRELATIONS Constant Constant Integrated Processes Integrated Processes Mean Reverting Processes Mean Reverting Processes More complex multivariate processes More complex multivariate processes

8
The Constant Correlation Estimator: Bollerslev(1990) Let Let Be the standardized residuals Then Then
 Let Let Be the standardized residuals Then Then")
9
Specifications for Rho Exponential Smoother Exponential Smoother i.e. i.e.

10
Mean Reverting Rho Just as in GARCH Just as in GARCH

11
Simple Correlation Models and and

12
Tse and Tsui(2002) A closely related model for modeling correlations directly as a weighted average of three correlation matrices. A closely related model for modeling correlations directly as a weighted average of three correlation matrices.

13
Higher Order Models Engle and Sheppard(2002), Theoretical and Empirical Properties of Dynamic Conditional Correlation Multivariate GARCH Higher order DCC are estimated Higher order DCC are estimated Applied to 100 S&P industry sectors Applied to 100 S&P industry sectors Applied to 30 Dow Stocks Applied to 30 Dow Stocks
, Theoretical and Empirical Properties of Dynamic Conditional Correlation Multivariate GARCH Higher order DCC are estimated Higher order DCC are estimated Applied to 100 S&P industry sectors Applied to 100 S&P industry sectors Applied to 30 Dow Stocks Applied to 30 Dow Stocks")
14
Higher Order DCC Define DCC(p,q) as Define DCC(p,q) as For most of the data sets, DCC(1,1) was adequate. For most of the data sets, DCC(1,1) was adequate.
 was adequate..")
15
Generalized DCC Add parameters for each asset Add parameters for each asset Where A and B are square, symmetric, and is Hadamard product Where A and B are square, symmetric, and is Hadamard product If A,B and (ii’-A-B) are p.s.d and R is p.d., then Q is p.d. See Ding and Engle(2001) If A,B and (ii’-A-B) are p.s.d and R is p.d., then Q is p.d. See Ding and Engle(2001)
 If A,B and (ii’-A-B) are p.s.d and R is p.d., then Q is p.d. See Ding and Engle(2001).")
16
Diagonal Generalized DCC Choose a parameterization for A, B. Choose a parameterization for A, B. So that for any W So that for any W Hence for any i and j Hence for any i and j

17
Asymmetric DCC Response to two negative returns is different from overall response. Response to two negative returns is different from overall response. Define Define Asymmetry can be introduced with terms that are zero except when both returns are negative such as: Asymmetry can be introduced with terms that are zero except when both returns are negative such as: Or more generally (and averaging to zero): Or more generally (and averaging to zero):
: Or more generally (and averaging to zero):.")
18
Asymmetric Generalized DCC The Asymmetric Generalized DCC can be expressed The Asymmetric Generalized DCC can be expressed And assuming a diagonal structure for A,B and G, the typical equation becomes And assuming a diagonal structure for A,B and G, the typical equation becomes

19
Log Likelihood

20
Two Step Maximum Likelihood First, estimate each return as GARCH possibly with other variables or returns as inputs, and construct the standardized residuals First, estimate each return as GARCH possibly with other variables or returns as inputs, and construct the standardized residuals Second, maximize the conditional likelihood with respect to any unknown parameters in rho Second, maximize the conditional likelihood with respect to any unknown parameters in rho

21
ECONOMETRIC QUESTIONS With non-normal data, are these QMLE estimators? With non-normal data, are these QMLE estimators? How can we construct asymptotically consistent standard errors? How can we construct asymptotically consistent standard errors? Let parameters in GARCH be and call the likelihood function QL 1 Let parameters in GARCH be and call the likelihood function QL 1 Let parameters in DCC be and call the second part of the likelihood function QL 2 Let parameters in DCC be and call the second part of the likelihood function QL 2

22
Quasi Likelihood

23
GENERAL RESULT Bollerslev and Wooldridge(1992) show that any multivariate GARCH model that is correctly specified in the first two moments, and satisfies a bunch of regularity conditions, will be a QMLE estimator. Bollerslev and Wooldridge(1992) show that any multivariate GARCH model that is correctly specified in the first two moments, and satisfies a bunch of regularity conditions, will be a QMLE estimator. However this does not imply that two step estimation is consistent. However this does not imply that two step estimation is consistent.
 show that any multivariate GARCH model that is correctly specified in the first two moments, and satisfies a bunch of regularity conditions, will be a QMLE estimator. However this does not imply that two step estimation is consistent. However this does not imply that two step estimation is consistent..")
24
Two Step Estimators See Newey and McFadden(1994) pp.2176-2184 Suppose there are two sets of parameters ( , ) that are have no relation, i.e. are “variation free”. Suppose there are two sets of parameters ( , ) that are have no relation, i.e. are “variation free”. Let there be k 1 moment conditions g 1 ( ) and k 2 moment conditions g 2 ( , ), where these conform with the number of parameters in ( , ). Let there be k 1 moment conditions g 1 ( ) and k 2 moment conditions g 2 ( , ), where these conform with the number of parameters in ( , ). Consider the GMM estimation min g’Wg with g=(g 1,g 2 )’. Consider the GMM estimation min g’Wg with g=(g 1,g 2 )’. It is just identified so W=I is no restriction. It is just identified so W=I is no restriction. It will be a two step estimator since will solve only the first set of moments and will solve the second using the first estimate of . It will be a two step estimator since will solve only the first set of moments and will solve the second using the first estimate of .
 that are have no relation, i.e. are variation free . Let there be k 1 moment conditions g 1 ( ) and k 2 moment conditions g 2 ( , ), where these conform with the number of parameters in ( , ). Let there be k 1 moment conditions g 1 ( ) and k 2 moment conditions g 2 ( , ), where these conform with the number of parameters in ( , ). Consider the GMM estimation min g’Wg with g=(g 1,g 2 )’. Consider the GMM estimation min g’Wg with g=(g 1,g 2 )’. It is just identified so W=I is no restriction. It is just identified so W=I is no restriction. It will be a two step estimator since will solve only the first set of moments and will solve the second using the first estimate of . It will be a two step estimator since will solve only the first set of moments and will solve the second using the first estimate of ..")
25
GENERAL GMM RESULTS

26
KEY ASSUMPTION The first stage is consistent even if not MLE! The first stage is consistent even if not MLE! That is GARCH models estimated individually are consistent but inefficient when all parameters are variation free. That is GARCH models estimated individually are consistent but inefficient when all parameters are variation free.

27
For Two Step Given consistency for all parameters Given consistency for all parameters

28
APPLICATION TO VARIANCE TARGETING Variance Targeting was proposed by Engle and Mezrich(1995) to constrain an ARCH model to have a prespecified long run variance. Typically this was the sample variance. Variance Targeting was proposed by Engle and Mezrich(1995) to constrain an ARCH model to have a prespecified long run variance. Typically this was the sample variance. It is easily seen that the long run variance forecast from this model is 2 It is easily seen that the long run variance forecast from this model is 2 There are only two parameters to estimate rather than three. There are only two parameters to estimate rather than three.
 to constrain an ARCH model to have a prespecified long run variance. Typically this was the sample variance. It is easily seen that the long run variance forecast from this model is 2 It is easily seen that the long run variance forecast from this model is 2 There are only two parameters to estimate rather than three. There are only two parameters to estimate rather than three..")
29
ECONOMETRIC ISSUES Using the sample variance in this model gives Using the sample variance in this model gives This is not a Maximum Likelihood estimator of GARCH(1,1) and therefore is asymptotically inefficient This is not a Maximum Likelihood estimator of GARCH(1,1) and therefore is asymptotically inefficient It will be consistent because the sample variance is consistent in a wide range of models. It will be consistent because the sample variance is consistent in a wide range of models. If GARCH is misspecified, the long run variance will still be consistent. If GARCH is misspecified, the long run variance will still be consistent.

30
Univariate Variance Targeting The first set of moments come from the likelihood and the second from the sample variance. The first set of moments come from the likelihood and the second from the sample variance.

31
Two Step DCC One set of 3n moments for the variance models, , and one set for the correlations, . One set of 3n moments for the variance models, , and one set for the correlations, .

32
Three Step DCC or DCC with Correlation Targeting One set of 3n moments for variances, n(n-1)/2 for unconditional correlations, and two for the correlation process. One set of 3n moments for variances, n(n-1)/2 for unconditional correlations, and two for the correlation process.
/2 for unconditional correlations, and two for the correlation process..")
33
BEYOND LINEAR DEPENDENCE

34
JOINT DISTRIBUTIONS Dependence properties are all summarized by a joint distribution Dependence properties are all summarized by a joint distribution For a vector of kx1 random variables Y with cumulative distribution function F For a vector of kx1 random variables Y with cumulative distribution function F Assuming for simplicity that it is continuously differentiable, then the density function is: Assuming for simplicity that it is continuously differentiable, then the density function is:

35
UNIVARIATE PROPERTIES For any joint distribution function F, there are univariate distributions F i and densities f i defined by: For any joint distribution function F, there are univariate distributions F i and densities f i defined by: is a uniform random variable on the interval (0,1) is a uniform random variable on the interval (0,1) What is the joint distribution of What is the joint distribution of
 is a uniform random variable on the interval (0,1) What is the joint distribution of What is the joint distribution of")
36
COPULA The joint distribution of these uniform random variables is called a copula; The joint distribution of these uniform random variables is called a copula; it only depends on ranks and it only depends on ranks and is invariant to monotonic transformations. is invariant to monotonic transformations. Equivalently Equivalently

37
COPULA DENSITY Again assuming continuous differentiability, the copula density is Again assuming continuous differentiability, the copula density is From the chain rule or change of variable rule, the joint density is the product of the copula density and the marginal densities From the chain rule or change of variable rule, the joint density is the product of the copula density and the marginal densities

38
BIVARIATE DEPENDENCE MEASURES Pearson or simple correlation Pearson or simple correlation Will be sensitive to monotonic transformations of the data, I.e. to the marginal densities as well as the copula Will be sensitive to monotonic transformations of the data, I.e. to the marginal densities as well as the copula

39
Invariant Measures Kendall’s Tau: For a bivariate vector Y, Kendall’s Tau: For a bivariate vector Y, τ depends only on the ranks, ie on the copula τ depends only on the ranks, ie on the copula Spearman or rank correlation Spearman or rank correlation

40
A NEW ESTIMATOR RANK-DCC A dynamic correlation estimator can be constructed based only on the order statistics of the data A dynamic correlation estimator can be constructed based only on the order statistics of the data First create standardized residuals (?) then rank them First create standardized residuals (?) then rank them Build a DCC model based on rank data Build a DCC model based on rank data Estimator is less sensitive to outliers but pretty similar to cardinal DCC. Estimator is less sensitive to outliers but pretty similar to cardinal DCC.

41
TAIL DEPENDENCE When one variable is extreme, will another be also extreme? When one variable is extreme, will another be also extreme? Upper tail dependence is Upper tail dependence is Lower tail dependence is Lower tail dependence is

42
Values of Tail Dependence Tail dependence is a probability and must be between zero and one Tail dependence is a probability and must be between zero and one For joint normal distributions: For joint normal distributions: For other copulas one or both may be non- zero. For other copulas one or both may be non- zero. It is interesting if lower tail is more dependent than upper It is interesting if lower tail is more dependent than upper

43
What is the Distribution of DCC? To focus on the comovements, let volatilities be constant and normalized to 1. To focus on the comovements, let volatilities be constant and normalized to 1. Consider bivariate distribution of (y,x) Consider bivariate distribution of (y,x) Conditional correlations are changing but there is only one unconditional correlation. Conditional correlations are changing but there is only one unconditional correlation. This is therefore not a multivariate normal This is therefore not a multivariate normal This is a mixture of normals This is a mixture of normals with standard normal marginals with standard normal marginals With same covariance, on average. With same covariance, on average.
 Consider bivariate distribution of (y,x) Conditional correlations are changing but there is only one unconditional correlation. Conditional correlations are changing but there is only one unconditional correlation. This is therefore not a multivariate normal This is therefore not a multivariate normal This is a mixture of normals This is a mixture of normals with standard normal marginals with standard normal marginals With same covariance, on average. With same covariance, on average..")
44
Simulation 100,000 observations 100,000 observations N DCC DCC ADCC ADCC

45
Tail Index (.90 to.999 quantiles, 100000 reps.)
")
46
Discussion Small increase in tail correlations Small increase in tail correlations Very little evidence of non-zero tail index Very little evidence of non-zero tail index Still need to develop standard errors. Still need to develop standard errors. Similar results for ADCC Similar results for ADCC

47
Time Aggregation Multiperiod correlations include new interesting effects Multiperiod correlations include new interesting effects They are not individually normal They are not individually normal A large comovement leads to large correlations and a subsequently large comovement. A large comovement leads to large correlations and a subsequently large comovement. Expect two period aggregates to show this Expect two period aggregates to show this ADCC should show this especially in lower tail ADCC should show this especially in lower tail Average upper and lower tail for DCC as it is symmetric Average upper and lower tail for DCC as it is symmetric

48
P 1,T P 2,T Symmetric Tail Dependence

49
P 1,T P 2,T Lower Tail Dependence

50
P 1,T P 2,T K1K1 K2K2 Put Option on asset 1 Pays Option on asset 2 Pays Both options Payoff

51
P 1,T P 2,T K1K1 K2K2 Put Option on asset 1 Pays Option on asset 2 Pays Both options Payoff

52
TWO PERIOD RETURNS Two period return is the sum of two one period continuously compounded returns Two period return is the sum of two one period continuously compounded returns Look at binomial tree version Look at binomial tree version Asymmetry gives negative skewness Asymmetry gives negative skewness High variance Low variance

53
Two period Joint Returns If returns are both negative in the first period, then correlations are higher. If returns are both negative in the first period, then correlations are higher. This leads to lower tail dependence This leads to lower tail dependence Up Market Down Market

54
Time Aggregated DCC Tail Index

55
Time Aggregated Tail Index for ADCC

56
SOME RESULTS FOR EQUITY RETURNS – DOW STOCKS For 1992-2002 take 10 years of equity returns from the 30 current Dow Jones Stocks. For 1992-2002 take 10 years of equity returns from the 30 current Dow Jones Stocks. Calculate Tail correlations and Tail indexes for several pairs and their time aggregates. Calculate Tail correlations and Tail indexes for several pairs and their time aggregates.

62
FINDINGS DCC PROVIDES A FLEXIBLE APPROACH TO CORRELATION ESTIMATION DCC PROVIDES A FLEXIBLE APPROACH TO CORRELATION ESTIMATION ASYMPTOTIC STANDARD ERRORS CAN BE CONSTRUCTED FOR THE TWO AND THREE STEP ESTIMATORS ASYMPTOTIC STANDARD ERRORS CAN BE CONSTRUCTED FOR THE TWO AND THREE STEP ESTIMATORS TIME AGGREGATED SIMULATED ADCC AND REAL DATA SHOW HIGHER TAIL DEPENDENCE, PARTICULARLY IN LOWER TAIL TIME AGGREGATED SIMULATED ADCC AND REAL DATA SHOW HIGHER TAIL DEPENDENCE, PARTICULARLY IN LOWER TAIL

64
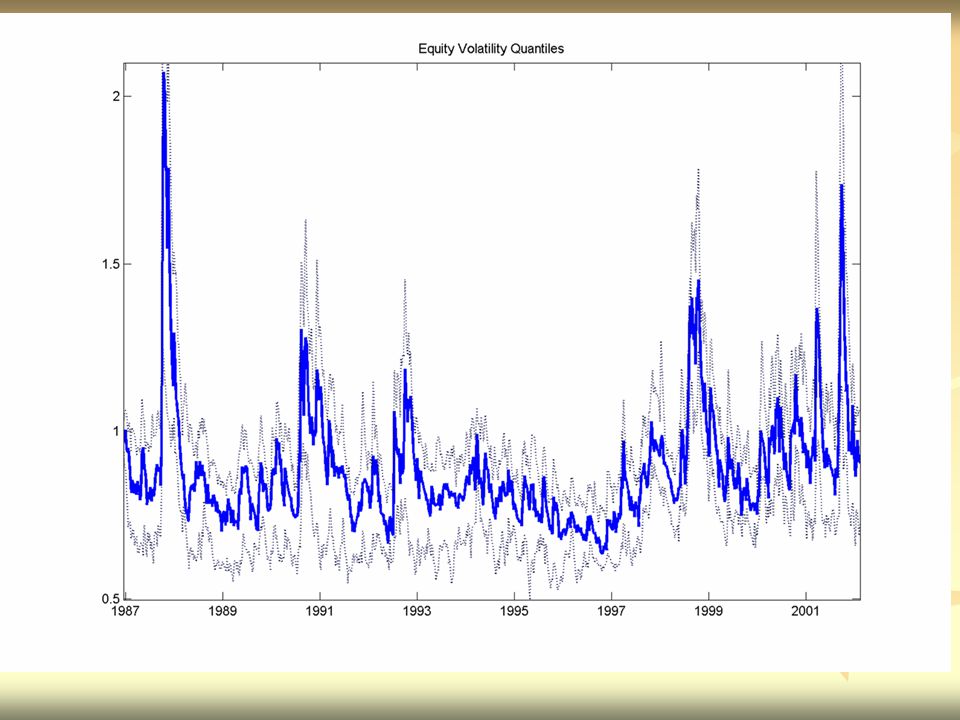
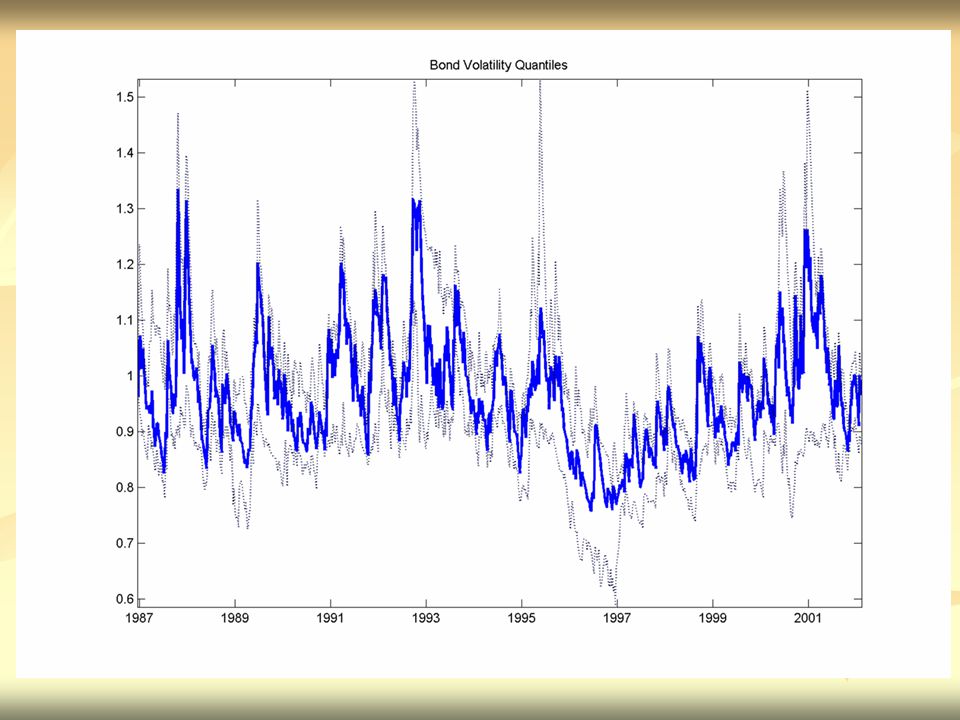
Data Weekly $ returns Jan 1987 to Feb 2002 (785 observations) Weekly $ returns Jan 1987 to Feb 2002 (785 observations) 21 Country Equity Series from FTSE All- World Index 21 Country Equity Series from FTSE All- World Index 13 Datastream Benchmark Bond Indices with 5 years average maturity 13 Datastream Benchmark Bond Indices with 5 years average maturity
 Weekly $ returns Jan 1987 to Feb 2002 (785 observations) 21 Country Equity Series from FTSE All- World Index 21 Country Equity Series from FTSE All- World Index 13 Datastream Benchmark Bond Indices with 5 years average maturity 13 Datastream Benchmark Bond Indices with 5 years average maturity")
65
Europe AUSTRIA* BELGIUM* DENMARK* FRANCE* GERMANY* IRELAND* ITALY THE NETHERLANDS* SPAIN SWEDEN* SWITZERLAND* NORWAY UNITED KINGDOM* Australasia AUSTRALIA HONG KONG JAPAN* NEW ZEALAND SINGAPORE Americas CANADA* MEXICO UNITED STATES*

66
GARCH Models (asymmetric in orange) GARCH GARCH AVGARCH AVGARCH NGARCH NGARCH EGARCH EGARCH ZGARCH ZGARCH GJR-GARCH GJR-GARCH APARCH APARCH AGARCH AGARCH NAGARCH NAGARCH 3EQ,8BOND 3EQ,8BOND 0 1BOND 1BOND 6EQ,1BOND 6EQ,1BOND 8EQ,1BOND 8EQ,1BOND 3EQ,1BOND 3EQ,1BOND 0 1EQ,1BOND 1EQ,1BOND 0
 GARCH GARCH AVGARCH AVGARCH NGARCH NGARCH EGARCH EGARCH ZGARCH ZGARCH GJR-GARCH GJR-GARCH APARCH APARCH AGARCH AGARCH NAGARCH NAGARCH 3EQ,8BOND 3EQ,8BOND 0 1BOND 1BOND 6EQ,1BOND 6EQ,1BOND 8EQ,1BOND 8EQ,1BOND 3EQ,1BOND 3EQ,1BOND 0 1EQ,1BOND 1EQ,1BOND 0")
67
Parameters of DCC Asymmetry in red (gamma) and Symmetry in blue (alpha)
 and Symmetry in blue (alpha)")
71
CORRELATIONS OF VOLATILITIES EQUITIES =.32 EQUITIES =.32 EUROPEAN =.55 EUROPEAN =.55 BONDS =.35 BONDS =.35 WITHIN EMU =.79 WITHIN EMU =.79

80
BEHAVIOR DURING US BEAR MARKETS

85
RESULTS Asymmetric Correlations – correlations rise in down markets Asymmetric Correlations – correlations rise in down markets Shift in level of correlations with formation of Euro Shift in level of correlations with formation of Euro Equity Correlations are rising not just within EMU-Globalization? Equity Correlations are rising not just within EMU-Globalization? EMU Bond correlations are especially high- others are also rising EMU Bond correlations are especially high- others are also rising

Similar presentations


/Litner (1965) version –Black (1972) version.>")


