Download presentation
Presentation is loading. Please wait.

1
Descriptive Statistics
Introduction to Study Skills & Research Methods (HL10040) Dr James Betts
 Dr James Betts.")
2
Lecture Outline: Statistics Variables Levels of Measurement
Measures of Central Tendency Distribution Variability.

3
Statistics Descriptive Inferential Correlational

4
Nominal Scale Ordinal Scale

5
Interval Scale Ratio Scale

6
Quick Test Nominal, Ordinal, Interval or Ratio?
Blood lactate concentration (mmol.l-1) Profile of Mood States (scale 1-7) Heart Rate (beats.min-1) Blood Group Bench Press 1RM (kg) Year of Birth (AD) Atmospheric Pressure (mmHg)
 Profile of Mood States (scale 1-7) Heart Rate (beats.min-1) Blood Group. Bench Press 1RM (kg) Year of Birth (AD) Atmospheric Pressure (mmHg)")
7
Système Internationale (SI) Units
Seven ‘constant’* base units using the metric system Variable Unit Symbol Accepted Derivations Distance metre m ha for area; º for angle; #l or L for volume Mass* kilogram kg t Time second s min, h, d (not year) Temperature kelvin K Mole mole mol #l or L for volume Current ampere A Luminance candela cd Units always lower-case#, neither italicised nor pleuralised (i.e. kg not KGS) and with space between value and unit (inc. % but exc. º).
 Temperature. kelvin. K. Mole. mole. mol. #l or L for volume. Current. ampere. A. Luminance. candela. cd. Units always lower-case#, neither italicised nor pleuralised (i.e. kg not KGS) and with space between value and unit (inc. % but exc. º).")
8
Discrete and Continuous Variables
Discrete Variables: Continuous Variables:

9
Indicators of Central Tendency
Mode Most Frequently Occurring Score Median Middle Score Mean Arithmetic Average.

10
Normal Distribution

11
Normal Distribution

12
Normal Distribution

13
Non-Normal Distribution

14
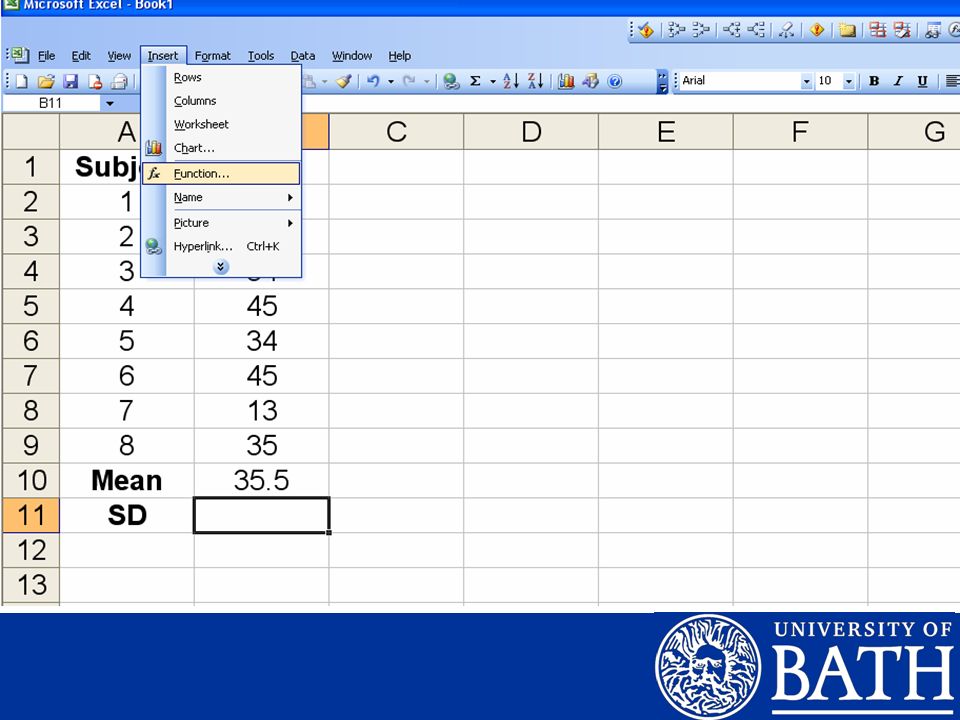
Hypothetical Investigation
“The effect of 1 week placebo supplementation on press-up performance” 8 randomly sampled participants Performed as many press-ups as possible Supplemented with placebo tablets for 1 week

15
Mean SD

19
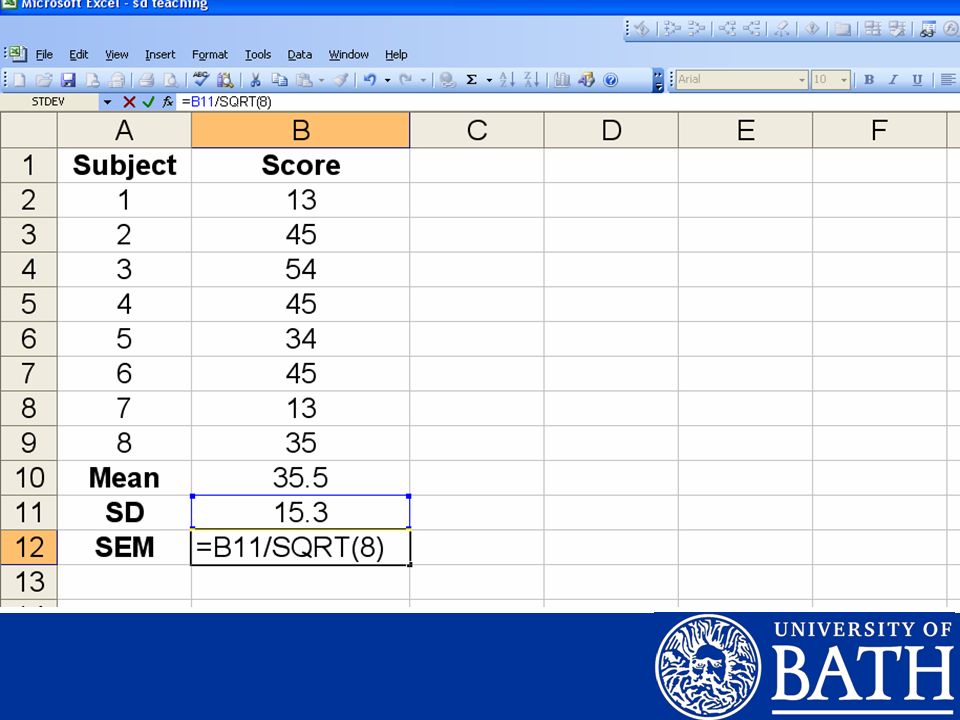
Standard Error of the Mean (SEM)
68.26% ????????????????????????????????????????????????????? Number of Press-ups

20
Standard Error of the Mean (SEM)
SD n SEM =

21
Mean SEM

23
Median & Range or IQR The mean SD or SEM cannot be used for non-normally distributed data Instead the median is often plotted along with either the range or the IQR Raw Data: 8, 10, 15, 20, 55, 75, 120, 179

25
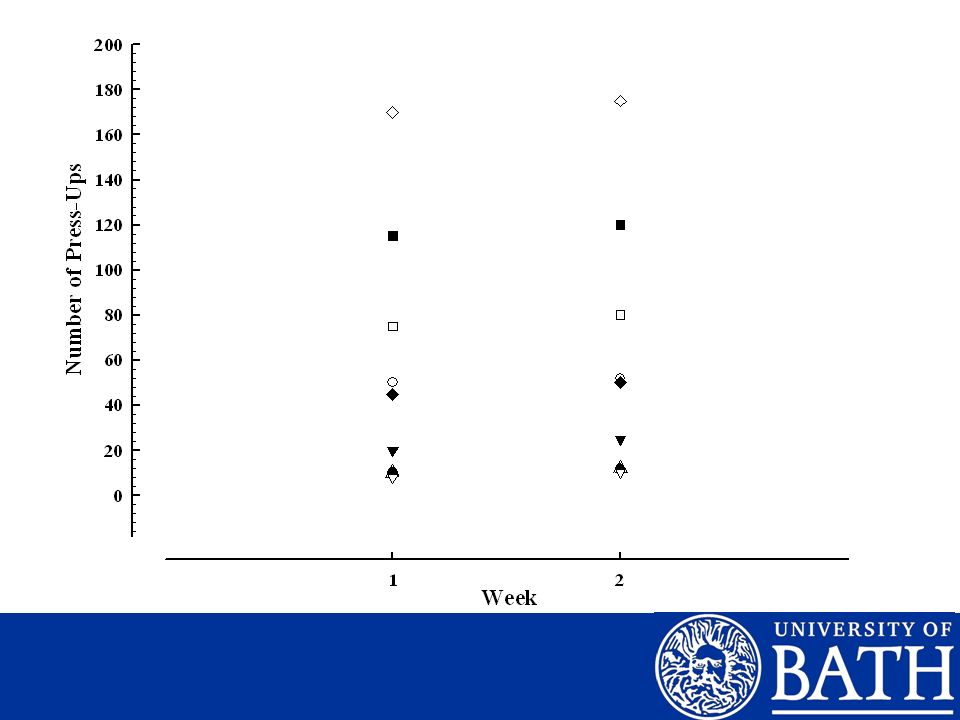
Put the data from each trial into SPSS…
Week 2 Week 1

26
Select ‘Analyze’, ‘GLM’, ‘Repeated Measures’…

27
Move variables from here…
…to here, click ok

28
ANOVA Output MSE n nCI = [criterion t (df)]
![ANOVA Output MSE n nCI = [criterion t (df)]](http://slideplayer.com/slide/781351/3/images/28/ANOVA+Output+MSE+n+nCI+%3D+%5Bcriterion+t+%28df%29%5D.jpg "ANOVA Output MSE n nCI = [criterion t (df)]")
29
t – Distribution Table Degrees of Freedom Critical t-ratio 1 2 3 4 5 6
(Google Search) Degrees of Freedom Critical t-ratio 1 2 3 4 5 6 7 8 12.71 4.30 3.18 2.78 2.57 2.45 2.37 2.31
 Degrees of Freedom. Critical t-ratio")
30
Mean nCI

31
Selected Reading Hopkins W. G. (2000) A New View of Statistics [Online] Auckland: Internet Society for Sport Science. Available at: [accessed October 3rd 2005] Masson, M. E. J. and G. R. Loftus. Using confidence intervals for graphically based data interpretation. Canadian Journal of Experimental Psychology. 57: , 2003.
 A New View of Statistics [Online] Auckland: Internet Society for Sport Science. Available at: [accessed October 3rd 2005] Masson, M. E. J. and G. R. Loftus. Using confidence intervals for graphically based data interpretation. Canadian Journal of Experimental Psychology. 57: ,")
Similar presentations


 address: Telephone: (27) 2233 Dont hesitate to get in touch.>")
>")
>")


: Revision of Univariate and Bivariate.>")


 – Descriptive Statistics.>")

 1. Nominal Scale: number is really a name! 1 = male 2 = female.>")
