Download presentation
Presentation is loading. Please wait.

1
The Water Cycle Ecclesiastes 1:7 All the rivers run into the sea; yet the sea is not full; unto the place from whence the rivers come, thither they return again

2
Fig. 4-1, p.78

3
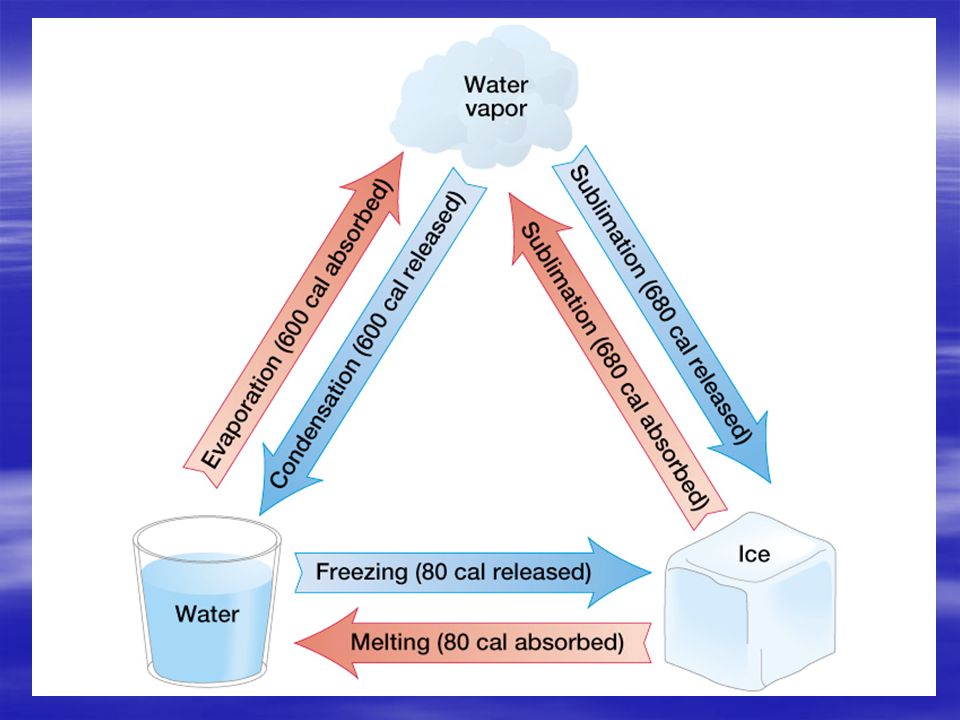
Structure of Water Water's unique molecular structure and hydrogen bonds enable all 3 phases to exist in earth's atmosphere. Sublimation & deposition describe the non-incremental changes between solid and vapor phases. Sublimation & deposition describe the non-incremental changes between solid and vapor phases. Figure 5.1 Figure 5.2

4
Evaporating Water into Air Figure 5.3A Evaporation:departures of water molecules from its surface Condensation : arrivals of molecules from adjacent vapor When air is saturated, evaporation and condensation are in equilibrium. When air is saturated, evaporation and condensation are in equilibrium. NRG is taken from the environment during evaporation and NRG is released to the environment by condensation

5
‘Latent Heat’ is the term that describes the NRG transferred/stored by water changing phase

7
Water in the atmosphere…

8
Absolute & Specific Humidity For a given mass of water vapor in an air parcel, the absolute humidity changes as the parcel volume changes (e.g., lifts or descends). Specific humidity is concerned with the mass of vapor to mass of air, and is not affected by changes in parcel volume. Absolute Humidity: mass of water vapor/volume of air Specific Humidity: mass of water vapor/total mass of air

9
Mixing ratio: Mass of water vapor/mass of dry air g/kg Mixing ratio and specific humidity do not change as long as water vapor is not added or subtracted from the parcel of air.

10
Specific Humidity vs. Saturation Figure 5.9 Warm air can absorb more vapor than cold air. For a given parcel of air, specific humidity declines from its highest in the tropics to its lowest in the colder poles.

11
Determining Vapor Pressure Average atmospheric pressure of 1013 mb is comprised in part by the weight of vapor molecules. Warmer air can absorb more vapor than cooler air before it saturates. Warmer air can absorb more vapor than cooler air before it saturates. Figure 5.10

12
Relative Humidity Water vapor/capacity to hold water vapor This is a measure of how much water vapor the air is holding divided by the amount of water vapor the a given parcel of air CAN hold. Expressed as a percentage Changes in RH occur by changing the water vapor content or changing the temperature of the air parcel

13
Relative Humidity Trends Relative humidity (RH) indicates air parcel proximity to saturation. Saturation can be achieved, or RH increased, by adding more water or dropping the air temperature. Saturation can be achieved, or RH increased, by adding more water or dropping the air temperature. Dew point is the temperature at which saturation occurs. Dew point is the temperature at which saturation occurs. Figure 5.11

14
Seasonal Dew Point Maps January, July, dew point

15
Dew Point vs. Relative Humidity Dew point is the temperature for saturation, and used with a vapor pressure curve reveals the mass of vapor in the air. While relative humidity may be higher in polar air, more water is actually absorbed in desert air (warm air holds more water). While relative humidity may be higher in polar air, more water is actually absorbed in desert air (warm air holds more water).
. While relative humidity may be higher in polar air, more water is actually absorbed in desert air (warm air holds more water)..")
16
Relative and Specific Humidity Relative humidity (RH) as an indicator of saturation reveals that desert air is far from saturated, and that cold polar air nears saturation. Graphs of RH contrast with specific humidity in the deserts and poles. Graphs of RH contrast with specific humidity in the deserts and poles. Figure 5.14 Figure 5.9

17
Sources of Moisture Patterns of US humidity are strongly governed by wind direction and ocean temperatures. Cooler Pacific waters create lower humidities in the west, while warmer Gulf waters generate high humidity along the southeast and east coast. Cooler Pacific waters create lower humidities in the west, while warmer Gulf waters generate high humidity along the southeast and east coast. Figure 5.15

18
Relative Humidity and Comfort Unsaturated air may absorb more water from the evaporation of human sweat. The departure of fast moving, and by definition higher temperature, water molecules into the vapor phase cools the human skin. The departure of fast moving, and by definition higher temperature, water molecules into the vapor phase cools the human skin. In winter, this process can make a dry house extra chilly. In winter, this process can make a dry house extra chilly.

19
Heat Index & Safety Figure 5.16 Human perception of temperature is distinct from measured air temperature, and is particularly different at higher humidities when the human body is less efficient at sweating and self- cooling. On hot days, fans that move saturated air away from the skin help humans avoid unwanted heat syndromes. On hot days, fans that move saturated air away from the skin help humans avoid unwanted heat syndromes.

21
Measuring Relative Humidity The simplest tool is the sling psycrometer This tool uses two thermometers A standard scale is provided in your text in AppendixD One is dry the other has a small ‘sock’ a cloth cover that is soaked with water When the instrument is spun around, liquid water evaporates from the ‘sock’ lowering the temperature… the amount of water that evaporates indicates the amount of water that CAN evaporate… thus indicating the relative humidity.

22
Sling Psychrometer Figure 5.17 Wet bulb temperature indicates how cool a surface will become by evaporating water into the air, and when compared with the dry bulb, or regular, air temperature it indicates relative humidity. These two temperatures are measured by this instrument. These two temperatures are measured by this instrument.

23
Hair & Other Hygrometers Human and horse hair becomes roughly 2.5% shorter as relative humidity drops from 100% to 0%, which is the principle operating the hair hygrometer. Other hygrometers are based on electrical resistance, infrared absorption, and dew point condensation. Other hygrometers are based on electrical resistance, infrared absorption, and dew point condensation. Figure 5.18

24
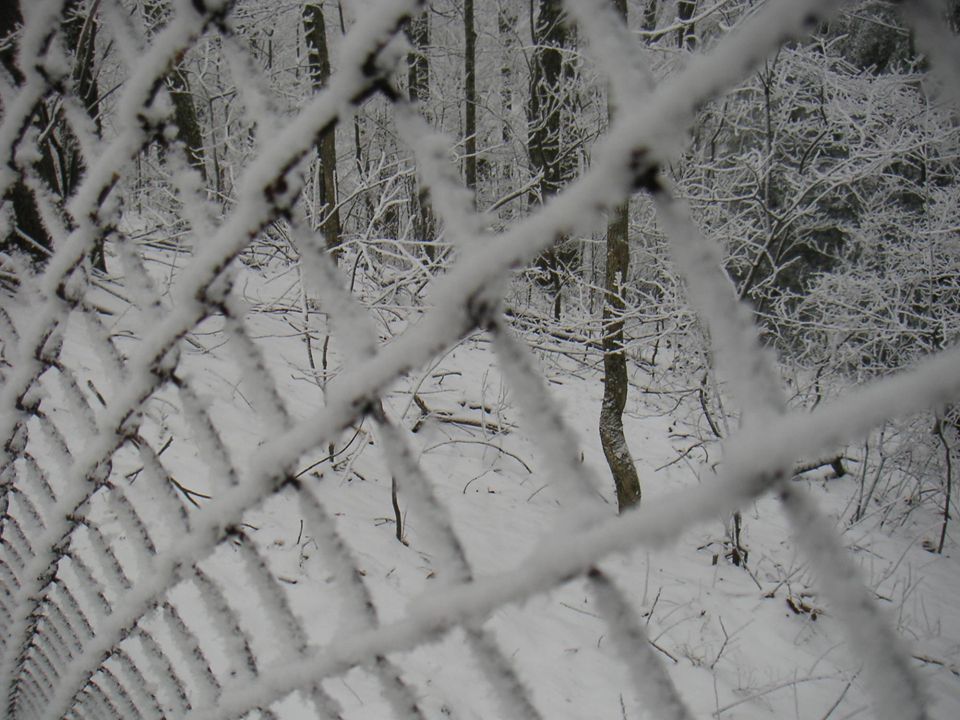
Formation of Dew & Frost As air cools to its saturation, or dew point, vapor molecules slow down and can adhere as dew on the ground surface or as frost when air temperature drops below freezing. Daily temperature lows often occur by radiational cooling, forming dew at night or early morning. Figure 6.1 Figure 6.2

29
Haze & Water Seeking Nuclei Above the ground surface, cooling and slowing water vapor instead condenses upon condensation nuclei. Hygroscopic particles such as salt or dust seek condensing vapor, and can form a wet white haze when relative humidity is above 75%, or a dry blue haze when drier. Figure 6.3

31
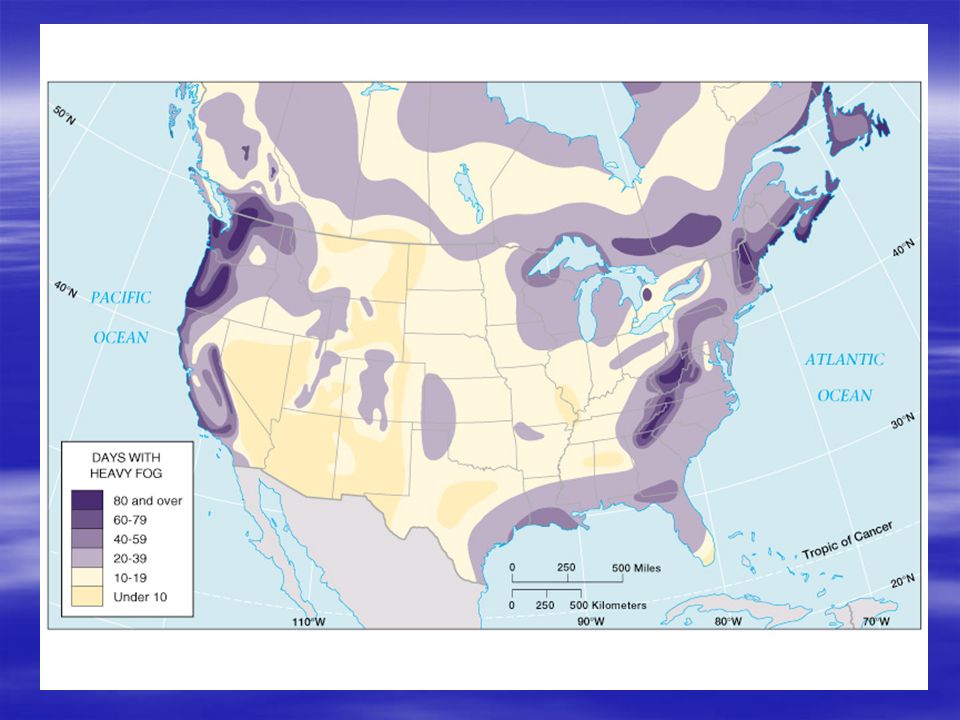
Fog & Human Safety Figure 6.8 Foggy days in the US have a predictable distribution due to ocean and mountain influences. Fog can help crop growth in California, but can also cause severe automobile, airplane, and boating accidents. As a result, there are several fog dispersal experiments.

33
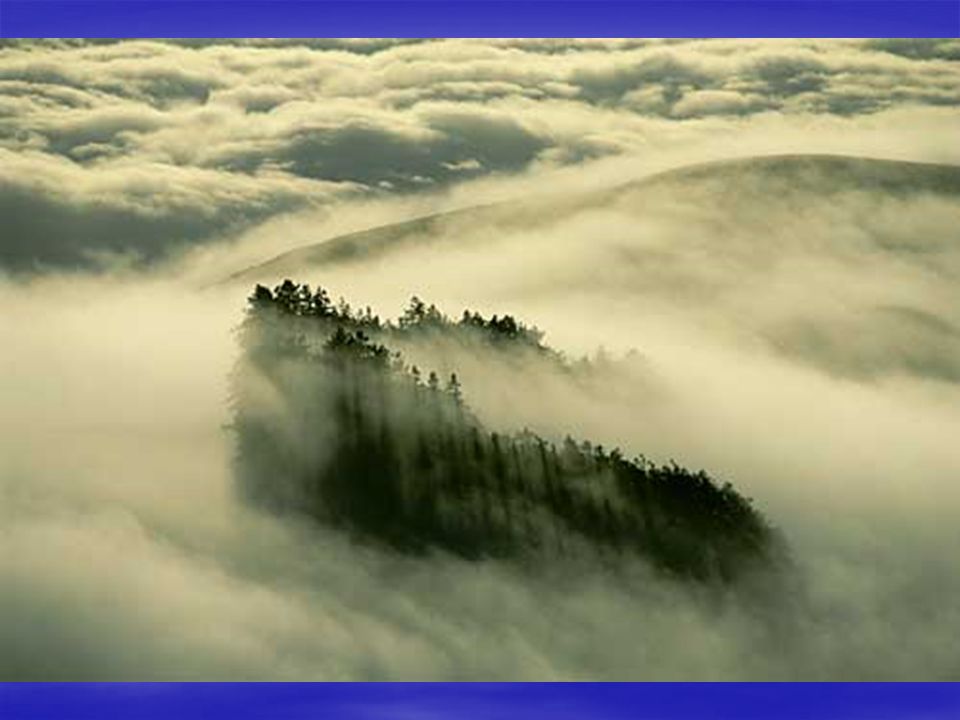
Condensation & Moisture Sources Figure 6.6 Fog that is filtered by tree branches, or condensation of vapor directly onto vegetation or the ground surface, provides an important water source for ecological processes. FOG DRIP

36
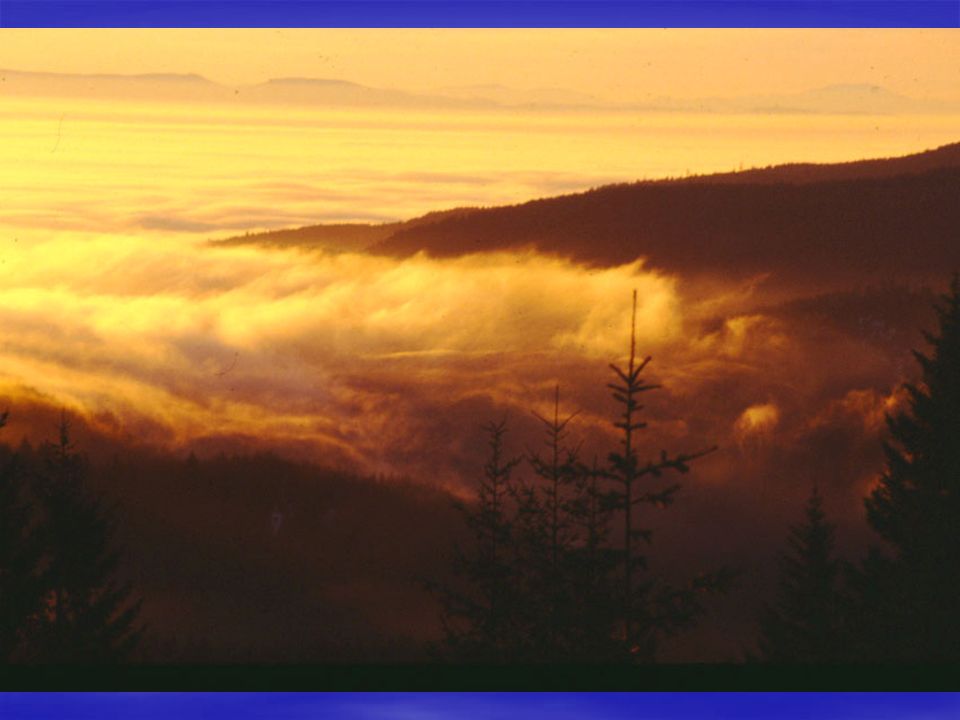
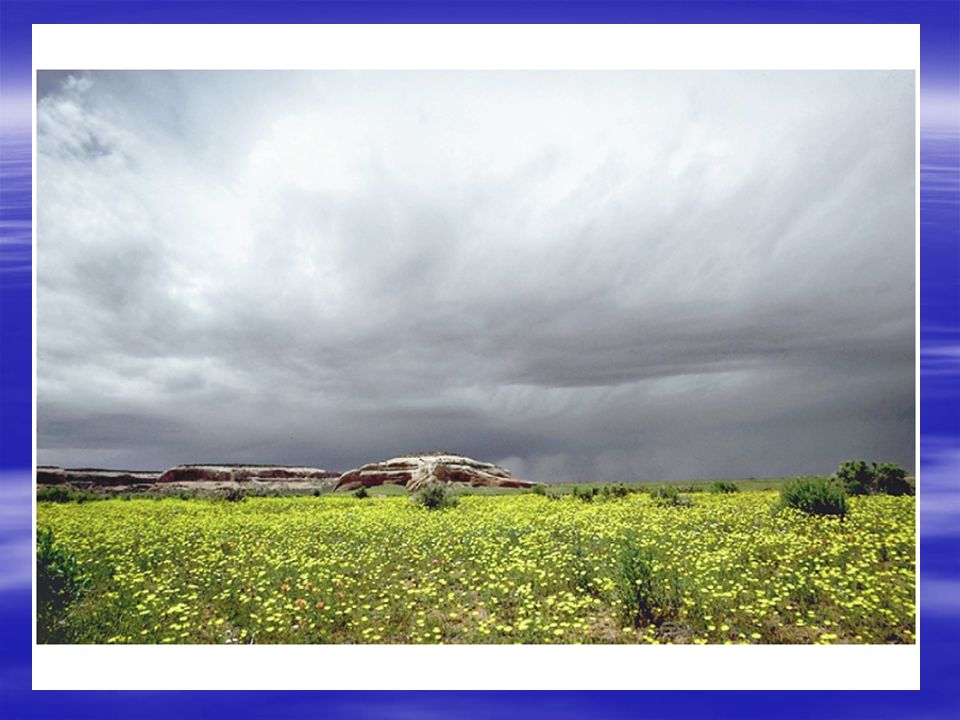
Ground Based Radiation Fog Figure 6.4 Fog is condensed vapor droplets at a density that severely restricts visibility. It may form by radiation fog, which occurs at the ground when dew point temperature is reached by radiational cooling. Acid fog threatens humans health because the droplets combine with gaseous pollutants.

41
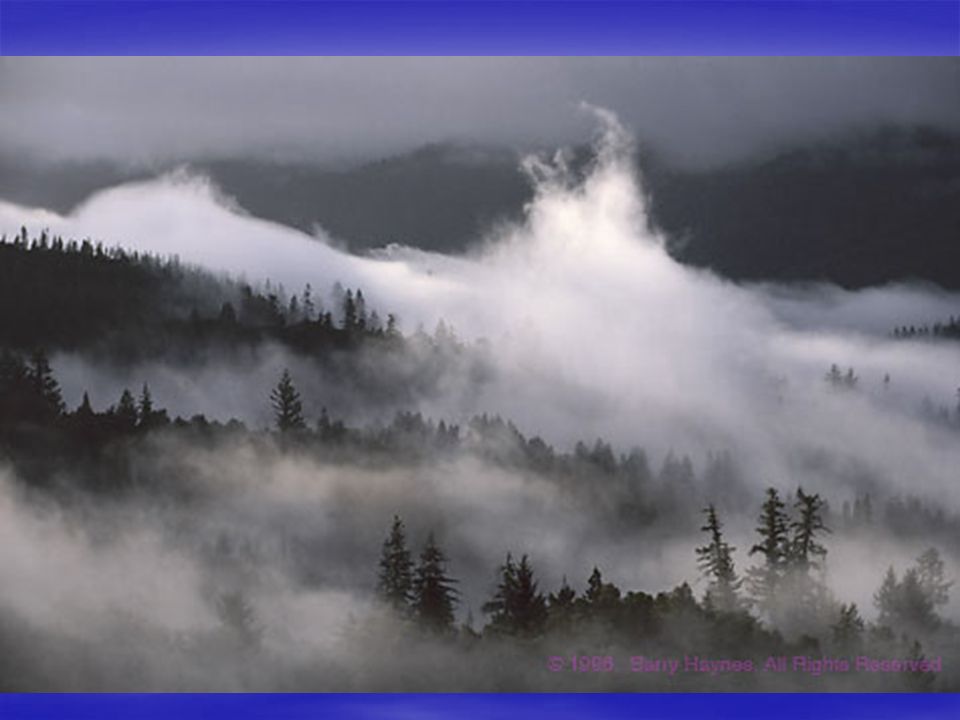
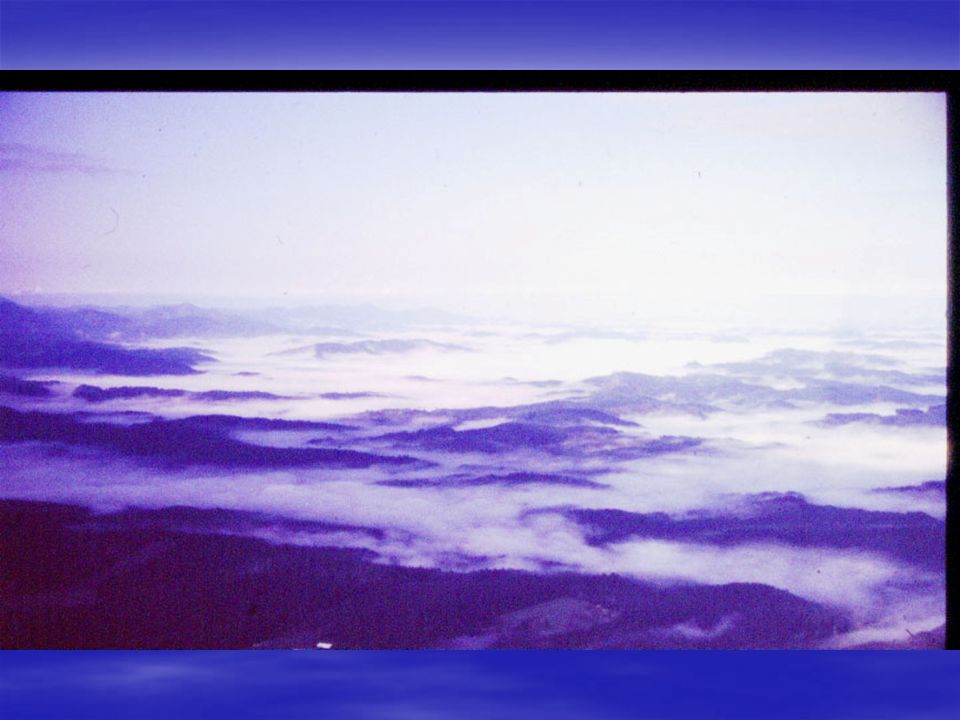
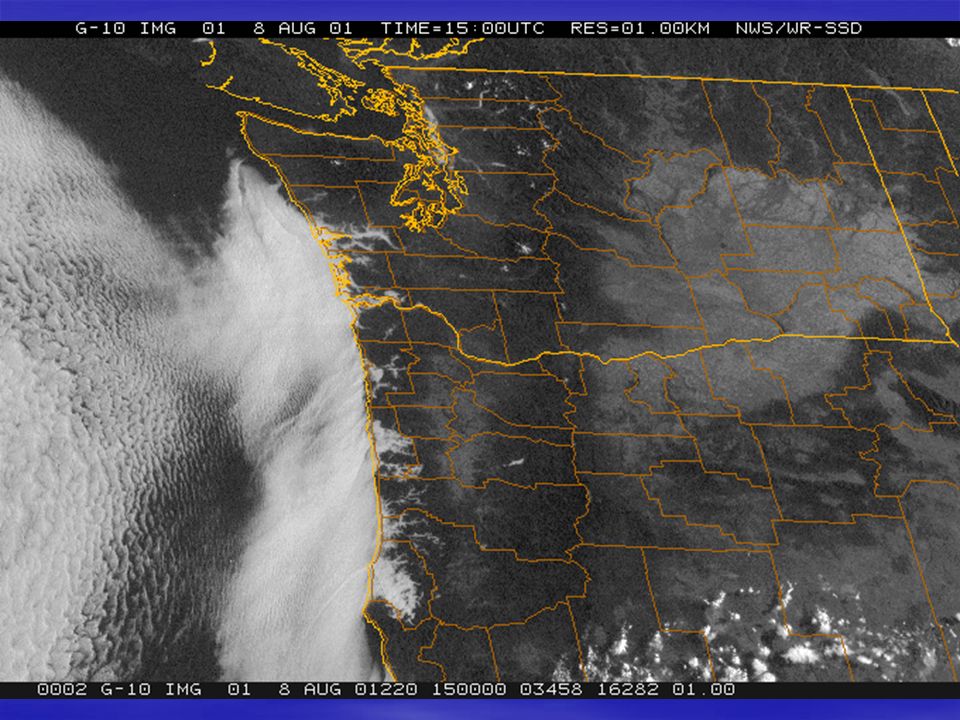
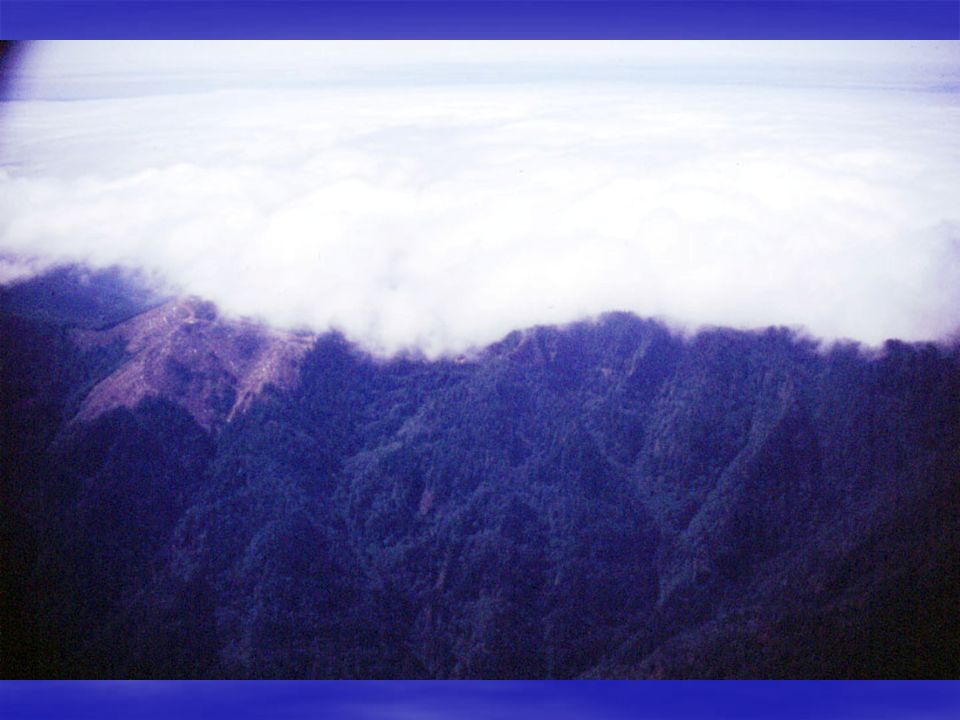
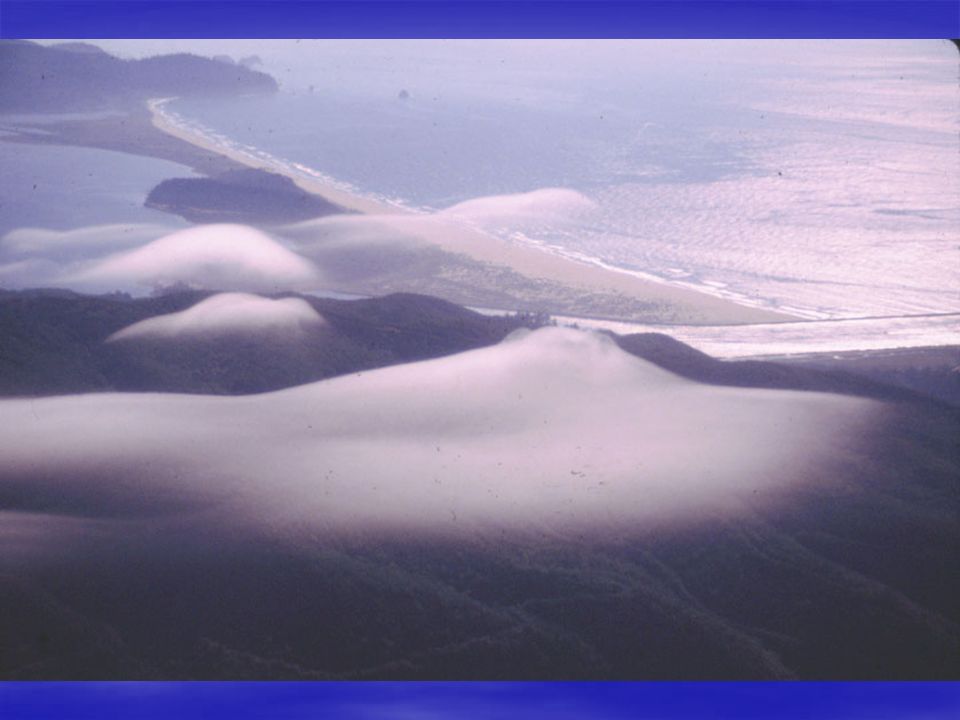
Advection Fog Warm moist air that moves, or advects, above a cold surface may become cooled to its dew point temperature, creating an advection fog. This fog often forms above the ocean due to mixing currents, or when warm ocean air rolls into the cooler waters at the Pacific Coastline. Figure 6.5

45
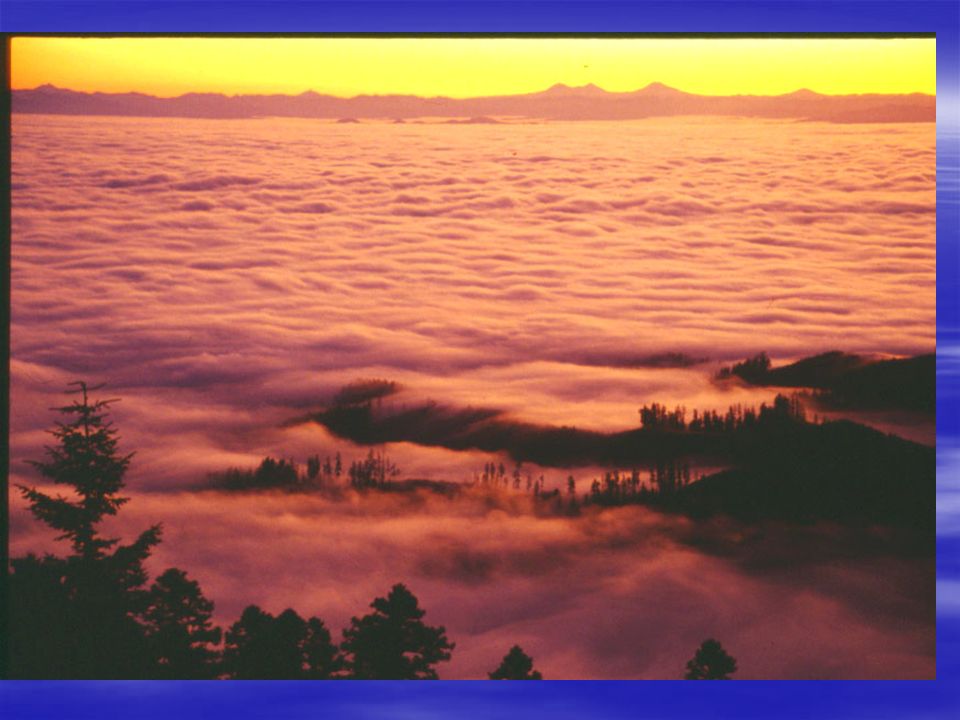
Evaporation or Mixing Fog Fog can form by mixing warm unsaturated air with cool unsaturated air, which can occur during evaporation. Steam fog is on example of this mixing process and occurs when warm pools of water are a source for vapor that condense into the cooler air above. Figure 6.7

46
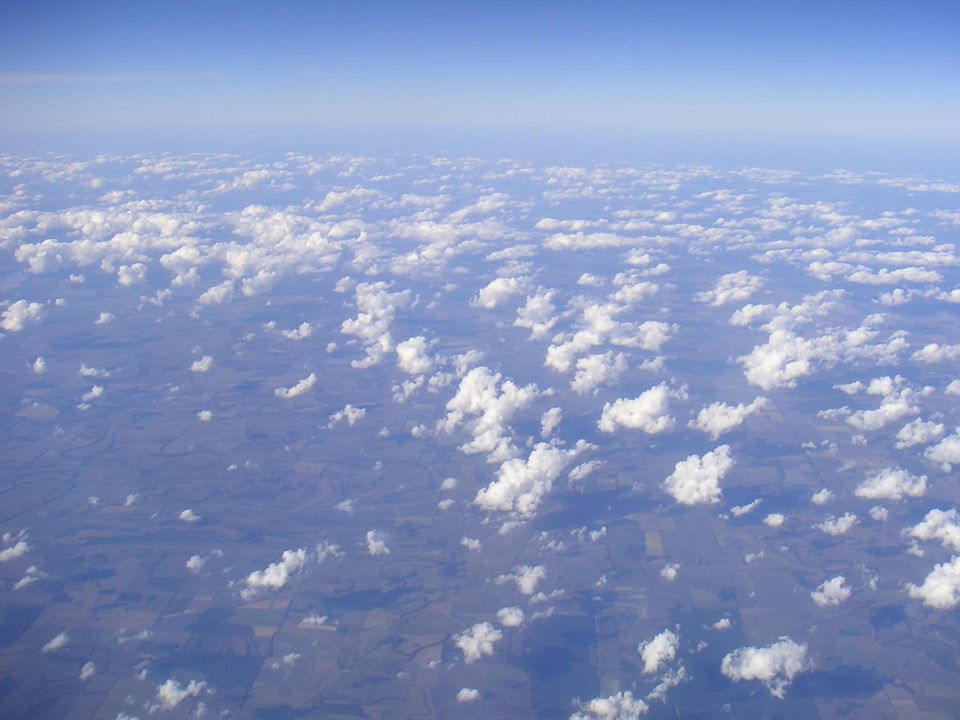
Cloud Groups & Types Clouds are water droplets suspended in the atmosphere. Clouds are grouped by their elevation as high, middle, low, and those that vertically stretch across many altitudes. There are several cloud types in these 4 groups.

47
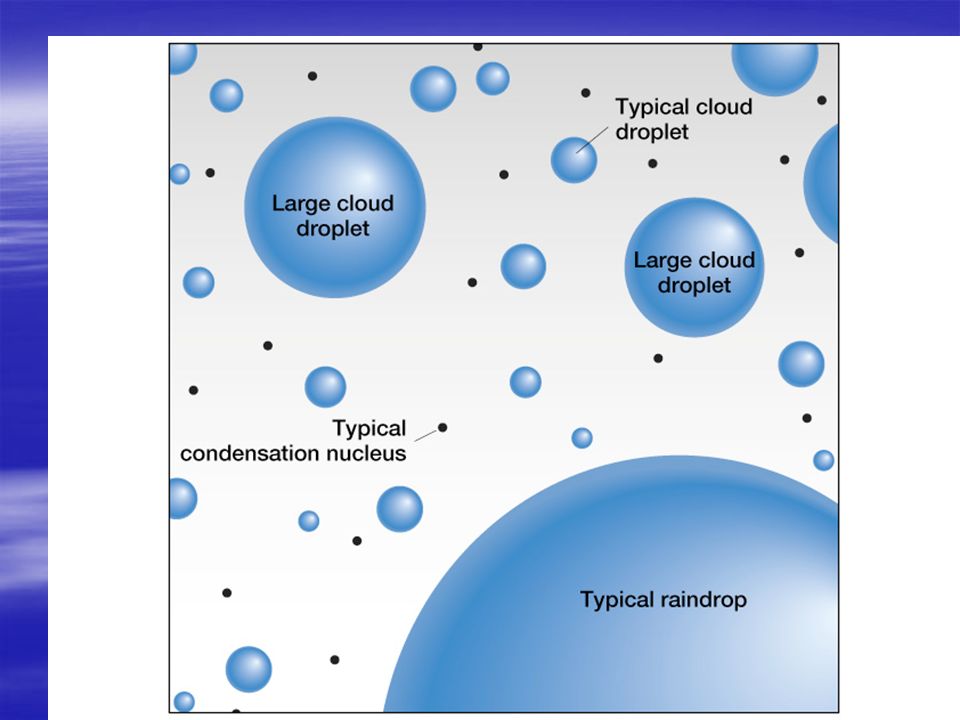
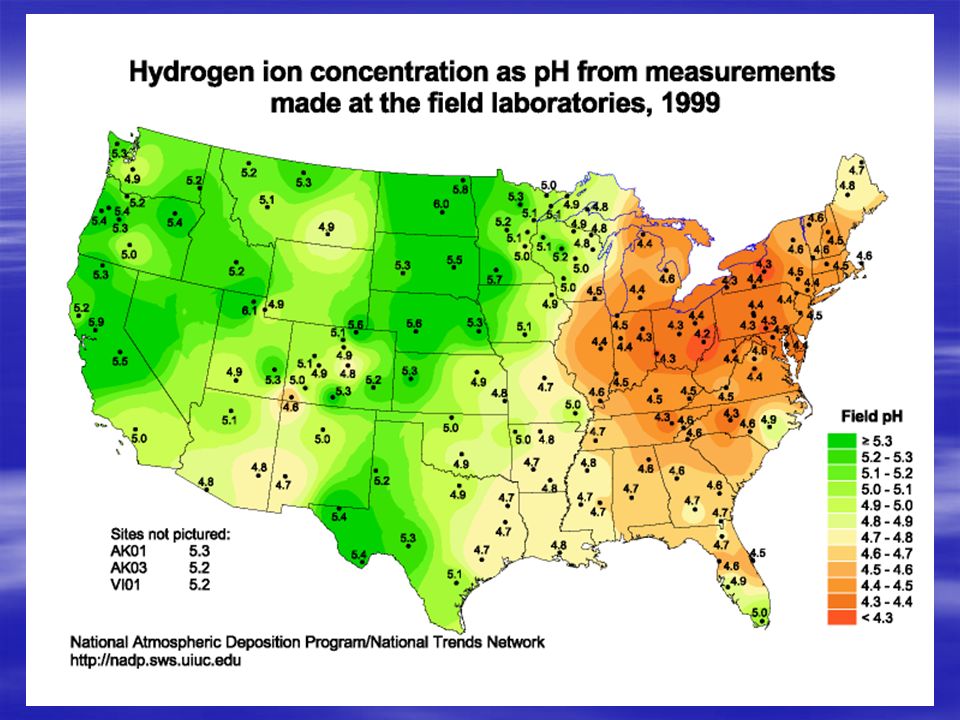
Condensation onto Nuclei Condensation of water vapor into liquid water is more likely to occur when the vapor cools and slows, and attaches to nuclei. Heated vapor moves so fast that it bounces away from condensation nuclei Heated vapor moves so fast that it bounces away from condensation nuclei Figure 5.4A Common condensation nuclei in the atmosphere: dust, salt, smoke (acid rain)
.")
49
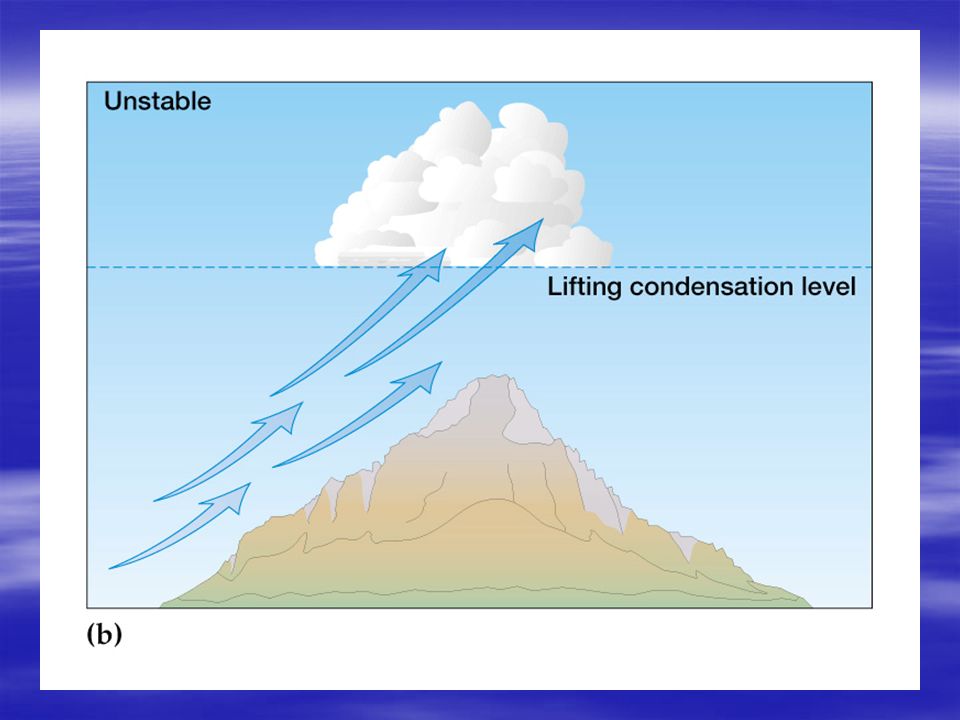
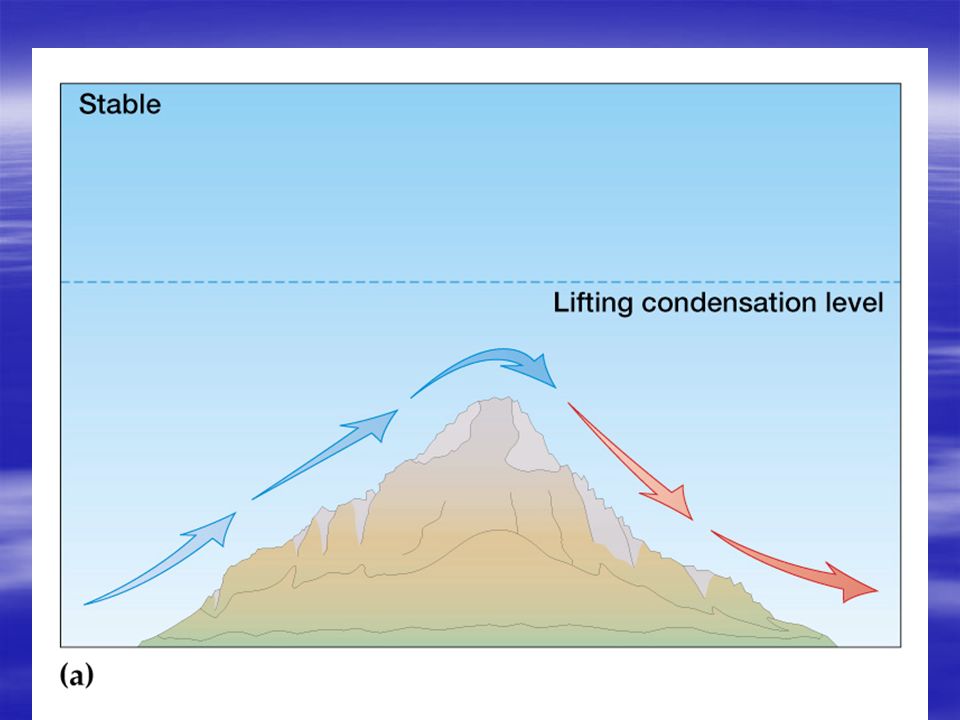
Cooling the Air…. Cool air can carry less moisture When air is cooled, water vapor condenses Condensation forms clouds and is the source of precipitation. When air is lifted, it cools. Sources of lifting: –Orographic lift –Frontal lifting –Convective lifting –Convergent lifting

51
Orographic Lift

60
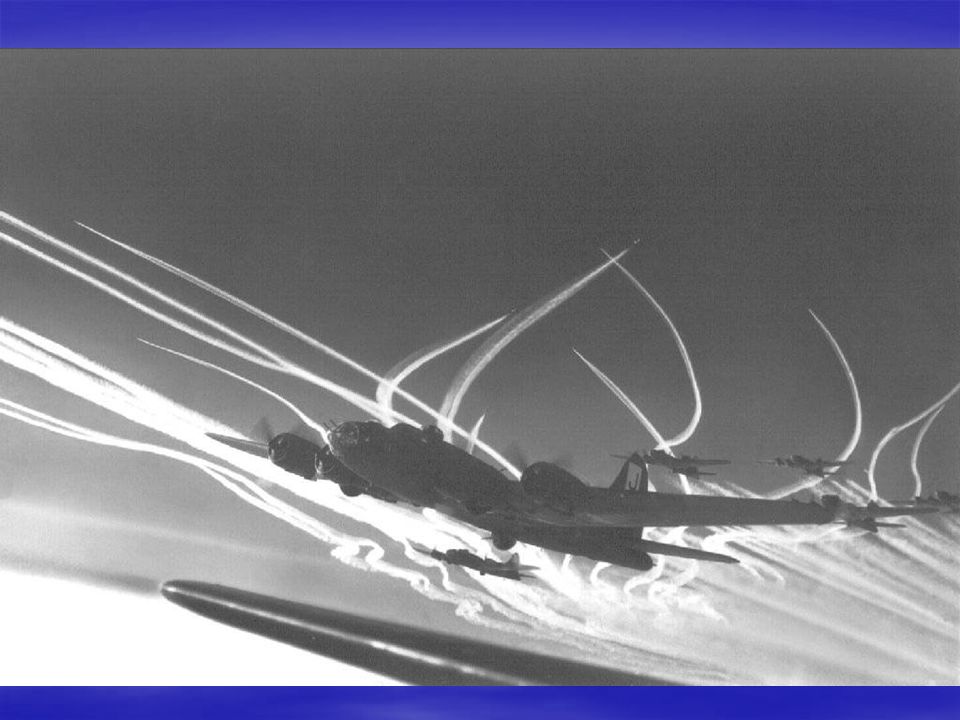
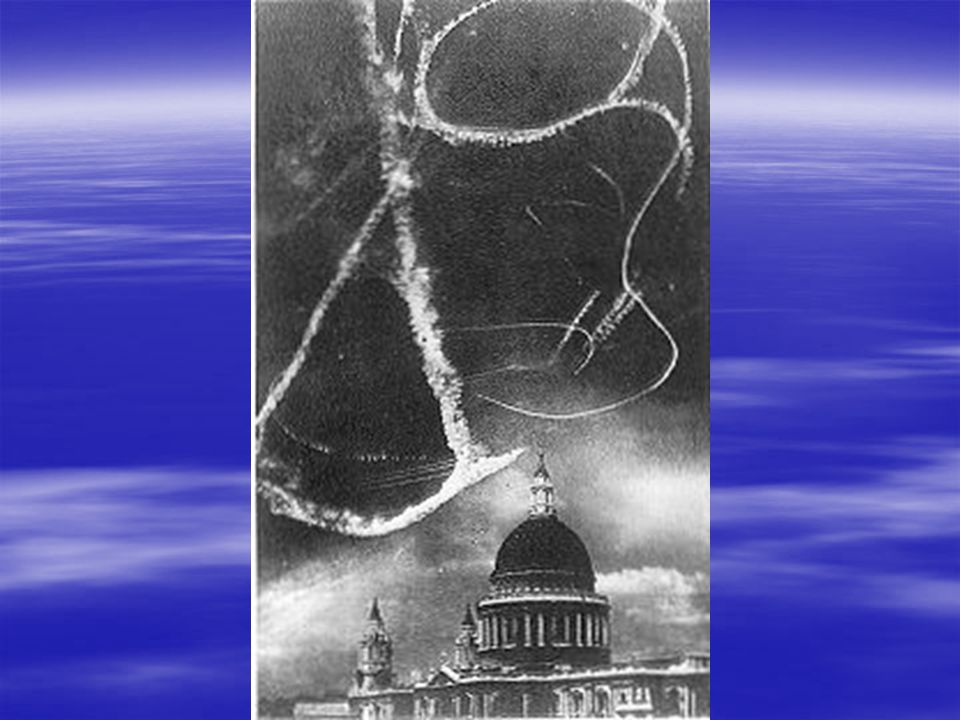
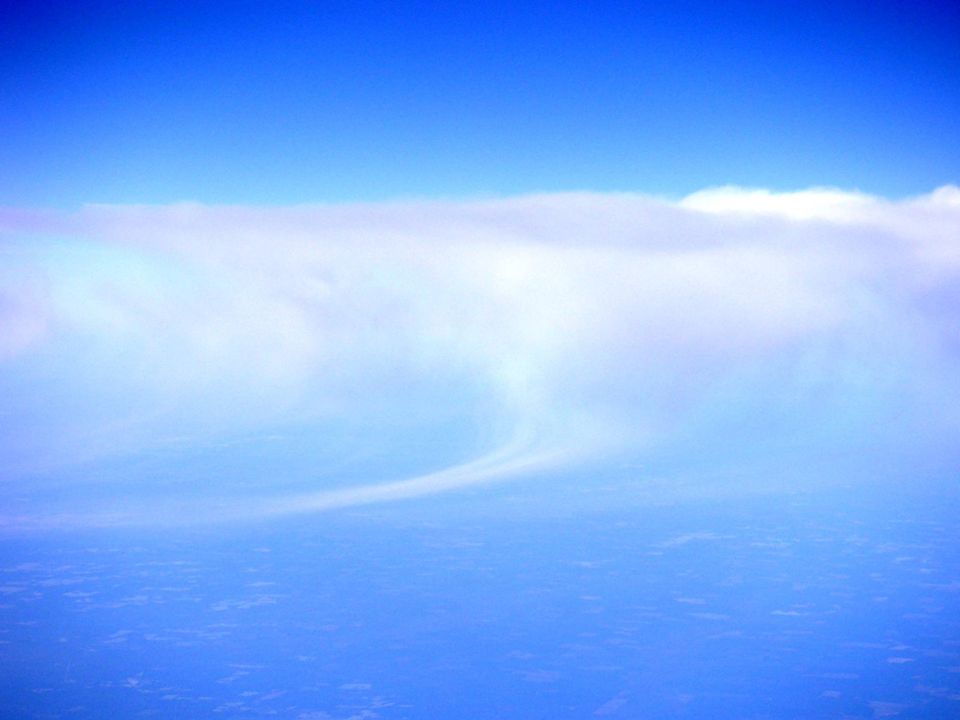
Jet Contrails Figure 6.25 Jet engine exhaust provides vapor and nuclei for condensation trails (contrails), which evaporate quickly in dry air, but linger with higher relative humidities.
, which evaporate quickly in dry air, but linger with higher relative humidities.")
62
P-51 Mustangs of the 325 th Fighter Group Fly top cover for B-24s en route to targets in German occupied Europe (photo by John Gaston) The much faster fighters flew long curving flight paths in order to stay back with the bombers they were tasked to escort.
 The much faster fighters flew long curving flight paths in order to stay back with the bombers they were tasked to escort.")
66
Summary of Cloud Types Figure 6.20

67
Stratocumulus Clouds Low clouds with rounded patches that range in color from light to dark gray. With your hand extended overhead, they are about the size of your palm. Figure 6.15

68
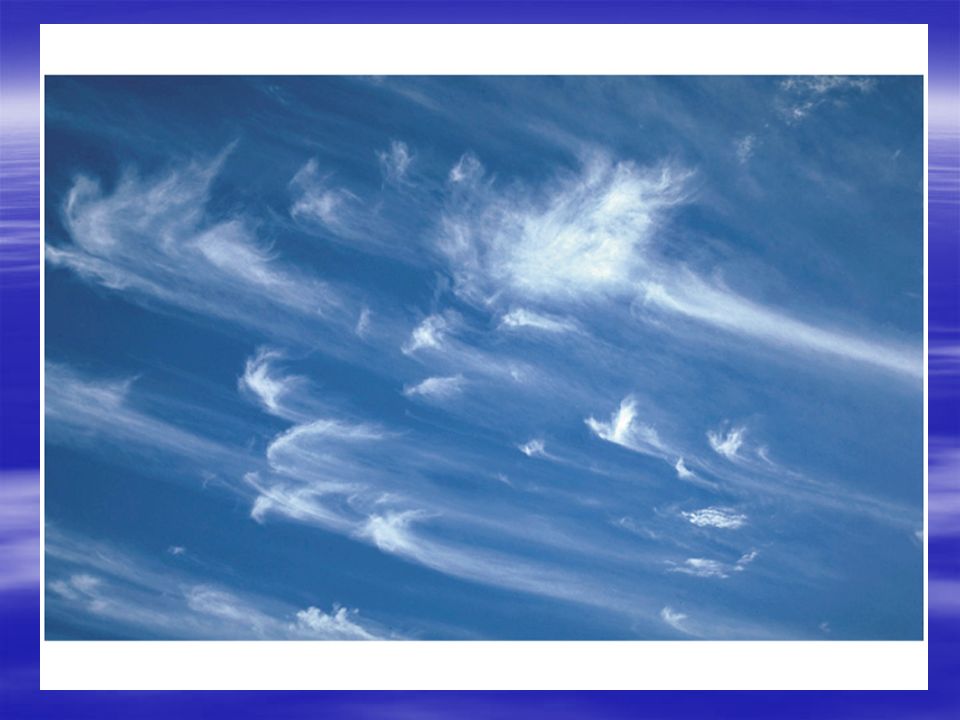
Cirrus Clouds High clouds (above 6000 m in middle latitudes) that are thin and wispy and comprised mostly of ice crystals. Figure 6.9

69
Cirrocumulus Clouds Figure 6.10 High clouds that are rounded puffs, possibly in rows, are less common than cirrus.

70
Cirrostratus Clouds High clouds that thinly cover the entire sky with ice crystals. Light passing through these crystals may form a halo. Figure 6.11

71
Altocumulus Clouds Figure 6.12 Middle clouds (between 2000 and 7000m in middle latitudes) that are puffy masses of white with gray edges. With your hand overhead, they are about the size of your fingernail.

73
Altostratus Clouds Middle clouds that cover the entire sky and may create a dimly visible or watery sun and diminish formation of shadows. Figure 6.13

74
Nimbostratus Cloud Figure 6.14 Low clouds (below 2000m) with precipitation that reaches the ground. Shredded parts of these clouds are called stratus fractus or scud.

75
Stratus Clouds Figure 6.16 Low clouds that resembles a fog, but does not reach the ground, and can generate a light mist or drizzle.

76
Cumulus Humilis Clouds Clouds with vertical development that take a variety of shapes, separated by sinking air and blue sky. Shredded sections are called cumulus fractus. Figure 6.17

77
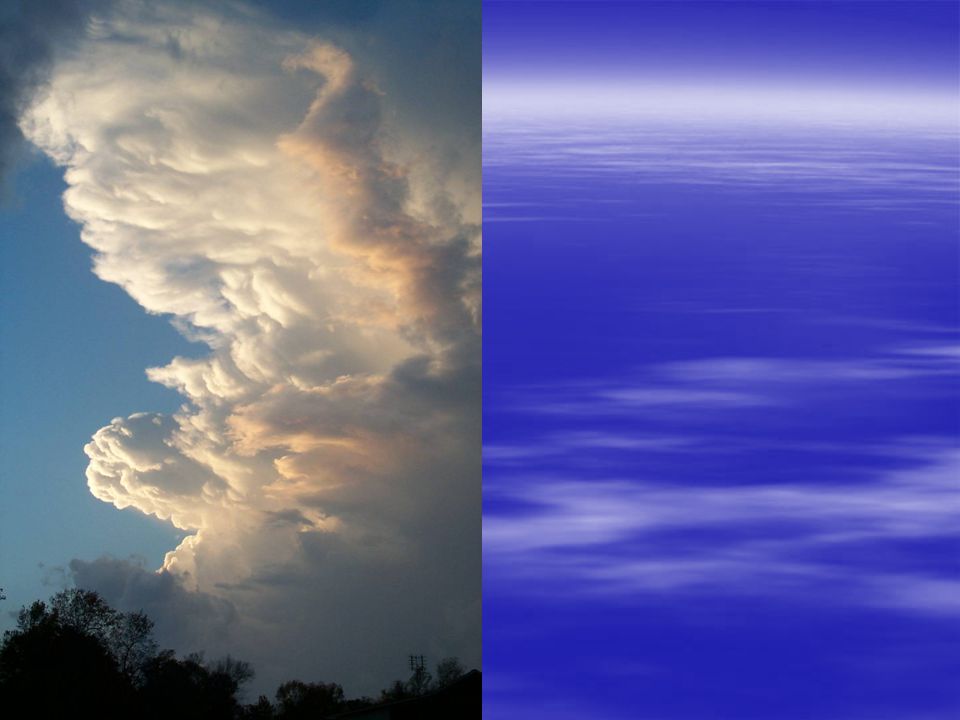
Cumulus Congestus Clouds Figure 6.18 Clouds with vertical development that become larger in height, with tops taking a ragged shape similar to cauliflower.

78
Pileus Cloud Figure 6.23 An unusual cloud that forms above a building cumulus by deflected moist winds.

80
Mammatus Clouds An unusual cloud that hang like sacks, formed by sinking air with a high water content. Figure 6.24

81
Nacreous Clouds An unusual cloud best viewed at winter in the poles and forms in the stratosphere. Figure 6.26

82
Noctilucent Clouds Figure 6.27 An unusual wavy cloud that is best viewed at the poles and forms in the upper mesosphere.

83
Ground based Viewing of Clouds Clouds directly overhead will appear to be less densely packed than clouds at the horizon due to viewing angles. Figure 6.28

85
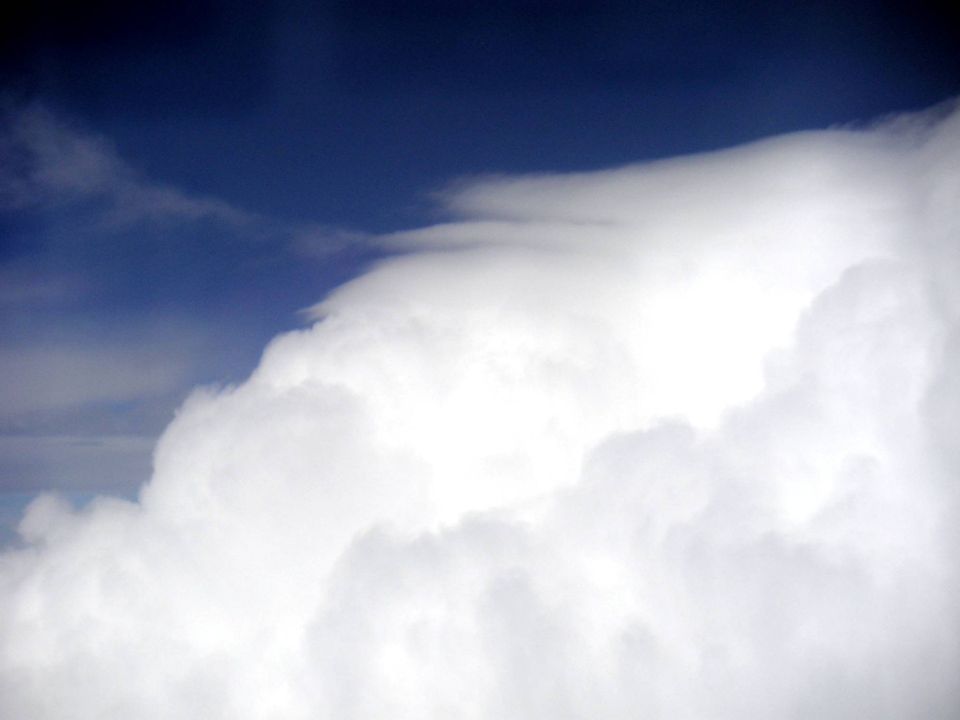
Lenticular Clouds Figure 6.21 An unusual cloud that has a lens shape and forms in the crest of a wave.

86
A lenticular cloud that forms downwind of a mountain peak and is regularly replenished by condensing water vapor. Figure 6.22

94
Photo by Chris Terry

Similar presentations


 – The movement of water between.>")

 results from:>")