Download presentation
Presentation is loading. Please wait.

1
North American Isoprene Emissions Measured from Space Paul Palmer Harvard University ACD seminar series, NCAR, January 14, 2002

2
Talk Overview Relating HCHO columns to VOC emissions Global 3d model analysis GOME HCHO columns Are different HCHO data consistent? GOME isoprene emissions

3
Overall Approach

4
Talk Overview Relate HCHO columns to VOC emissions Global 3d model analysis HCHO from GOME Are different HCHO data consistent? GOME isoprene emissions

5
HCHO + h 2HO 2 + CO H 2 + CO HCHO + OH HO 2 + CO + H 2 O VOC + OH...... n HCHO + OTHER PRODUCTS VOCs, HCHO and tropospheric O 3 VOC

6
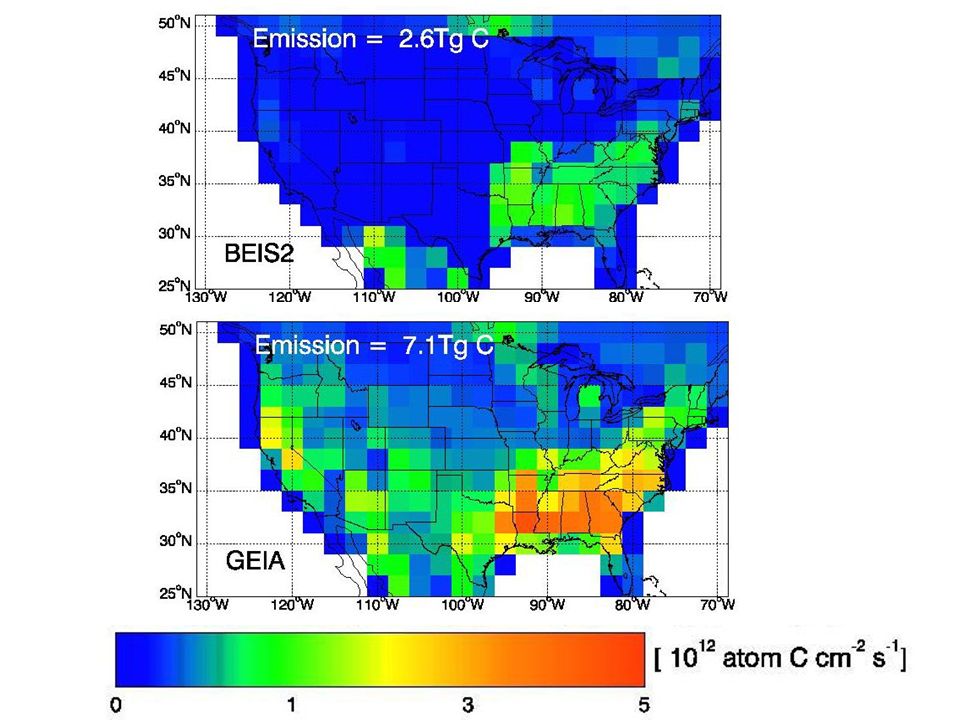
EPA BEIS2 isoprene GEIA isoprene

7
ppb Summertime in situ HCHO datasets Fried et al 1997 Harris et al 1989 Kleindienst et al 1988 Lee et al 1995, 1998 Martin et al 1991 McKeen et al 1997 OZIE - Guenther Reimer et al 1998 Shepson et al 1991

8
Relating HCHO columns to VOC emissions Absence of transport = Y i E i i VOC i Emission E i k HCHO

9
HCHO yields from VOCs SpeciesEmission [TgC month -1 ] HCHO Yield [C -1 ] Potential HCHO production [%] CH 4 2.6 1.0 28.5 ISOP 7.3 0.45 32.0 - pinenes 1.1 0.8 0.019 0.045 0.23 0.39 MBO 0.8 0.06 0.53 HCHO 0.15 1.0 1.64 CH 3 OH 2.1 1.0 23.0 Total: 86%
![HCHO yields from VOCs SpeciesEmission [TgC month -1 ] HCHO Yield [C -1 ] Potential HCHO production [%] CH ISOP - pinenes MBO HCHO CH 3 OH Total: 86%](http://images.slideplayer.com/25/7772592/slides/slide_9.jpg "HCHO yields from VOCs SpeciesEmission [TgC month -1 ] HCHO Yield [C -1 ] Potential HCHO production [%] CH ISOP - pinenes MBO HCHO CH 3 OH Total: 86%")
10
VOC Y i HCHO Define a displacement length scale and smearing length scale kiki Horizontal transport displaces and smears HCHO signal

11
Limiting values : L s,i U/k i when k i « k HCHO L s,i U/k HCHO when k HCHO « k i midmorning eg values K HCHO = 0.5h -1 ; U = 20kmh -1 ; [OH]=5E6 mol cm -3 ISOP L d,i & L s,i 40 km CH 4 L d,i & L s,i = many 1000s km CH 3 OH L d,i =250 km; L s,i = 1000 km ~ GOME obs
![Limiting values : L s,i U/k i when k i « k HCHO L s,i U/k HCHO when k HCHO « k i midmorning eg values K HCHO = 0.5h -1 ; U = 20kmh -1 ; [OH]=5E6 mol cm -3 ISOP L d,i & L s,i 40 km CH 4 L d,i & L s,i = many 1000s km CH 3 OH L d,i =250 km; L s,i = 1000 km ~ GOME obs](http://images.slideplayer.com/25/7772592/slides/slide_11.jpg "Limiting values : L s,i U/k i when k i « k HCHO L s,i U/k HCHO when k HCHO « k i midmorning eg values K HCHO = 0.5h -1 ; U = 20kmh -1 ; [OH]=5E6 mol cm -3 ISOP L d,i & L s,i 40 km CH 4 L d,i & L s,i = many 1000s km CH 3 OH L d,i =250 km; L s,i = 1000 km ~ GOME obs")
12
GEOS-CHEM global 3D model: 101 Driven by GEOS met data 2x2.5 o resolution/26 vertical levels O 3 -NO x -VOC chemistry GEIA isoprene emissions Aerosol scattering: AOD:O 3 Dickerson et al, [1997]
![GEOS-CHEM global 3D model: 101 Driven by GEOS met data 2x2.5 o resolution/26 vertical levels O 3 -NO x -VOC chemistry GEIA isoprene emissions Aerosol scattering: AOD:O 3 Dickerson et al, [1997]](http://images.slideplayer.com/25/7772592/slides/slide_12.jpg "GEOS-CHEM global 3D model: 101 Driven by GEOS met data 2x2.5 o resolution/26 vertical levels O 3 -NO x -VOC chemistry GEIA isoprene emissions Aerosol scattering: AOD:O 3 Dickerson et al, [1997]")
13
GEOS-CHEM HCHO columns July 1996 [ 10 16 molec cm -2 ] GEIA isoprene emissions
![GEOS-CHEM HCHO columns July 1996 [ molec cm -2 ] GEIA isoprene emissions](http://images.slideplayer.com/25/7772592/slides/slide_13.jpg "GEOS-CHEM HCHO columns July 1996 [ molec cm -2 ] GEIA isoprene emissions")
14
NWNE SESW Isoprene emission [10 13 atomC cm -2 s -1 ] Model HCHO column [10 16 molec cm -2 ] July 1996 (25-50 o N, 65-130 o W) Slope S = Y/k HCHO
![NWNE SESW Isoprene emission [10 13 atomC cm -2 s -1 ] Model HCHO column [10 16 molec cm -2 ] July 1996 (25-50 o N, o W) Slope S = Y/k HCHO](http://images.slideplayer.com/25/7772592/slides/slide_14.jpg "NWNE SESW Isoprene emission [10 13 atomC cm -2 s -1 ] Model HCHO column [10 16 molec cm -2 ] July 1996 (25-50 o N, o W) Slope S = Y/k HCHO")
15
nS [10 3 s] r2r2 W lifetime [hours] Y [C -1 ] NW18102.040.511.670.34 NE21931.900.431.760.30 SE19132.090.651.480.39 SW17501.270.491.480.24 Yields consistent with photochemical model
![nS [10 3 s] r2r2 W lifetime [hours] Y [C -1 ] NW NE SE SW Yields consistent with photochemical model](http://images.slideplayer.com/25/7772592/slides/slide_15.jpg "nS [10 3 s] r2r2 W lifetime [hours] Y [C -1 ] NW NE SE SW Yields consistent with photochemical model")
16
Nadir-viewing SBUV instrument Launched April 1995 Pixel 320 x 40 km 2 10.30 am cross-equator time Global coverage in 3 days O 3, NO 2, BrO, OClO, SO 2, HCHO, H 2 O, & cloud coverage Global Ozone Monitoring Experiment

17
HCHO slant column fitting 3 x 10 16 molec cm -2 8 x 10 16 molec cm -2 1 fitting uncertainty 4 x 10 15 molec cm -2 Chance et al [2000] O 3 NO 2 BrO O 2 -O 2
![HCHO slant column fitting 3 x molec cm -2 8 x molec cm -2 1 fitting uncertainty 4 x molec cm -2 Chance et al [2000] O 3 NO 2 BrO O 2 -O 2](http://images.slideplayer.com/25/7772592/slides/slide_17.jpg "HCHO slant column fitting 3 x molec cm -2 8 x molec cm -2 1 fitting uncertainty 4 x molec cm -2 Chance et al [2000] O 3 NO 2 BrO O 2 -O 2")
18
vertical column = slant column /AMF Palmer et al, [2001]
![vertical column = slant column /AMF Palmer et al, [2001]](http://images.slideplayer.com/25/7772592/slides/slide_18.jpg "vertical column = slant column /AMF Palmer et al, [2001]")
19
AMF example - Tennessee GEOS-CHEM S ( ) w( ) S ( ) w( ) AMF G 2.08 AMF 0.71 AMF calculation every GOME July 1996 scene...
 w( ) S ( ) w( ) AMF G 2.08 AMF 0.71 AMF calculation every GOME July 1996 scene...")
20
GOME HCHO – July 1996 Chance et al, 2000; Palmer et al, 2001 Filtered for cloudy scenes (cf > 40%)
")
21
GOME HCHO – July 1996 Bias = 11% r 2 = 0.7 n = 756 GEOS-CHEM GOME

23
GOME HCHO(T) vs ISOP(T) ISOP(T) [Guenther et al, 1995] 300.5 Ozarks
![GOME HCHO(T) vs ISOP(T) ISOP(T) [Guenther et al, 1995] Ozarks](http://images.slideplayer.com/25/7772592/slides/slide_23.jpg "GOME HCHO(T) vs ISOP(T) ISOP(T) [Guenther et al, 1995] Ozarks")
24
Overall Approach

25
EPA BEIS2 GEIA

26
ppb Summertime in situ HCHO datasets Fried et al 1997 Harris et al 1989 Kleindienst et al 1988 Lee et al 1995, 1998 Martin et al 1991 McKeen et al 1997 OZIE -Guenther Reimer et al 1998 Shepson et al 1991

27
Modeling in situ data GEIABEIS2 r 2 = 0.53 Bias -3% r 2 = 0.65 Bias -30%

28
NWNE SESW Isoprene emission [10 13 atomC cm -2 s -1 ] Model HCHO column [10 16 molec cm -2 ] Model Transfer functions
![NWNE SESW Isoprene emission [10 13 atomC cm -2 s -1 ] Model HCHO column [10 16 molec cm -2 ] Model Transfer functions](http://images.slideplayer.com/25/7772592/slides/slide_28.jpg "NWNE SESW Isoprene emission [10 13 atomC cm -2 s -1 ] Model HCHO column [10 16 molec cm -2 ] Model Transfer functions")
29
GOME isoprene emissions

30
BEIS2 fine structure

32
Consistency: GOME and in situ data r 2 = 0.77 Bias -12%

33
Summary New methodology for VOC emission from space-based HCHO columns Isoprene is dominant VOC for North American summertime GOME shows Ozarks isoprene volcano EPA BEIS2 too low? GOME consistent with in situ data Daily VOC emissions: the future?

34
Acknowledgements Daniel Jacob, Arlene Fiore, Randall Martin (Harvard University) Kelly Chance, Thomas Kurosu (Harvard-Smithsonian Observatory)
 Kelly Chance, Thomas Kurosu (Harvard-Smithsonian Observatory)")
Similar presentations


, Larry Horowitz (GFDL), Vaishali Naik (GFDL), Meiyun Lin (GFDL), Arlene Fiore (Columbia.>")


 Chris Sioris, Xiong.>")


