Download presentation
Presentation is loading. Please wait.

1
Low rate of lineage diversification High rates of lineage diversification Ancestral trait innovation Evolutionary dead ends (e.g. specialization hypothesis) Key innovation hypothesis for diversity Low rate of trait diversification no special name?Non-adaptive radiation High rate of trait diversification Adaptive divergence? Local adaptation? Adaptive radiation Niche conservatism
 Key innovation hypothesis for diversity Low rate of trait diversification no special name Non-adaptive radiation High rate of trait diversification Adaptive divergence. Local adaptation. Adaptive radiation Niche conservatism.")
3
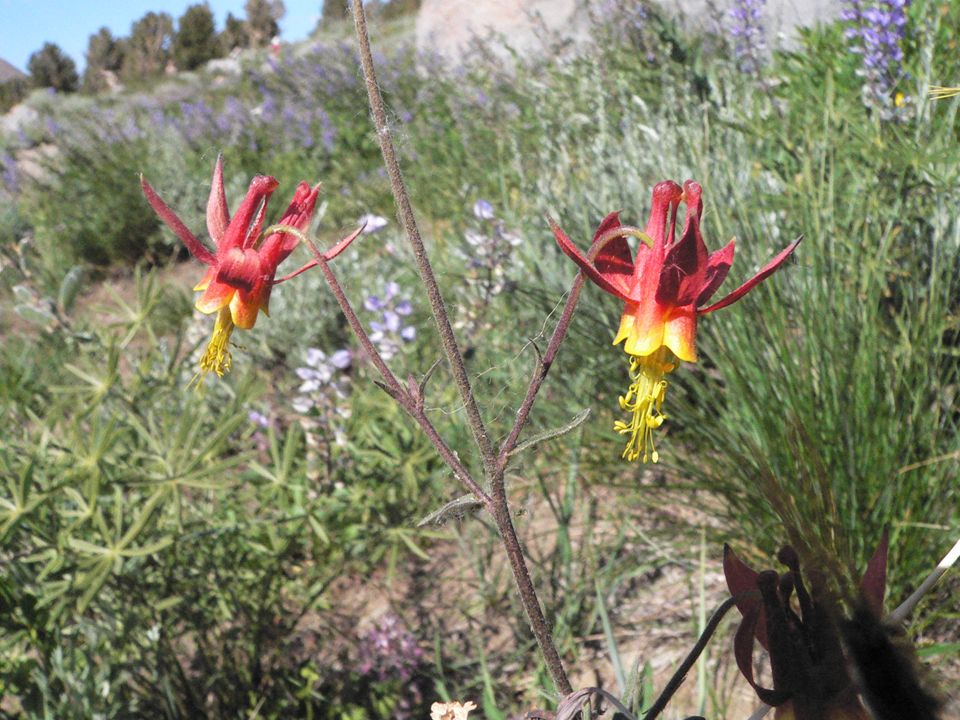
Hodges 95 Nectar spurs in Aquilegia Hodges and Arnold 1995 Proc Roy Soc.

4
Hodges 97 table Hodges and Arnold 1995 Proc Roy Soc.

5
zygomorphic laterally symmetric actinomorphic radially symmetric

6
Sargent 2004 Proc. Roy. Soc. London B. D>0: 14 D<0: 5

7
Maddison 2006 Evolution

8
Maddison et al. 2007 Evolution

9
Parameter estimation on simulated trees, N=500 taxa

10
Mayrose et al. 2011 Science

11
Anolis ecomorphs

12
Losos 98 Losos et al. 1998 Science

13
Losos 98 - 2a Losos et al. 1998 Science

14
Losos 98 - 2a Losos et al. 1998 Science

15
Losos 98 - 2a Losos et al. 1998 Science

17
Glor et al. 2003 Evolution

18
Harmon 03 Harmon et al. 2003 Science lineage diversity index = sum(obs – exp) positive value = early accumulation of lineages
 positive value = early accumulation of lineages.")
19
Measuring niche conservatism - phylogenetic signal K: Blomberg et al. (2003) Evolution; examples: Ackerly, PNAS in review Blomberg’s K: measures degree of similarity among close relatives, relative to expectations based on Brownian motion K<<1K~1K>>1 convergencebrownianconserved
 Evolution; examples: Ackerly, PNAS in review Blomberg’s K: measures degree of similarity among close relatives, relative to expectations based on Brownian motion K<<1K~1K>>1 convergencebrownianconserved.")
20
Harmon et al. 2003 Science mean subclade disparity/total disparity high values = high within group relative to among group variance = low phylo signal Morphological disparity index = sum(obs-exp): positive values= deep clades span similar trait range, i.e. convergence across clades and low signal
: positive values= deep clades span similar trait range, i.e. convergence across clades and low signal.")
21
Harmon 03-3 Harmon et al. 2003 Science early diversification -> greater phylogenetic signal

22
Harmon et al. 2010 Assign proportional weighting of alternative models that best fit data

23
Diversification of height in maples, Ceanothus and silverswords ~30 mya ~45 mya rate = 0.014 felsens0.10 felsens0.79 felsens height data: Ackerly, unpubl., Hickman (1993), Wagner (1999) phylogenies: Renner et al.(2008), Hardig et al. (2000), Baldwin & Sanderson (1998) ~5.2 mya
, Baldwin & Sanderson (1998) ~5.2 mya.")
24
Are there differences among clades in trait diversification (= disparification) rates O’Meara et al. 2006 Nested ML test: Does a 2 rate model provide a sufficiently better fit than a 1 rate model?

25
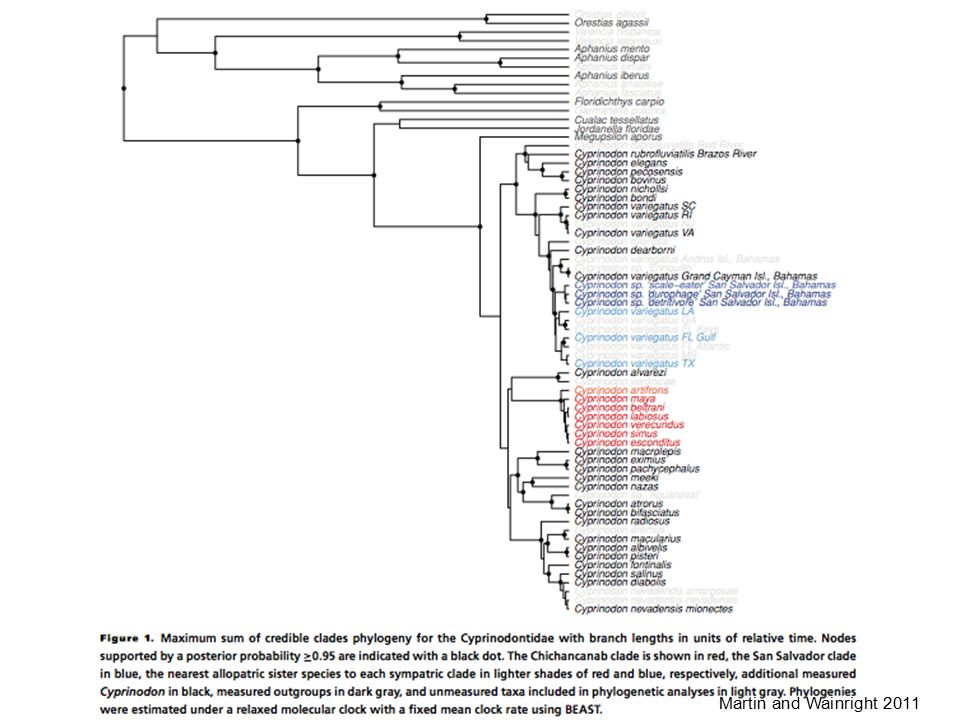
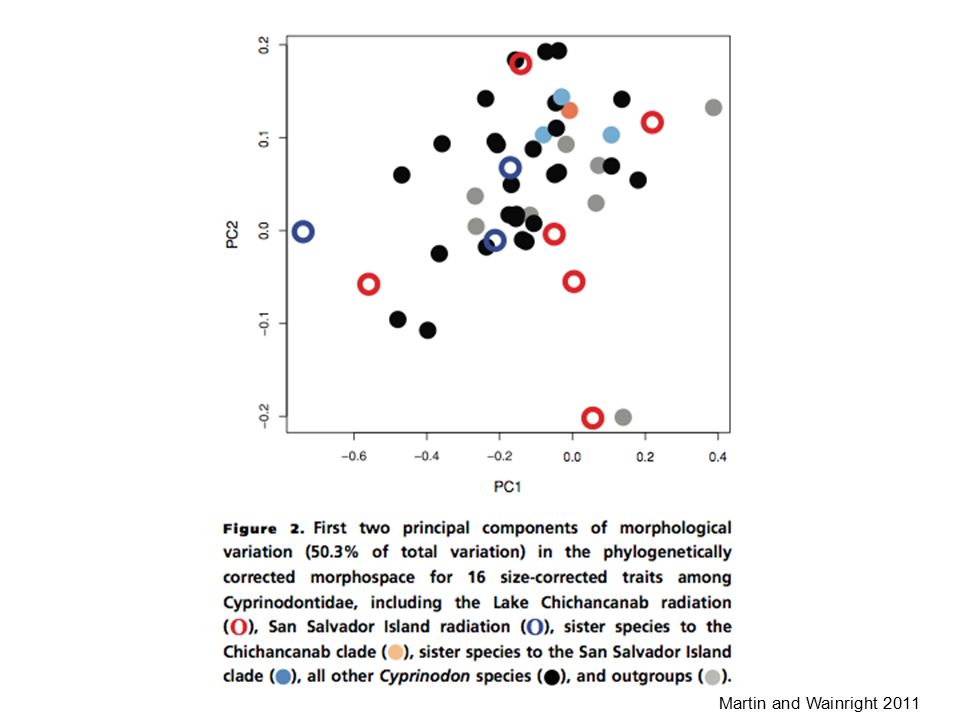
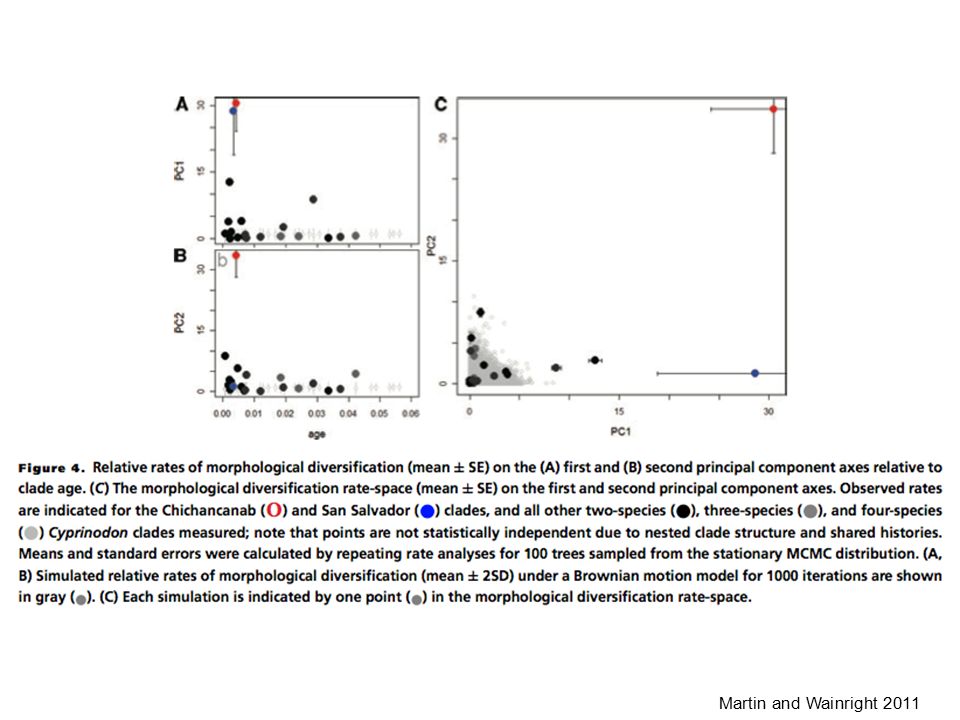
Martin and Wainright 2011

30
Quantifying rates of phenotypic evolution Haldane (1949) Evolution; Gingerich (1983) Science 1 darwin = change by factor of e million yrs
 Evolution; Gingerich (1983) Science 1 darwin = change by factor of e million yrs")
31
Rates of phenotypic diversification under Brownian motion time var(x) 1 felsen = 1 Var(log e (trait)) million yrs Ackerly, PNAS 2009
 1 felsen = 1 Var(log e (trait)) million yrs Ackerly, PNAS 2009")
32
Rates of phenotypic diversification (estimated for Brownian motion model) Rate (felsens) Leaf sizeHeight Acer Aesculus Arbutoideae Ceanothus lobelioids silverswords North temperate California Hawai’i Acer Aesculus Arbutoideae Ceanothus lobelioids silverswords ±1 s.e. Ackerly, PNAS 2009

33
C. cuneatus Ceanothus in California C. oliganthus C. cordulatus C. fresnensis ©Dean Taylor 2005 high low sclerophylly Sierra pine forest Coastal and foothill chaparral niche niche

34
E D phylogenetic overdispersion = ‘ first’ coldhot :: :: DD EE

35
E D E D D E D coldhot :: :: phylogenetic clustering = ‘ first’

36
C. cuneatus C. oliganthus C. cordulatus C. fresnensis ©Dean Taylor 2005 Sierra pine forest Coastal and foothill chaparral Cerastes Euceanothus

39
How do -niche traits diverge during allopatric speciation? E1-> 1 E2-> 2 11 22 div. coexistence 1) alternative states favored in 2 environments, coincidentally promote coexistence in modern communities.
 alternative states favored in 2 environments, coincidentally promote coexistence in modern communities..")
40
How do -niche traits diverge during allopatric speciation? 22 E1-> 1 E2-> 2 11 22 continued div. coexistence 2) differences evolved in secondary contact of sister taxa, prior to diversification of two clades; modern coexistence reflects ancestral character displacement; early habitat divergence undetectable due to rapid rates of evolution. 11 secondary contact
 differences evolved in secondary contact of sister taxa, prior to diversification of two clades; modern coexistence reflects ancestral character displacement; early habitat divergence undetectable due to rapid rates of evolution. 11 secondary contact.")
41
Losos 98-2

42
Becerra Becerra 2005 PNAS

43
Becerra LTT Lineages-through-time (LTT) plot Becerra 2005 PNAS
 plot Becerra 2005 PNAS")
44
Inga Richardson et al. 2001 Science

45
Phylica Richardson et al. 2001 Nature

Similar presentations


 selection New niches Mutation New species.>")


