Download presentation
Presentation is loading. Please wait.

1
Lecture-9 SIMS & NDT SIMS Basic Principles Instrumentation Mass Resolution Modes of Analysis Applications Non-Destructive Analysis (NDA) or Non-Destructive Testing (NDT)
 or Non-Destructive Testing (NDT)")
2
Instrumentation SIMS CAMECA 6F Ion Sources Ion sources with electron impact ionization - Duoplasmatron: Ar +, O 2 +, O - Ion sources with surface ionization - Cs + ion sources Ion sources with field emission - Ga + liquid metal ion sources Mass Analyzers Magnetic sector analyzer Quadrupole mass analyzer Time of flight analyzer Ion Detectors Faraday cup Dynode electron multiplier IpIp IsIs Ion sources Ion detectors Mass analyzers http://www.eaglabs.com/mc/sims-instrumentation.html Vacuum < 10 −6 torr http://www.youtube.com/watch?v=IO-KCjxznLs to~2:00

3
Instrumentation http://www.youtube.com/watch?v=QTjZutbLRu0 at~0:45-1:40

4
Energy Analyzer and Mass Spectrometer High transmission efficiency High mass resolution Imaging Capability R 2000 Capable: R ~ 10 5 ESA bends lower energy ions more strongly than higher energy ions. The sputtering process produces a range of ion energies. An energy slit can be set to intercept the high energy ions. Sweeping the magnetic field in MA provides the separation of ions according to mass-to-charge ratios in time sequence. Mass Analyzer (MA) Magnet Sector Electrostatic Sector E R - mass resolution r - radius of curvature of an ion http://www.youtube.com/watch?v=tOGM2gOHKPc&feature=relmfu http://www.youtube.com/watch?v=lxAfw1rftIA at~1:00-4:15 Energy Focal plane Degree (r) of deflection of ions by the magnetic filed depends on m/q ratio. V - ion acceleration voltage https://www.youtube.com/watch?v=2h28pwfi2EU
 Magnet Sector Electrostatic Sector E R - mass resolution r - radius of curvature of an ion v=tOGM2gOHKPc&feature=relmfu v=lxAfw1rftIA at~1:00-4:15 Energy Focal plane Degree (r) of deflection of ions by the magnetic filed depends on m/q ratio. V - ion acceleration voltage v=2h28pwfi2EU.")
7
Ion Detectors Faraday Cup Secondary electron Multiplier 20 dynodes Current gain 10 7 A Faraday cup measures the ion current hitting a metal cup, and is sometimes used for high current secondary ion signals. With an electron multiplier an impact of a single ion starts off an electron cascade, resulting in a pulse of 10 8 electrons which is recorded directly. Usually it is combined with a fluorescent screen, and signals are recorded either with a CCD-camera or with a fluorescence detector. http://www.youtube.com/watch?v=k4mKDFPiBj8&list=PL212AE426663B340D at~2:10-3:50 http://www.eaglabs.com/mc/sims-secondary-ion-detectors.html#next https://www.youtube.com/watch?v=f61eMq4Wg4w animation

8
Time of Flight (TOF) SIMS - Reflectron (TOF) SIMS enables the analysis of an unlimited mass range with high sensitivity and quasi-simultaneous detection of all secondary ions collected by the mass spectrometer. TOF SIMS is based on the fact that ions with the same energy but different masses travel with different velocities. Basically, ions formed by a short ionization event are accelerated by an electrostatic field to a common energy and travel over a drift path to the detector. The lighter ones arrive before the heavier ones and a mass spectrum is recorded. Measuring the flight time for each ion allows the determination of its mass. Schematic of time of flight (TOF) spectrometer - reflectron http://www.youtube.com/watch?v=ZoAUxsEBUnk TOF-SIMS http://www.youtube.com/watch?v=KAWu6SmvHjc
 spectrometer - reflectron v=ZoAUxsEBUnk TOF-SIMS v=KAWu6SmvHjc.")
10
SIMS can do trace element analysis Detection limit is affected by WDS ~100ppm EDS ~1000ppm

11
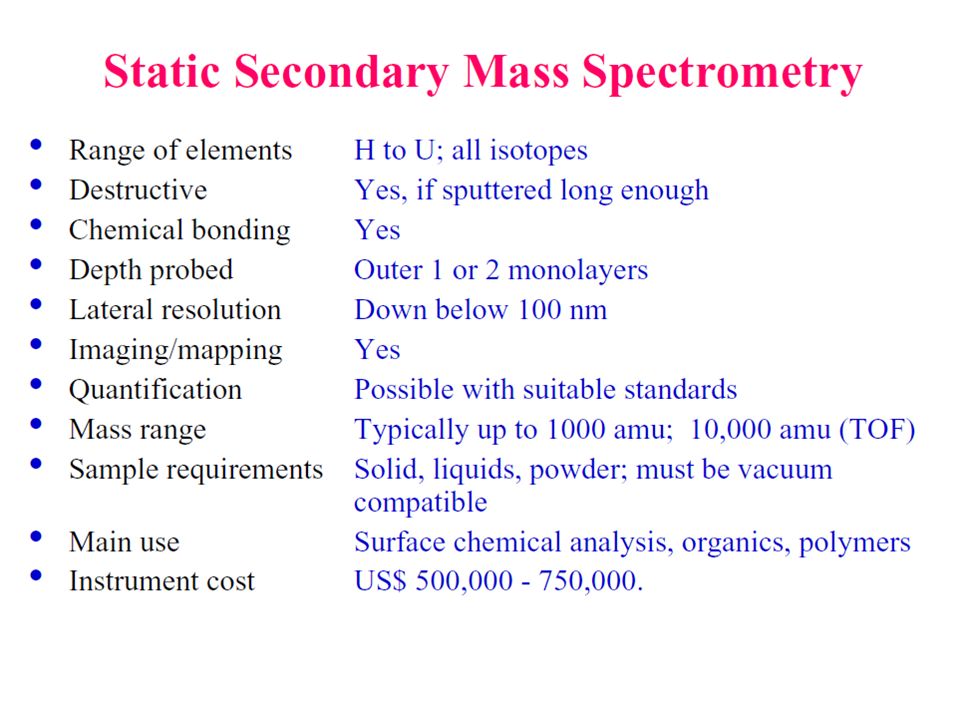
1 and 2 Static SIMS 3 Dynamic SIMS

15
Surface Analysis of Silicon Wafers

16
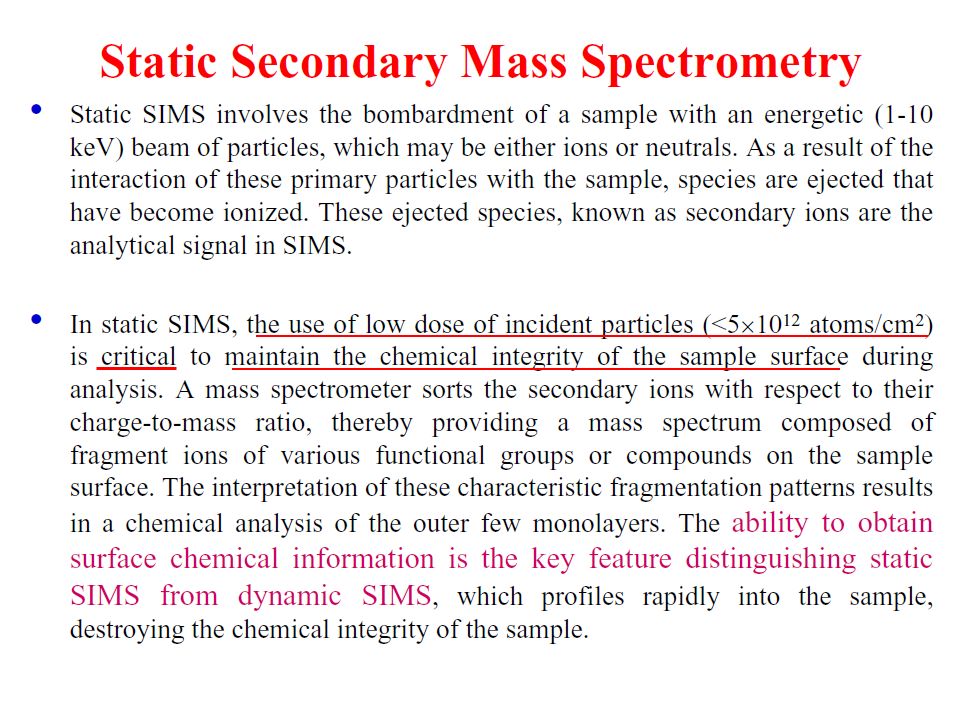
Dynamic SIMS involves the use of a much higher energy primary beam (larger amp beam current). It is used to generate sample depth profiles. The higher ion flux eats away at the surface of the sample, burying the beam steadily deeper into the sample and generating secondary ions that characterize the composition at varying depths. The beam typically consists of O 2 + or Cs + ions and has a diameter of less than 10 μm. The experiment time is typically less than a second. Ion yield changes with time as primary particles build up on the material effecting the ejection and path of secondary ions. Dynamic Secondary Ion Mass Spectrometry

17
Dynamic SIMS – Depth Profiling Factors affecting depth resolution http://www.youtube.com/watch?v=-7gSbaslRCU&feature=related

19
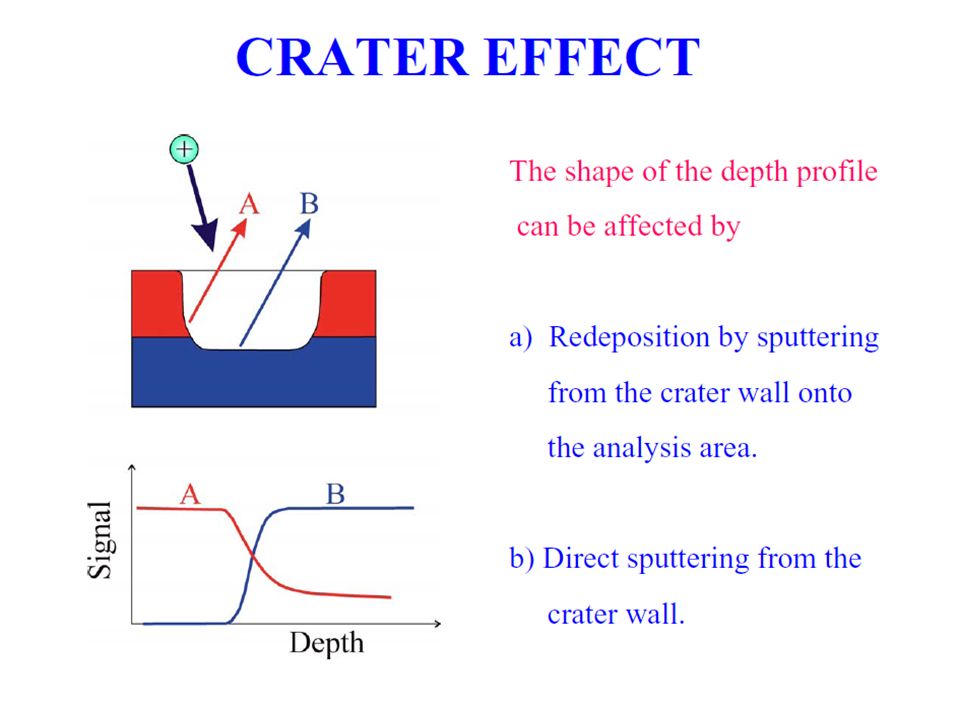
Crater Effect (a) (b) (a) Ions sputtered from a selected central area (using a physical aperture or electronic gating) of the crater are passed into the mass spectrometer. (b) The beam is usually swept over a large area of the sample and signal detected from the central portion of the sweep. This avoids crater edge effects. The analyzed area is usually required to be at least a factor of 3 3 smaller than the scanned area.
 The beam is usually swept over a large area of the sample and signal detected from the central portion of the sweep. This avoids crater edge effects. The analyzed area is usually required to be at least a factor of 3 3 smaller than the scanned area..")
20
Sample Rotation Effect

21
Gate Oxide Breakdown http://www.youtube.com/watch?v=IO-KCjxznLs&NR=1&feature=endscreen 2:08-2:40

22
Dynamic SIMS vs Static SIMS

23
http://www.youtube.com/watch?v=IO-KCjxznLsat~2:45-3:18

25
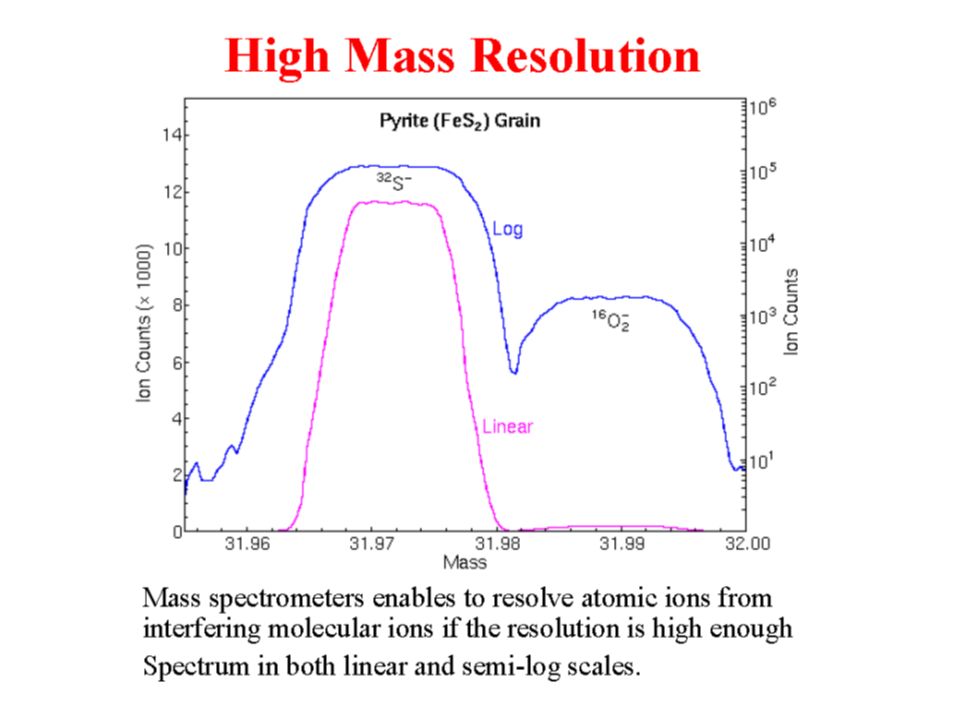
Mapping Chemical Elements The example (microbeam) images show a pyrite (FeS 2 ) grain from a sample of gold ore with gold located in the rims of the pyrite grains. The image numerical scales and associated colors represent different ranges of secondary ion intensities per pixel. Some instruments simultaneously produce high mass resolution and high lateral resolution. However, the SIMS analyst must trade high sensitivity for high lateral resolution because focusing the primary beam to smaller diameters also reduces beam intensity. High lateral resolution is required for mapping chemical elements. 34 S 197 AU

26
SIMS can be used to determine the composition of organic and inorganic solids at the outer 5 nm of a sample. To determine the composition of the sample at varying spatial and depth resolutions depending on the method used. This can generate spatial or depth profiles of elemental or molecular concentrations. These profiles can be used to generate element specific images of the sample that display the varying concentrations over the area of the sample. To detect impurities or trace elements, especially in semi- conductors and thin filaments. Secondary ion images have resolution on the order of 0.5 to 5 μm. Detection limits for trace elements range between 10 12 to 10 16 atoms/cc. Spatial resolution is determined by primary ion beam widths, which can be as small as 100 nm. Summary SIMS is the most sensitive elemental and isotopic surface microanalysis technique (bulk concentrations of impurities of around 1 part-per-billion). However, very expensive. http://www.youtube.com/watch?v=QTjZutbLRu0 at~1:38-2:14 advantages and disadvantages of SIMS
. However, very expensive. v=QTjZutbLRu0 at~1:38-2:14 advantages and disadvantages of SIMS.")
27
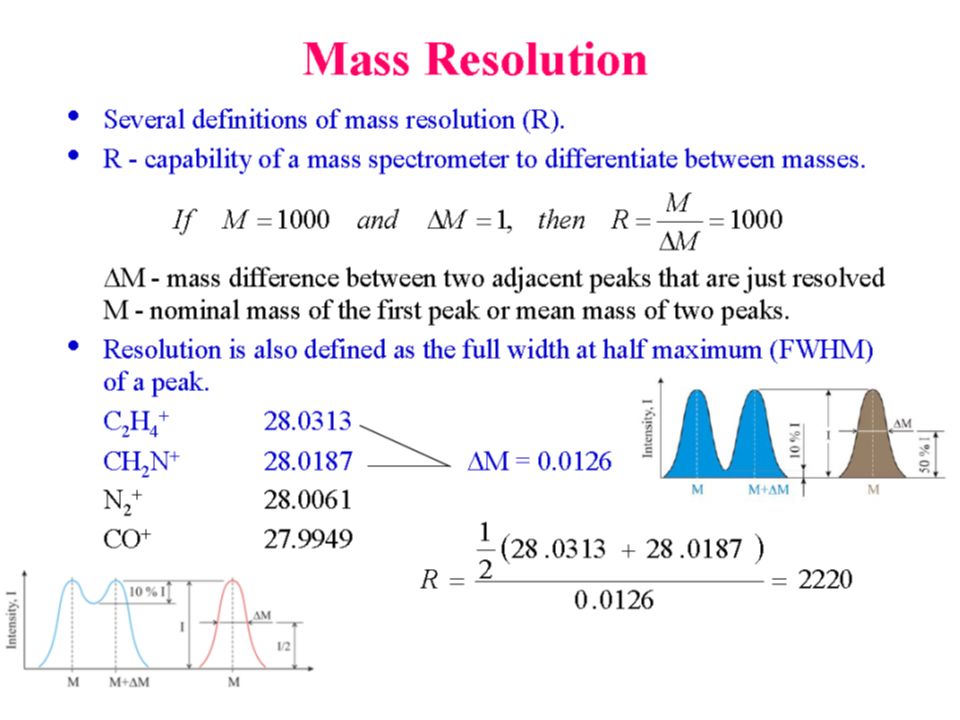
Review Questions for SIMS What are matrix effects? What is the difference between ion yield and sputtering yield? When are oxygen and cesium ions used as primary ions? What is mass resolution? How can depth resolution be improved?

28
Non-destructive Analysis (NDA) Non-destructive Testing (NDT) https://www.nde-ed.org/index_flash.php Introduction to NDT Overview of Six Most Common NDT Methods Selected Applications
 Non-destructive Testing (NDT) Introduction to NDT Overview of Six Most Common NDT Methods Selected Applications")
29
The use of noninvasive techniques to determine the integrity of a material, component or structure or quantitatively measure some characteristic of an object. i.e. Inspect or measure without doing harm. Definition of NDT

30
What are Some Uses of NDE Methods? Flaw Detection and Evaluation Leak Detection Location Determination Dimensional Measurements Structure and Microstructure Characterization Estimation of Mechanical and Physical Properties Material Sorting and Chemical Composition Determination Fluorescent penetrant indication

31
Why Nondestructive? Test piece too precious to be destroyed Test piece to be reuse after inspection Test piece is in service For quality control purpose Something you simply cannot do harm to, e.g. fetus in mother’s uterus

32
When are NDE Methods Used? –To assist in product development –To screen or sort incoming materials –To monitor, improve or control manufacturing processes –To verify proper processing such as heat treating –To verify proper assembly –To inspect for in-service damage There are NDE applications at almost any stage in the production or life cycle of a component.

33
Six Most Common NDT Methods Visual Liquid Penetrant Magnetic Ultrasonic Eddy Current Radiography Detection of surface flaws Detection of internal flaws

34
Most basic and common inspection method. Tools include fiberscopes, borescopes, magnifying glasses and mirrors. Robotic crawlers permit observation in hazardous or tight areas, such as air ducts, reactors, pipelines. Portable video inspection unit with zoom allows inspection of large tanks and vessels, railroad tank cars, sewer lines. 1. Visual Inspection

35
A liquid with high surface wetting characteristics is applied to the surface of the part and allowed time to seep into surface breaking defects. The excess liquid is removed from the surface of the part. A developer (powder) is applied to pull the trapped penetrant out the defect and spread it on the surface where it can be seen. Visual inspection is the final step in the process. The penetrant used is often loaded with a fluorescent dye and the inspection is done under UV light to increase test sensitivity. Liquid Penetrant Inspection
 is applied to pull the trapped penetrant out the defect and spread it on the surface where it can be seen. Visual inspection is the final step in the process. The penetrant used is often loaded with a fluorescent dye and the inspection is done under UV light to increase test sensitivity. Liquid Penetrant Inspection.")
36
A NDT method used for defect detection. Fast and relatively easy to apply and part surface preparation is not as critical as for some other NDT methods. – MPI one of the most widely utilized nondestructive testing methods. MPI uses magnetic fields and small magnetic particles, such as iron filings to detect flaws in components. The only requirement from an inspectability standpoint is that the component being inspected must be made of a ferromagnetic material such as iron, nickel, cobalt, or some of their alloys. Ferromagnetic materials are materials that can be magnetized to a level that will allow the inspection to be effective. The method is used to inspect a variety of product forms such as castings, forgings, and weldments. Many different industries use MPI for determining a component's fitness- for-use. Some examples of industries that use magnetic particle inspection are the structural steel, automotive, petrochemical, power generation, and aerospace industries. Underwater inspection is another area where magnetic particle inspection may be used to test such things as offshore structures and underwater pipelines. Magnetic Particle Inspection (MPI)
.")
37
Magnetic Particle Inspection The part is magnetized. Finely milled iron particles coated with a dye pigment are then applied to the specimen. These particles are attracted to magnetic flux leakage fields and will cluster to form an indication directly over the discontinuity. This indication can be visually detected under proper lighting conditions. Flux leakage The magnetic particles form a ridge many times wider than the crack itself, thus making the otherwise invisible crack visible. Cracks just below the surface can also be revealed.

38
Magnetic particles Pulverized iron oxide (Fe 3 O 4 ) or carbonyl iron powder can be used Colored or even fluorescent magnetic powder can be used to increase visibility Powder can either be used dry or suspended in liquid
 or carbonyl iron powder can be used Colored or even fluorescent magnetic powder can be used to increase visibility Powder can either be used dry or suspended in liquid")
39
Examples of visible dry magnetic particle indications Indication of a crack in a saw blade Indication of cracks in a weldment Before and after inspection pictures of cracks emanating from a hole Indication of cracks running between attachment holes in a hinge

40
Examples of Fluorescent Wet Magnetic Particle Indications Magnetic particle wet fluorescent indication of a cracks in a drive shaft Magnetic particle wet fluorescent indication of a crack in a bearing Magnetic particle wet fluorescent indication of a cracks at a fastener hole

41
One of the most dependable and sensitive methods for surface defects fast, simple and inexpensive direct, visible indication on surface unaffected by possible deposits, e.g. oil, grease or other metals chips, in the cracks can be used on painted objects results readily documented with photo or tape impression Advantages of MPI

42
Limitations of MPI Only good for ferromagnetic materials sub-surface defects will not always be indicated relative direction between the magnetic field and the defect line is important objects must be demagnetized before and after the examination the current magnetization may cause burn scars on the item examined

43
High frequency sound waves are introduced into a material and they are reflected back from surfaces or flaws. Reflected sound energy is displayed versus time, and inspector can visualize a cross section of the specimen showing the depth of features that reflect sound. f plate crack 0246810 initial pulse crack echo back surface echo Oscilloscope, or flaw detector screen Ultrasonic Inspection (Pulse-Echo) http://www.doitpoms.ac.uk/tlplib/piezoelectrics/applications.php https://en.wikipedia.org/wiki/Ultrasonic_testing
")
44
The most commonly used ultrasonic testing technique is pulse echo, whereby sound is introduced into a test object and reflections (echoes) from internal imperfections or the part's geometrical surfaces are returned to a receiver. The time interval between the transmission and reception of pulses give clues to the internal structure of the material. In ultrasonic testing, high-frequency sound waves are transmitted into a material to detect imperfections or to locate changes in material properties. Ultrasonic Inspection (Pulse-Echo)
.")
45
Ultrasonic Data Presentation Ultrasonic data can be collected and displayed in a number of different formats. The three most common formats are know in the NDT world as A-scan, B-scan and C- scan presentations. Each presentation mode provides a different way of looking at and evaluating the region of material being inspected. Modern computerized ultrasonic scanning systems can display data in all three presentation forms simultaneously.

46
C-Scan The C-scan presentation provides a plan-type view of the location and size of test specimen features. The plane of the image is parallel to the scan pattern of the ultrasonic probe. C-scan presentations are produced with an automated data acquisition system, such as a computer controlled immersion scanning system. Typically, a data collection gate is established on the A- scan and the amplitude or the time-of- flight of the signal is recorded at regular intervals as the transducer is scanned over the test piece. The relative signal amplitude or the time-of-flight is displayed as a shade of gray or a color for each of the positions where data was recorded. The C-scan presentation provides an image of the features that reflect and scatter the sound within and on the surfaces of the test piece.

47
Gray scale image produced using the sound reflected from the front surface of the coin Gray scale image produced using the sound reflected from the back surface of the coin (inspected from “heads” side) High resolution scan can produce very detailed images. Both images were produced using a pulse-echo techniques with the transducer scanned over the head side in an immersion scanning system. Images obtained by C-Scan

48
Eddy current testing can be used on all electrically conducting materials with a reasonably smooth surface. The test equipment consists of a generator (AC power supply), a test coil and recording equipment, e.g. a galvanometer or an oscilloscope Used for crack detection, material thickness measurement (corrosion detection), sorting materials, coating thickness measurement, metal detection, etc. Eddy Current Testing (ECT) Electrical currents are generated in a conductive material by an induced alternating magnetic field. The electrical currents are called eddy currents because they flow in circles at and just below the surface of the material. Interruptions in the flow of eddy currents, caused by imperfections, dimensional changes, or changes in the material's conductive and permeability properties, can be detected with the proper equipment.
, a test coil and recording equipment, e.g. a galvanometer or an oscilloscope Used for crack detection, material thickness measurement (corrosion detection), sorting materials, coating thickness measurement, metal detection, etc. Eddy Current Testing (ECT) Electrical currents are generated in a conductive material by an induced alternating magnetic field. The electrical currents are called eddy currents because they flow in circles at and just below the surface of the material. Interruptions in the flow of eddy currents, caused by imperfections, dimensional changes, or changes in the material s conductive and permeability properties, can be detected with the proper equipment..")
49
Conductive material Coil Coil's magnetic field Eddy currents Eddy current's magnetic field Eddy Current Instruments Voltmeter

50
Crack Detection Material Thickness Measurements Coating Thickness Measurements Conductivity Measurements for Material Identification Heat Damage Detection Case Depth Determination Heat Treatment Monitoring Applications of ECT Here a small surface probe is scanned over the part surface in an attempt to detect a crack.

51
Sensitive to small cracks and other defects Detects surface and near surface defects Inspection gives immediate results Equipment is very portable Method can be used for much more than flaw detection Minimum part preparation is required Test probe does not need to contact the part Inspects complex shapes and sizes of conductive materials Advantages of ECT

52
Only conductive materials can be inspected Surface must be accessible to the probe Skill and training required is more extensive than other techniques Surface finish and roughness may interfere Reference standards needed for setup Depth of penetration is limited Flaws such as delaminations that lie parallel to the probe coil winding and probe scan direction are undetectable Limitations of ECT

53
Radiography Radiography involves the use of penetrating gamma- or X-radiation to examine material's and product's defects and internal features. An X-ray machine or radioactive isotope is used as a source of radiation. Radiation is directed through a part and onto film or other media. The resulting shadowgraph shows the internal features and soundness of the part. Material thickness and density changes are indicated as lighter or darker areas on the film. High Electrical Potential Electrons - + X-ray Generator or Radioactive Source Creates Radiation Exposure Recording Device Radiation Penetrate the Sample

54
Film Radiography Top view of developed film X-ray film The part is placed between the radiation source and a piece of film. The part will stop some of the radiation. Thicker and more dense area will stop more of the radiation. = more exposure = less exposure The film darkness (density) will vary with the amount of radiation reaching the film through the test object. Defects, such as voids, cracks, inclusions, etc., can be detected.
 will vary with the amount of radiation reaching the film through the test object. Defects, such as voids, cracks, inclusions, etc., can be detected..")
55
Applications of Radiography Can be used in any situation when one wishes to view the interior of an object To check for internal faults and construction defects, e.g. faulty welding To ‘see’ through what is inside an object To perform measurements of size, e.g. thickness measurements of pipes Limitations of Radiography There is an upper limit of thickness through which the radiation can penetrate, e.g. -ray from Co-60 can penetrate up to 150mm of steel The operator must have access to both sides of an object Highly skilled operator is required because of the potential health hazard of the energetic radiations Relative expensive equipment

56
Radiographic Images

57
Burn through (icicles) results when too much heat causes excessive weld metal to penetrate the weld zone. Lumps of metal sag through the weld creating a thick globular condition on the back of the weld. On a radiograph, burn through appears as dark spots surrounded by light globular areas. Examples of radiograph

58
For More Information on NDT The Collaboration for NDT Education www.ndt-ed.org The American Society for Nondestructive Testing www.asnt.org

Similar presentations


>")

 defects in sound conducting.>")

. Engineering Why use NDT? Components are not destroyed Can test for internal flaws Useful for valuable components.>")


>")