Download presentation
Presentation is loading. Please wait.

1
A Perspective on Today’s Colorado River Issues

2
Upper Colorado Region River Basins

3
Green, Colorado and San Juan Rivers

4
Colorado River Basin Hydrology 16.5 million acre-feet (maf) allocated annually 13 to 14.5 maf of consumptive use annually 60 maf of storage 15.1 maf average annual “natural” inflow into Lake Powell over past 100 years Inflows are highly variable year-to-year
 allocated annually 13 to 14.5 maf of consumptive use annually 60 maf of storage 15.1 maf average annual natural inflow into Lake Powell over past 100 years Inflows are highly variable year-to-year")
5
Natural Flow Colorado River at Lees Ferry Gaging Station, Arizona Water Year 1906 to 2009

6
Colorado River Basin Storage (as of July 20, 2010) Current Storage Percent Full MAF Elevation (Feet) Lake Powell65%15.733,638 Lake Mead40%10.461,088 Total System Storage 58%34.42NA
 Current Storage Percent Full MAF Elevation (Feet) Lake Powell65%15.733,638 Lake Mead40%10.461,088 Total System Storage 58%34.42NA")
7
2010 Upper Colorado Projected Apr–Jul Inflow as of April 5, 2010 Flaming Gorge – 38% Blue Mesa – 78% Navajo – 89% Lake Powell – 63%

8
State of the System (1999-2010) WY Unregulated inflow into Powell % of Average Powell and Mead Storage maf Powell and Mead % Capacity 199910947.5995 20006243.3886 20015939.0178 20022531.5663 20035227.7355 20044923.1146 200510427.1654 20067125.8051 20077024.4349 200810226.5253 20098826.4053 2010*6624.7849 Inflow based on latest CBRFC forecast; storage and percent capacity based on April 2010 24-Month Study
 WY Unregulated inflow into Powell % of Average Powell and Mead Storage maf Powell and Mead % Capacity * Inflow based on latest CBRFC forecast; storage and percent capacity based on April Month Study")
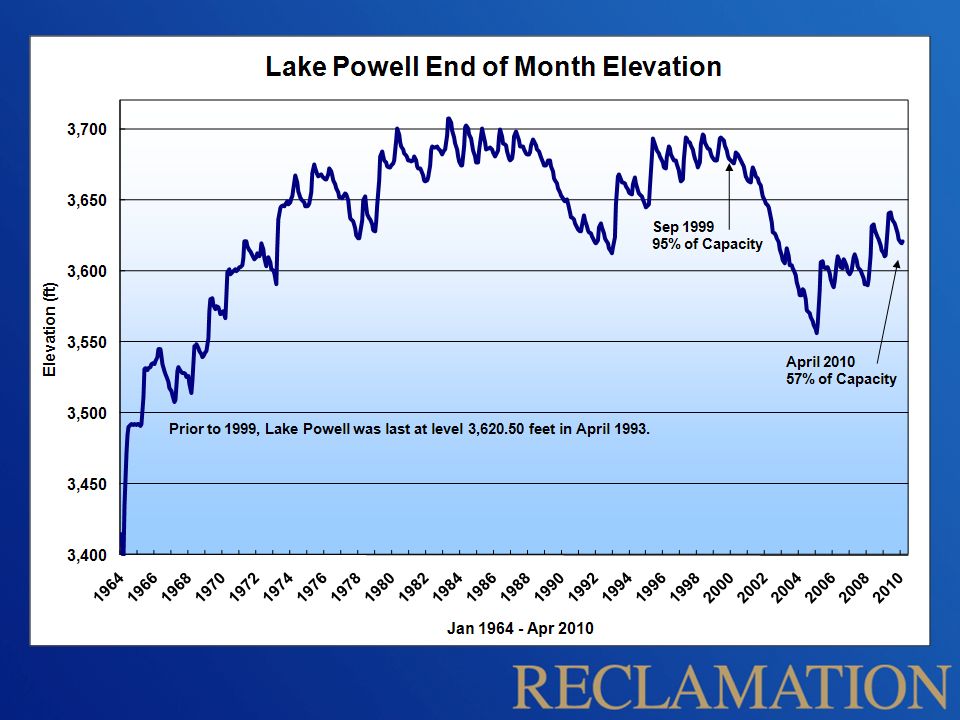
9
Min Power Pool 3,490 ft 3,642 ft 15.73 maf (65% of Live Capacity) 3,370 ft Dead Pool Lake Powell Capacity 3,700 ft 24.3 maf Dead Pool (1.9 maf) Inactive Pool (4.0 maf) Not to scale 81 ft 129 ft As of July 20, 2010 3,575 ft Lower Elevation Balancing Tier Mid-Elevation Release Tier 3,525 ft Equalization Tier Upper Elevation Balancing Tier Equalization Elevation (WY 2010) 3,619 ft
 3,370 ft Dead Pool Lake Powell Capacity 3,700 ft 24.3 maf Dead Pool (1.9 maf) Inactive Pool (4.0 maf) Not to scale 81 ft 129 ft As of July 20, ,575 ft Lower Elevation Balancing Tier Mid-Elevation Release Tier 3,525 ft Equalization Tier Upper Elevation Balancing Tier Equalization Elevation (WY 2010) 3,619 ft")
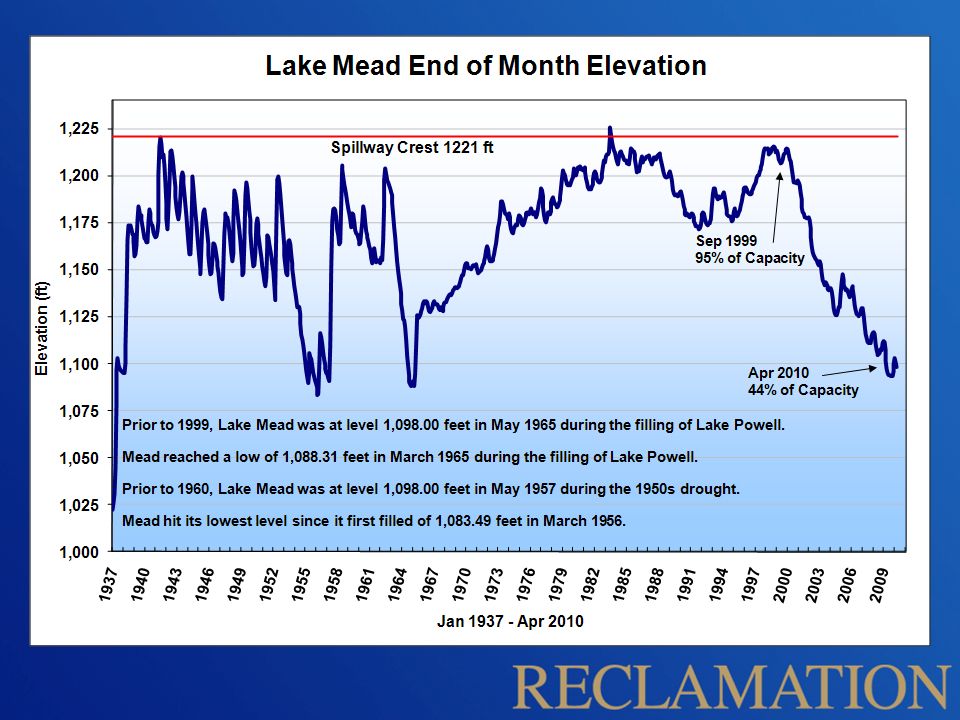
11
Lower SNWA Intake 1,000 ft 1,100 ft 11.46 maf (44% of Live Capacity) 895 ft Dead Pool Elevation Lake Mead Capacity 1,219.6 ft 25.9 maf Dead Pool (2.0 maf) Inactive Pool (7.5 maf) Not to scale 120 ft As of Apr 11, 2010 1,145 ft 25 ft 1,075 ft Shortage Conditions 1,050 ft Surplus Conditions Normal or ICS Surplus Conditions Min Power Pool 15.9 maf
 895 ft Dead Pool Elevation Lake Mead Capacity 1,219.6 ft 25.9 maf Dead Pool (2.0 maf) Inactive Pool (7.5 maf) Not to scale 120 ft As of Apr 11, ,145 ft 25 ft 1,075 ft Shortage Conditions 1,050 ft Surplus Conditions Normal or ICS Surplus Conditions Min Power Pool 15.9 maf")
13
Colorado River Water Supply & Use

14
Probability of Lower Basin Shortage

15
Animas-La Plata Project Nighthorse Reservoir Durango Pumping Plant Construction of entire project nearly 66 % complete (check this %)
")
16
Shortage Criteria & Coordinated Operating Criteria for L. Powell & L. Mead ROD signed in Dec. 2007 Multiple entities involved in EIS process Tremendous assistance from stakeholders Criteria in place till 2026

18
Glen Canyon Adaptive Management Program State-of-the-art process Diverse stakeholder groups Independent review panels Recommendations to the Secretary

19
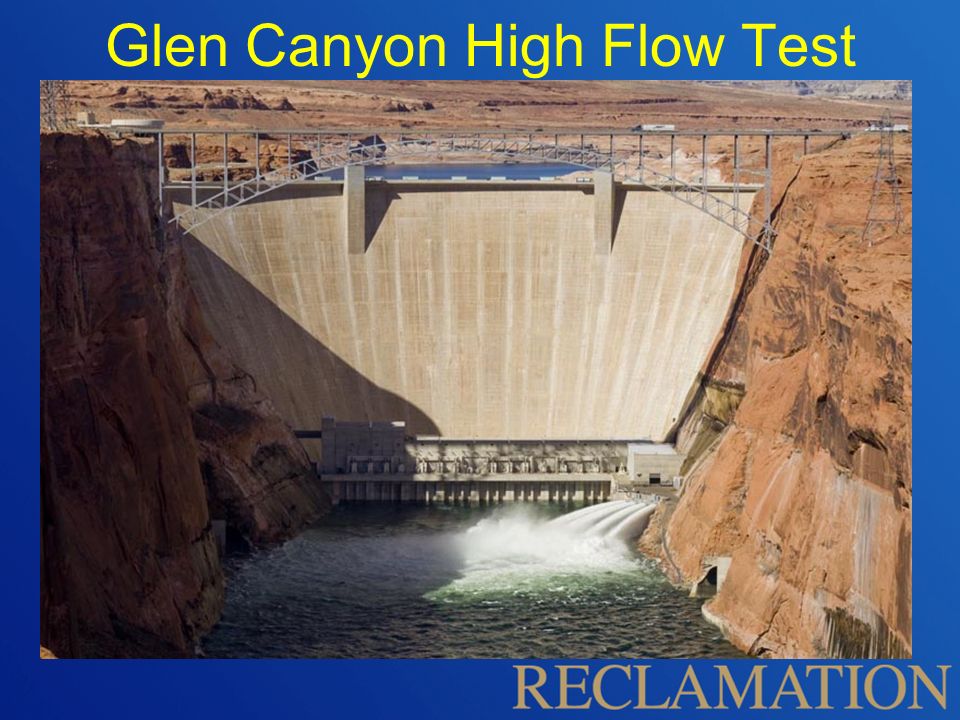
Glen Canyon Dam High Flow Test

20
Glen Canyon High Flow Test

22
We’ve begun a process to create High Flow Protocols

23
Glen Canyon High Flow Test

24
Past 10 Year’s Upper Basin Deliveries WY Lees Ferry AF 2000 9,521,494 2001 8,341,012 2002 8,339,207 2003 8,360,231 2004 8,335,339 2005 8,360,886 2006 8,492,271 2007 8,397,183 2008 9,164,053 2009 8,395,855 Average 8,570,753

25
Colorado River Basin Salinity Control Program Salinity damage totals nearly $330 million per year in U.S. Projects prevent more than 550,000 tons of salt from entering Colorado River each year

26
Colorado River Endangered Fish Species Bonytail (Gila elegans)Colorado Pikeminnow (Ptycheilus lucius) Humpback Chub (Gila cypha) Razorback Sucker (Xyrauchen texanus)
Colorado Pikeminnow (Ptycheilus lucius) Humpback Chub (Gila cypha) Razorback Sucker (Xyrauchen texanus)")
27
Endangered Fish Recovery Programs Programs in the Upper Colorado River and San Juan River Enables water development to proceed in compliance with ESA

28
Questions/Discussion

Similar presentations