Download presentation
Presentation is loading. Please wait.

1
The Colorado River: Operation, Current and Projected Future Conditions Southern California Water Dialogue Los Angeles, CA April 27, 2011

2
Overview Basin Overview Current System Conditions & Operations Projected System Conditions

3
Colorado River Basin 16.5 million acre-feet (maf) allocated annually 13 to 14.5 maf of consumptive use annually 15.0 maf average annual “natural” inflow into Lake Powell over past 100 years Inflows are highly variable year-to-year 60 maf of storage
 allocated annually 13 to 14.5 maf of consumptive use annually 15.0 maf average annual natural inflow into Lake Powell over past 100 years Inflows are highly variable year-to-year 60 maf of storage")
4
Historic Colorado River Water Supply & Use (Annual)
")
6
Water Year Snowpack and Precipitation as of April 25, 2011 Colorado River Basin above Lake Powell Water Year Precipitation (year-to-date) 122% Current Snowpack 130% Chart developed with Snotel data as of 4/25/2011 Source: CBRFC
 122% Current Snowpack 130% Chart developed with Snotel data as of 4/25/2011 Source: CBRFC")
7
Lake Powell & Lake Mead Operational Diagrams and Current Conditions 4/24/11 1,09611.14 4/24/11 3,61112.79 4/24/11

8
April 2011 Results from CRSS Probabilities of occurrence, values in percent Event or System Condition 20122013201420152016 Upper Basin Equalization release from Powell 4846504041 Balancing release from Powell 0131517 8.23 maf release from Powell 5253403527 7.48 maf release from Powell 0071014 7.00 maf release from Powell 00001 Lower Basin Shortage – any amount (Mead ≤ 1,075) 0021620 Shortage – 1 st level (Mead ≤ 1,075 and ≥ 1,050)0021314 Shortage – 2 nd level (Mead < 1,050 and ≥ 1,025)00036 Shortage – 3 rd level (Mead < 1,025 )00000 Surplus – any amount (Mead ≥ 1,145) 09212832 Surplus – Flood Control00347 Normal or ICS Surplus 10091775648
 Shortage – 1 st level (Mead ≤ 1,075 and ≥ 1,050) Shortage – 2 nd level (Mead < 1,050 and ≥ 1,025)00036 Shortage – 3 rd level (Mead < 1,025 )00000 Surplus – any amount (Mead ≥ 1,145) Surplus – Flood Control00347 Normal or ICS Surplus")
9
Colorado River Basin Water Supply and Demand Study Two-year, $2 million study cost shared by Reclamation and the Basin States Assess future water supply and demand imbalance over the next 50 years Assess risks to all Basin resources Investigate options and strategies to mitigate impacts Study will identify and evaluate options, not at feasibility level A transparent, collaborative study with input from all stakeholders Email: ColoradoRiverBasinStudy@usbr.gov Website: http://www.usbr.gov/lc/region/programs/ crbstudy.html

10
Addressing an Uncertain Future The path of major influences on the Colorado River system is uncertain and can not be represented by a single view An infinite number of plausible futures exist A manageable and informative number of scenarios are being developed to explore the broad range of futures Scenario Funnel

11
Water Supply Scenarios * Observed Resampled: future hydrologic trends and variability will be similar to the past 100 years Paleo Resampled: future hydrologic trends and variability are represented by the distant past (approximately 1250 years) Paleo Conditioned: future hydrologic trends and variability are represented by a blend of the wet dry states of the paleo-climate record but magnitudes are more similar to the observed period Downscaled GCM Projected: future climate will continue to warm with regional precipitation trends represented through an ensemble of future GCM projections Water Demand Scenarios * Current Trends: growth, development patterns, and institutions continue along recent trends Economic Slowdown: low growth with emphasis on economic efficiency Expansive Growth: economic resurgence (population and energy) and current preferences toward human and environmental values * Enhanced Environment and Healthy Economy: expanded environmental awareness and stewardship with growing economy* * Additional “branches” possible depending upon assumed trajectory of specific socio-economic factors. * Preliminary – Subject to change

12
The Colorado River: Operations and Current Conditions For further information: http://www.usbr.gov/lc/region

13
Driving Forces of Uncertainty No.Driving Forces 1Changes in streamflow variability and trends 2Changes in climate variability and trends (e.g. temperature, precipitation, etc.) 3Changes in watershed conditions (e.g. diseases, species transitions, etc.) 4Changes in population and distribution 5Changes in agricultural land use (e.g. irrigated agricultural areas, crop mixes, etc.) 6Changes in urban land use (e.g. conversion, density, urbanization, etc.) 7Changes in public land use (e.g. forest practices, grazing, wilderness areas, etc.) 8Changes in agricultural water use efficiency 9Changes in municipal and industrial water use efficiency 10Changes in institutional and regulatory conditions (e.g. laws, regulations, etc.) 11Changes to organization or management structures (e.g. state, federal, bi-national institutions) 12Changes in water needs for energy generation (e.g. solar, oil shale, thermal, nuclear, etc.) 13Changes in flow-dependent ecosystem needs for ESA-listed species 14Changes in other flow-dependent ecosystem needs 15Changes in social values affecting water use 16Changes in cost of energy affecting water availability and use 17Changes in water availability due to tribal water use and settlement of tribal water rights claims 18Changes in water quality including physical, biological, and chemical processes
 3Changes in watershed conditions (e.g. diseases, species transitions, etc.) 4Changes in population and distribution 5Changes in agricultural land use (e.g. irrigated agricultural areas, crop mixes, etc.) 6Changes in urban land use (e.g. conversion, density, urbanization, etc.) 7Changes in public land use (e.g. forest practices, grazing, wilderness areas, etc.) 8Changes in agricultural water use efficiency 9Changes in municipal and industrial water use efficiency 10Changes in institutional and regulatory conditions (e.g. laws, regulations, etc.) 11Changes to organization or management structures (e.g. state, federal, bi-national institutions) 12Changes in water needs for energy generation (e.g. solar, oil shale, thermal, nuclear, etc.) 13Changes in flow-dependent ecosystem needs for ESA-listed species 14Changes in other flow-dependent ecosystem needs 15Changes in social values affecting water use 16Changes in cost of energy affecting water availability and use 17Changes in water availability due to tribal water use and settlement of tribal water rights claims 18Changes in water quality including physical, biological, and chemical processes.")
14
Driving Forces Groupings

15
Natural Flow Colorado River at Lees Ferry Gaging Station, Arizona Water Year 1906 to 2011

16
Seven years of unprecedented drought Increased water use To date, there has never been a shortage in the Lower Basin and there were no shortage guidelines Operations between Lake Powell and Lake Mead were coordinated only at the higher reservoir levels “equalization” Impetus for the Interim Guidelines

17
Interim Guidelines 1 - A Robust Solution Operations specified through the full range of operation for Lake Powell and Lake Mead Encourage efficient and flexible use and management of Colorado River water through the ICS mechanism Strategy for shortages in the Lower Basin, including a provision for additional shortages if warranted 2 In place for an interim period (through 2026) to gain valuable operational experience Basin States agree to consult before resorting to litigation 1.Issued in Record of Decision, dated December 13, 2007; available at http://www.usbr.gov/lc/region/programs/strategies.html http://www.usbr.gov/lc/region/programs/strategies.html 2.Mexico water deliveries are not directly affected by these guidelines
 to gain valuable operational experience Basin States agree to consult before resorting to litigation 1.Issued in Record of Decision, dated December 13, 2007; available at Mexico water deliveries are not directly affected by these guidelines")
18
2011 Upper Colorado Forecasted Apr–Jul Inflow as of April 15 Flaming Gorge – 126% Blue Mesa – 111% Navajo – 70% Lake Powell – 122%

19
Lower SNWA Intake 1,000 ft 1,096 ft 11.14 maf (43% of Live Capacity) 895 ft Dead Pool Elevation Lake Mead Capacity 1,219.6 ft 25.9 maf Dead Pool (2.0 maf) Inactive Pool (7.5 maf) Not to scale 124 ft As of Apr 24, 2011 1,145 ft 46 ft 1,075 ft Shortage Conditions 1,050 ft Surplus Conditions Normal or ICS Surplus Conditions Min Power Pool 15.9 maf
 895 ft Dead Pool Elevation Lake Mead Capacity 1,219.6 ft 25.9 maf Dead Pool (2.0 maf) Inactive Pool (7.5 maf) Not to scale 124 ft As of Apr 24, ,145 ft 46 ft 1,075 ft Shortage Conditions 1,050 ft Surplus Conditions Normal or ICS Surplus Conditions Min Power Pool 15.9 maf")
22
Historic Colorado River Water Supply & Use ( 10-year Running Average)
")
23
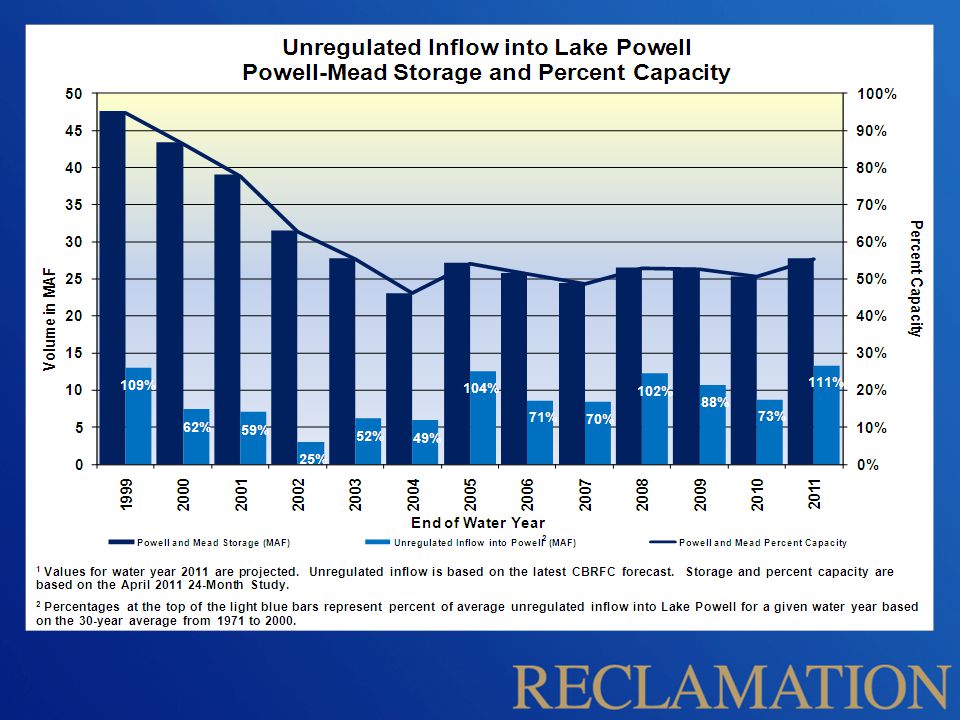
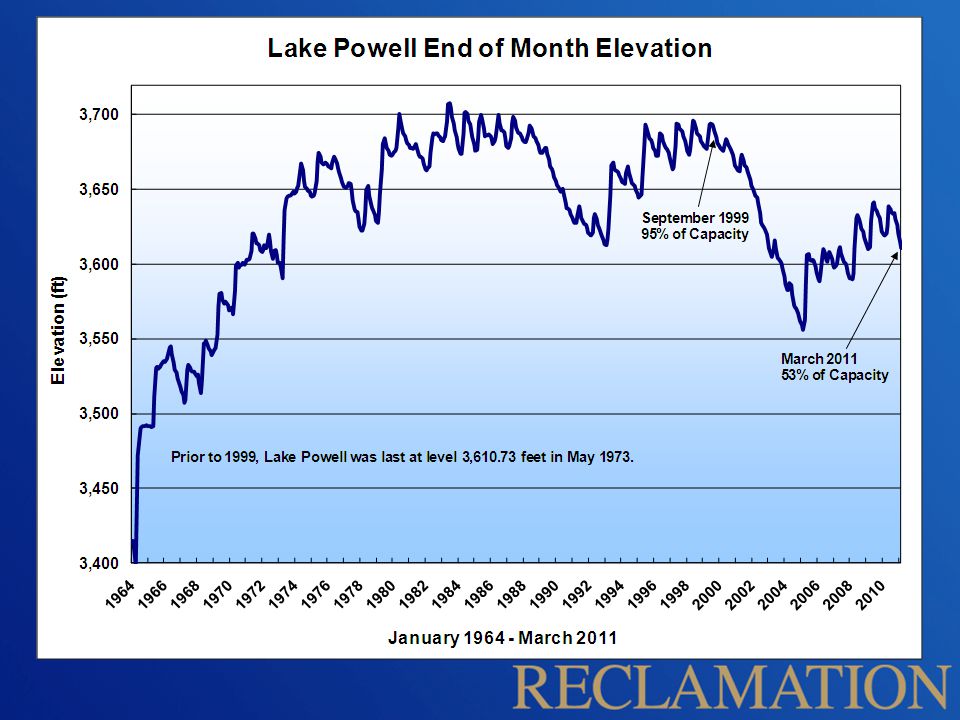
Colorado River Basin Storage (as of April 24, 2011) Current Storage Percent Full MAF Elevation (Feet) Lake Powell53%12.793,611 Lake Mead43%11.141,096 Total System Storage* 53%31.46NA *Total system storage was 32.75 maf or 55% this time last year
 Current Storage Percent Full MAF Elevation (Feet) Lake Powell53%12.793,611 Lake Mead43%11.141,096 Total System Storage* 53%31.46NA *Total system storage was maf or 55% this time last year")
24
Lower Basin Shortage through 2026

Similar presentations


 Water Resources (from IPCC WG-2, Chapter 3) Water Resources Primary Source: IPCC WG-2 Chapter 3 – Freshwater.>")


 Conditions on the Colorado River Urban Water Institute’s 21 st Annual Conference August 14, 2014.>")
 Taylor Dixon, Hydrologist February 12, 2014.>")