Download presentation
Presentation is loading. Please wait.

1
Automated CBC Parameters
and Quality Control

2
The Automated Complete Blood Count
Most common test in the Hematology lab. Main Components of the CBC: Cell counts Hgb RBC indices WBC differential absolute values and percent The CBC is a very common test. Many patients will have baseline CBC tests to help determine their general health status. If they are healthy and they have cell populations that are within normal limits, then they may not require another CBC until their health status changes or until their doctor feels that it is necessary. If a patient is having symptoms such as fatigue or weakness or has an infection, inflammation, bruising, or bleeding, then the doctor may order a CBC to help diagnose the cause.

3
CBC Adult Reference Ranges
Parameter Adult Reference Range WBC X 103/µL RBC Male: X 106 /µL Female: X 106 /µL HGB Male: g/dL Female: g/dL HCT Male: % Female: % MCV fl MCH 28-34 pg MCHC 32-36 g/dL or % RDW % PLT X 103 /µL MPV fl This chart can also be found in on the first page of the textbook.

4
Linearity (Reportable Range)
Instruments are calibrated for each analyte with a range that is clinically relevant. With concentrations above or below the reportable range or Linearity range, the result does not correspond with the calibration curve in linear fashion. Results outside of linearity are NOT acceptable. Linearity ranges vary by instrument. Example: The instrument will be accurate as long as the results fall within a certain range known as the linearity range also known as the reportable range. When patient results are higher or lower than the reportable range, the results do not match up the standard curve or calibration curve in a straight line; therefore, they cannot be standardized. The results cannot be reported. Some instruments FLAG these results, others give values of greater than the highest reportable value. Many times the specimen will need to be diluted, rerun and the result multiplied by the dilution factor to get a result within linearity. Parameter Coulter STKS Advia WBC X 103 /µL X 103 /µL

5
CBC Quality Control Commercial Controls: 3 levels (low, normal, high)
Values stored in instrument computer Levey-Jennings graph generated and stored for each parameter Mode to Mode QC: Most automated hematology instruments have a primary and secondary mode of sample aspiration. Controls must be run on BOTH and correlate. Primary=Automated Secondary=Manual When the Laboratory Information System (LIS) and the instrument are interfaced (connected) checks are conducted by the LIS on select parameters. Current values compared to most previous result Differences greater than the limits set within the LIS are flagged
 and the instrument are interfaced (connected) checks are conducted by the LIS on select parameters. Current values compared to most previous result. Differences greater than the limits set within the LIS are flagged.")
6
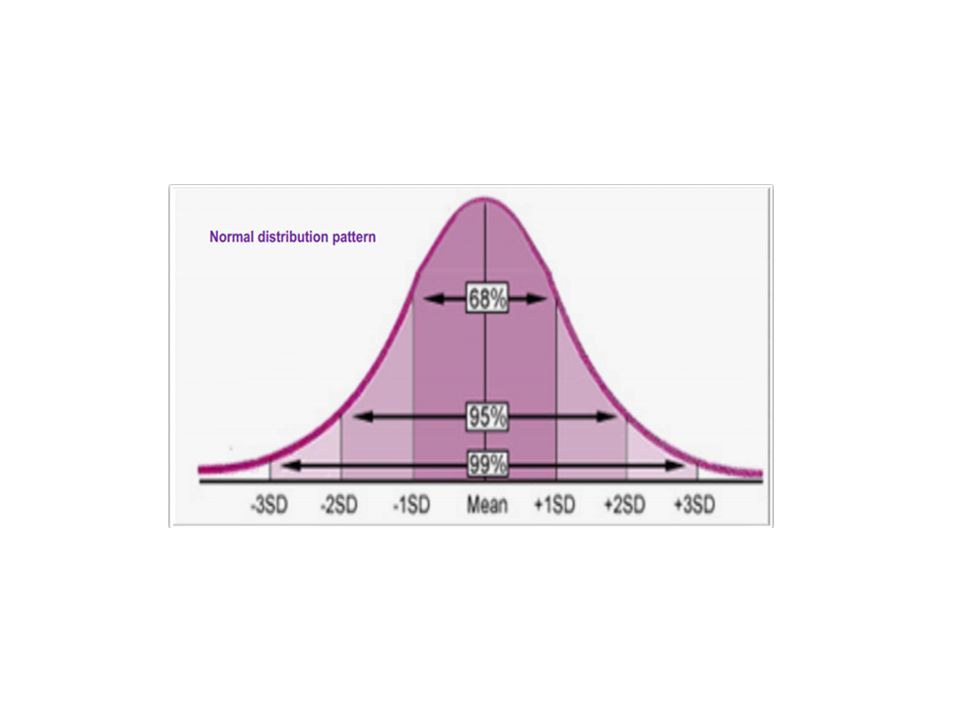
Statistics involved Mean Standard Deviation S.D 2 S.D 3 S.D C.V

7
Levey – Jennings Chart

9
WestGard Interpretations

10
IQS in Hematology analyzer
Commercial controls Retained Samples

11
Establishing Lab. Acceptable ranges for Controls
New lot of control should be analyzed in parallel with current lot. Mean and S.D should be determined based on at least 20 measurements over 20 days. If less Q.C material available The mean of more than 10 runs is used. A control file is set up for the new mean

12
Establishing Lab Acceptable range for controls ( S.D)
Determined by evaluating months of data from the previous Q.C The individual S.D value is calculated The resultant S.D and Mean are used to monitor instrument performance

13
Retained sample testing
A previous days ( retained) sample, stored at 2 – 8 C, with normal counts is run as 1st sample after the controls are analyzed. This is done on a daily basis. This sample is considered as the precision sample. This sample is then analyzed every one hour or / after 30 patient samples and also as the last sample before the analyzer is shutdown. The mean, S.D and C.V is calculated
 sample, stored at 2 – 8 C, with normal counts is run as 1st sample after the controls are analyzed. This is done on a daily basis. This sample is considered as the precision sample. This sample is then analyzed every one hour or / after 30 patient samples and also as the last sample before the analyzer is shutdown. The mean, S.D and C.V is calculated.")
14
Daily IQC of hematology analyzer

15
Other actions

16
How many L-J’s ? There should be a separate chart for :
Normal and abnormal controls for each parameter being tested

17
Multi rule vs single rule QC in hematology analyzers
A single rule QC procedure gives you all the error detection needed while at the same time maintaining low false rejections. This generally means eliminating the 12s rule because of its high false rejections and considering others such as 12.5s, 13s, and 13.5s Multi rule QC ( Westgard ) : Extra cost , more applicable in Chemistry lab.
 : Extra cost , more applicable in Chemistry lab.")
18
When a rule is violated ? Stop testing
Warning rule: Inspect control points Rejection rule ( Out of control) Stop testing Identify and correct problem Repeat testing on patient samples and controls Don’t report patient results until problem is solved and controls indicate proper performance
 Stop testing. Identify and correct problem. Repeat testing on patient samples and controls. Don’t report patient results until problem is solved and controls indicate proper performance.")
19
Labs can establish their cut off values Coefficient of variation

20
Trend of Hgb Control Results
A trend occurs when five or more values show a gradual increase or decrease.

21
13s refers to a control rule that is commonly used with a L-J chart when the control limits are set as the mean 3s . A run is rejected when a single control measurement exceeds the mean plus 3s or the mean minus 3s control limit

22
10x - reject when 10 consecutive control measurements fall on one side of the mean.

23
Systematic errors

24
Activity Which readings exceed the ( Mean 2 S
Activity Which readings exceed the ( Mean 2 S.D) and the ( Mean 3 S.D)
 and the ( Mean 3 S.D)")
Similar presentations


 for Medical Laboratories: An introduction Dr. Otto Panagiotakis and Dr. Alexander Haliassos ESEAP – Greek Proficiency Testing.>")


