Download presentation
Presentation is loading. Please wait.

1
Job Vacancy Durations Climb to Another New Peak Average Duration Exceeds Six Weeks for Openings in Manufacturing Dr. Steven J. Davis University of Chicago Booth School of Business July 8, 2014 http://dicehiringindicators.com/

2
Statistical Products Derived from JOLTS Data Charts and tables produced using data from the Job Openings and Labor Turnover Survey following the analytical framework and measurement methods in Davis, Faberman and Haltiwanger (2012, 2013). Steven J. Davis faculty.chicagobooth.edu/steven.davis/ July 8, 2014

4
Decennial Census Hiring

7
Three-Month Moving Averages

11
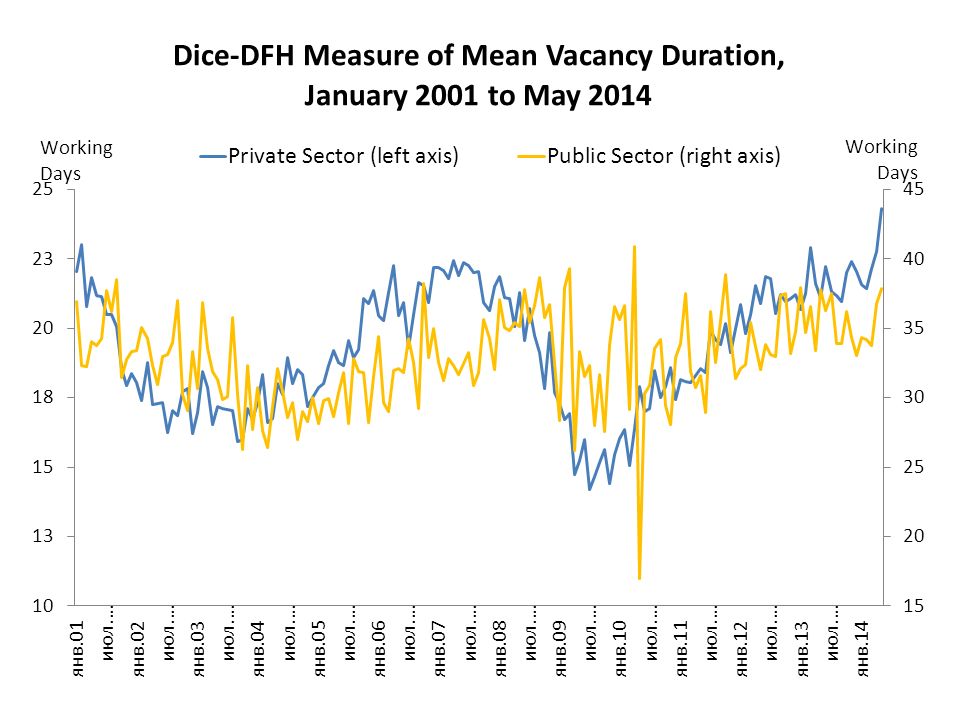
Mean Vacancy Duration (Number of Working Days) By Industry and Time Period 2001 to 2003 2004 to 2005 200620082009 2010 to 2012 2013 Jan. 2014- May 2014 Resources 12.012.117.817.913.718.9 20.0 Construction 7.87.910.17.34.56.29.810.8 Manufacturing 17.419.424.221.513.623.528.329.1 Wholesale and Retail Trade 14.215.416.515.313.215.919.919.1 Warehouse, Trans. & Utilities 18.515.421.120.810.518.122.421.6 Information 25.931.745.234.524.841.136.438.7 Financial Services 28.031.034.727.625.733.835.636.3 Professional and Business Services 18.220.019.921.416.418.819.520.3 Education 21.224.126.422.518.320.823.423.7 Health Services 39.134.638.336.329.833.634.935.3 Leisure and Hospitality 13.814.216.214.910.613.416.719.7 Other Services 22.317.520.223.817.118.620.1 Government 32.929.732.635.932.233.135.535.4 Non-Farm 19.2 21.721.016.720.022.523.3

12
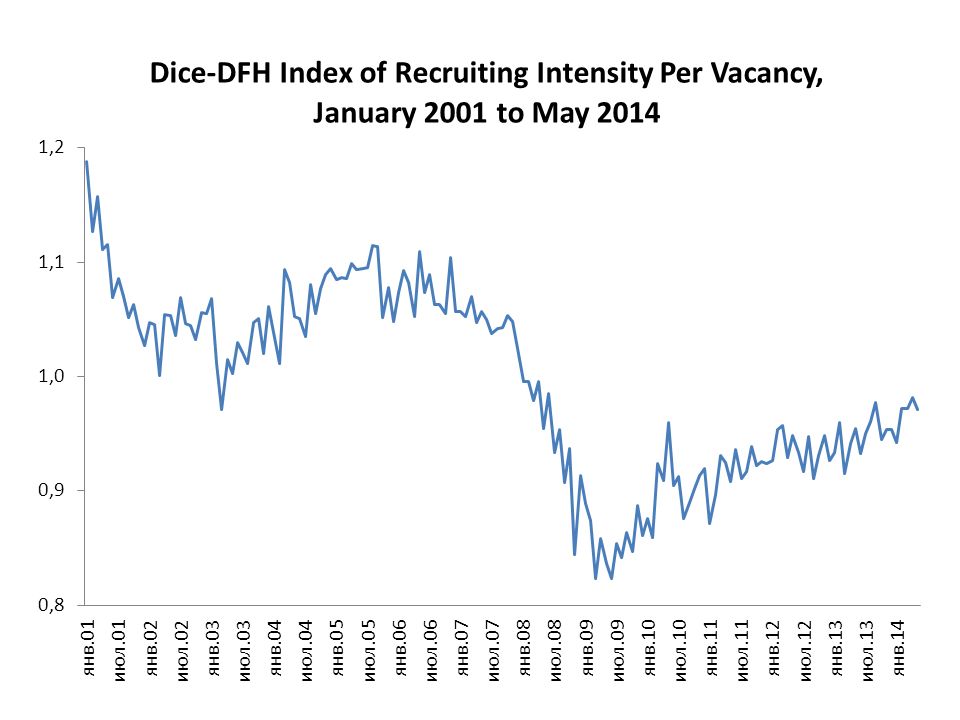
Recruiting Intensity Index By Industry and Time Period 2001 to 2003 2004 to 2005 200620082009 2010 to 2012 2013 Jan. 2014- May 2014 Resources 0.991.081.031.050.701.010.981.08 Construction 1.07 0.970.89 1.010.930.85 Manufacturing 1.021.081.090.940.850.930.880.87 Wholesale and Retail Trade 1.051.10 0.960.840.890.941.01 Warehouse, Trans. & Utilities 0.961.131.110.93 0.961.011.10 Information 1.101.051.130.870.820.921.041.06 Financial Services 1.051.071.130.990.840.860.980.90 Professional and Business Services 1.08 1.050.900.820.940.961.00 Education 1.000.971.031.050.970.980.940.99 Health Services 1.081.031.041.010.930.890.930.94 Leisure and Hospitality 1.08 1.090.970.840.880.920.93 Other Services 1.011.101.010.950.960.950.970.94 Government 1.061.021.090.920.860.930.940.96 Non-Farm 1.051.08 0.950.860.920.950.97

13
Focus on Professional & Business Services Mean Vacancy Duration (Number of Working days) By Industry and Time Period 2001 to 2003 2004 to 2005 200620082009 2010 to 2012 2013 Jan. 2014- May 2014 Professional and Business Services 18.220.019.921.416.418.819.520.3 Private 18.318.621.020.015.519.021.622.5 Non-Farm 19.2 21.721.016.720.022.523.3 Recruiting Intensity Index By Industry and Time Period 2001 to 2003 2004 to 2005 200620082009 2010 to 2012 2013 Jan. 2014- May 2014 Professional and Business Services 1.08 1.050.900.820.940.961.00 Private 1.051.081.070.950.860.920.950.96 Non-Farm 1.051.08 0.950.860.920.950.97

14
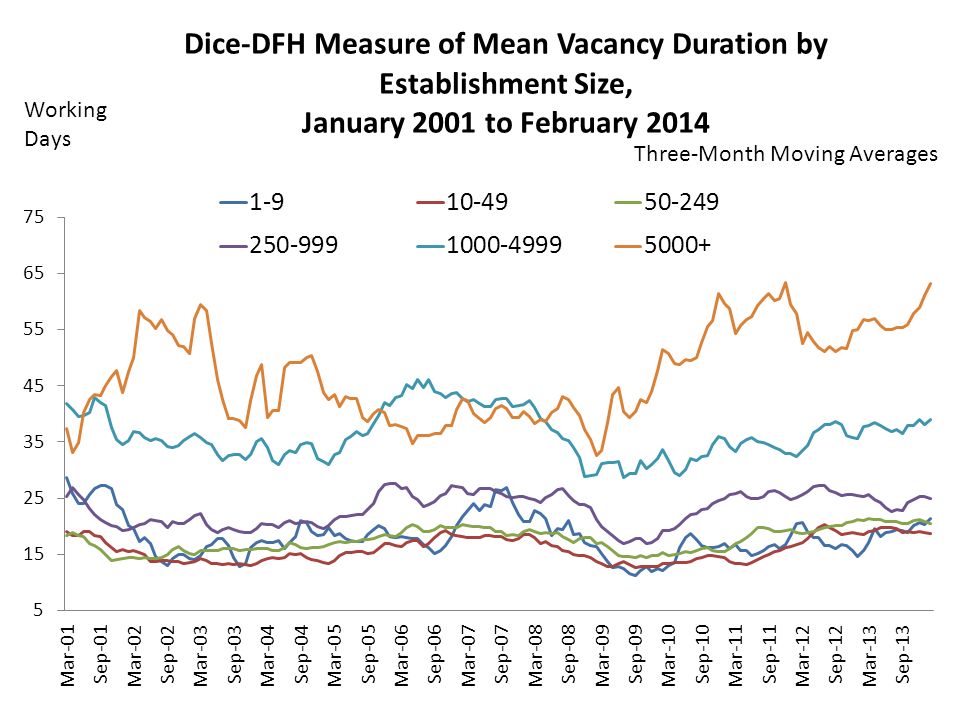
Mean Vacancy Duration by Establishment Size Selected Time Periods Class Size 2001 to 2003 2004 to 2005 200620082009 2010 to 2012 2013 Jan. 2014- Feb. 2014 1-919.2518.2917.3019.8312.7616.5518.8921.50 10-4915.1714.8717.5316.1913.0215.7419.1518.43 50-24915.7216.8719.4418.3315.2617.9320.9620.44 250-99920.9721.8725.7424.9117.9924.5424.2425.26 1000-499936.2135.0344.2435.6230.7334.3237.7239.13 5000+47.4143.6737.0639.5640.6155.0956.4465.76 Recruiting Intensity Index By Establishment Size and Time Period Class Size 2001 to 2003 2004 to 2005 200620082009 2010 to 2012 2013 Jan. 2014- Feb. 2014 1-90.991.101.060.980.95 0.940.91 10-491.051.101.070.950.890.910.940.93 50-2491.091.071.090.930.810.900.920.95 250-9991.061.07 0.910.830.941.000.97 1000-49991.06 0.991.040.840.940.960.94 5000+0.971.111.381.130.760.780.830.79

15
References Davis, Steven J., R. Jason Faberman and John Haltiwanger (2012), “Recruiting Intensity during and after the Great Recession: National and Industry Evidence,” American Economic Review, Papers & Proceedings, 102, no. 3 (May), 584-588. Davis, Steven J., R. Jason Faberman and John Haltiwanger (2013), “The Establishment-Level Behavior of Vacancies and Hiring,” Quarterly Journal of Economics, 128, no. 2 (May), 581-622. 15
, Recruiting Intensity during and after the Great Recession: National and Industry Evidence, American Economic Review, Papers & Proceedings, 102, no. 3 (May), Davis, Steven J., R. Jason Faberman and John Haltiwanger (2013), The Establishment-Level Behavior of Vacancies and Hiring, Quarterly Journal of Economics, 128, no. 2 (May),")
Similar presentations


>")


