Download presentation
Presentation is loading. Please wait.

1
Smoothing mortality rates using R Gary Brown & Julie Mills

2
Overview Introduction Context Methodology Implementation Results Summary What’s next?

3
Introduction Future mortality rates are published every two years –Until 2004, by the Government Actuary’s Department (GAD) –Since 2006, by ONS (with GAD consultants) The methodology was designed by GAD in the 1990s and runs in Excel In 2010, ONS reviewed the current process –Implementation and testing still ongoing
 –Since 2006, by ONS (with GAD consultants) The methodology was designed by GAD in the 1990s and runs in Excel In 2010, ONS reviewed the current process –Implementation and testing still ongoing")
4
Context Mortality rates, estimated 75 years into the future, are a key factor in National Population Projections (others: births and net migration) –Natural change (births – deaths) accounts for 1/3 of total population change Population projections used as inputs/control totals for other government projections, such as numbers of school children or pensioners Robustness of mortality rates is crucial
 –Natural change (births – deaths) accounts for 1/3 of total population change Population projections used as inputs/control totals for other government projections, such as numbers of school children or pensioners Robustness of mortality rates is crucial")
5
Methodology - current Mortality rate = deaths/pop

6
Methodology - current Mortality rate = deaths/pop constrained survivor ratio

7
Methodology - current Mortality rate = deaths/pop Smooth within years (to 103/104) constrained survivor ratio
 constrained survivor ratio")
8
Methodology - current Mortality rate = deaths/pop Smooth within years (to 103/104) constrained survivor ratio extrapolate to age 120
 constrained survivor ratio extrapolate to age 120")
9
Methodology - current Mortality rate = deaths/pop Smooth within years (to 103/104) Estimate year T+1 for each age constrained survivor ratio extrapolate to age 120
 Estimate year T+1 for each age constrained survivor ratio extrapolate to age 120")
10
Methodology - current Mortality rate = deaths/pop Smooth within years (to 103/104) Estimate year T+1 for each age constrained survivor ratio extrapolate to age 120 exponential smoothingx2
 Estimate year T+1 for each age constrained survivor ratio extrapolate to age 120 exponential smoothingx2")
11
Methodology - current Mortality rate = deaths/pop Smooth within years (to 103/104) Estimate year T+1 for each age Smooth improvement rate in T+1 constrained survivor ratio extrapolate to age 120 exponential smoothingx2
 Estimate year T+1 for each age Smooth improvement rate in T+1 constrained survivor ratio extrapolate to age 120 exponential smoothingx2")
12
Methodology - current Mortality rate = deaths/pop Smooth within years (to 103/104) Estimate year T+1 for each age Smooth improvement rate in T+1 constrained survivor ratio extrapolate to age 120 exponential smoothingx2 1x1 3x1 5x1 3x1 1x1 MAs
 Estimate year T+1 for each age Smooth improvement rate in T+1 constrained survivor ratio extrapolate to age 120 exponential smoothingx2 1x1 3x1 5x1 3x1 1x1 MAs")
13
Methodology - current Mortality rate = deaths/pop Smooth within years (to 103/104) Estimate year T+1 for each age Smooth improvement rate in T+1 Improvement rates up to T+26 constrained survivor ratio extrapolate to age 120 exponential smoothingx2 1x1 3x1 5x1 3x1 1x1 MAs
 Estimate year T+1 for each age Smooth improvement rate in T+1 Improvement rates up to T+26 constrained survivor ratio extrapolate to age 120 exponential smoothingx2 1x1 3x1 5x1 3x1 1x1 MAs")
14
Methodology - current Mortality rate = deaths/pop Smooth within years (to 103/104) Estimate year T+1 for each age Smooth improvement rate in T+1 Improvement rates up to T+26 constrained survivor ratio extrapolate to age 120 exponential smoothingx2 1x1 3x1 5x1 3x1 1x1 MAs T+26 expert opinions
 Estimate year T+1 for each age Smooth improvement rate in T+1 Improvement rates up to T+26 constrained survivor ratio extrapolate to age 120 exponential smoothingx2 1x1 3x1 5x1 3x1 1x1 MAs T+26 expert opinions")
15
Methodology - current Mortality rate = deaths/pop Smooth within years (to 103/104) Estimate year T+1 for each age Smooth improvement rate in T+1 Improvement rates up to T+26 Mortality rates for T+1 to T+26 constrained survivor ratio extrapolate to age 120 exponential smoothingx2 1x1 3x1 5x1 3x1 1x1 MAs T+26 expert opinions
 Estimate year T+1 for each age Smooth improvement rate in T+1 Improvement rates up to T+26 Mortality rates for T+1 to T+26 constrained survivor ratio extrapolate to age 120 exponential smoothingx2 1x1 3x1 5x1 3x1 1x1 MAs T+26 expert opinions")
16
Methodology - current Mortality rate = deaths/pop Smooth within years (to 103/104) Estimate year T+1 for each age Smooth improvement rate in T+1 Improvement rates up to T+26 Mortality rates for T+1 to T+26 constrained survivor ratio extrapolate to age 120 exponential smoothingx2 1x1 3x1 5x1 3x1 1x1 MAs T+26 expert opinions … further adjustments
 Estimate year T+1 for each age Smooth improvement rate in T+1 Improvement rates up to T+26 Mortality rates for T+1 to T+26 constrained survivor ratio extrapolate to age 120 exponential smoothingx2 1x1 3x1 5x1 3x1 1x1 MAs T+26 expert opinions … further adjustments")
17
Methodology - current Mortality rate = deaths/pop Smooth within years (to 103/104) Estimate year T+1 for each age Smooth improvement rate in T+1 Improvement rates up to T+26 Mortality rates for T+1 to T+26 constrained survivor ratio extrapolate to age 120 exponential smoothingx2 1x1 3x1 5x1 3x1 1x1 MAs T+26 expert opinions … further adjustments
 Estimate year T+1 for each age Smooth improvement rate in T+1 Improvement rates up to T+26 Mortality rates for T+1 to T+26 constrained survivor ratio extrapolate to age 120 exponential smoothingx2 1x1 3x1 5x1 3x1 1x1 MAs T+26 expert opinions … further adjustments")
18
Methodology - new Replace two-stage smoothing process Smooth mortality rates surface simultaneously over ages and years Estimate improvement rate using existing smoothed years – ie do not estimate T+1 Requires longer path to T+26 opinions!

19
Methodology – 2 dimensional p-spline Thoroughly tested, and recommended, by Continuous Mortality Investigation

20
Methodology – 2 dimensional p-spline Thoroughly tested, and recommended, by Continuous Mortality Investigation

21
Methodology – 2 dimensional p-spline Thoroughly tested, and recommended, by Continuous Mortality Investigation

22
Methodology – 2 dimensional p-spline Thoroughly tested, and recommended, by Continuous Mortality Investigation Best advice - read “Smoothing and forecasting mortality rates”, Currie et al, 2004!

23
Implementation Difficult to understand (and explain) … but easy to implement!
 … but easy to implement!")
24
Implementation Difficult to understand (and explain) … but easy to implement! MortalitySmooth (Carlo G Camarda) in R
 in R.")
25
Implementation Difficult to understand (and explain) … but easy to implement! MortalitySmooth (Carlo G Camarda) in R Mort2Dsmooth(x=ages,y=years,Z=deaths,offset=log(pop))
 in R Mort2Dsmooth(x=ages,y=years,Z=deaths,offset=log(pop)).")
26
Implementation Difficult to understand (and explain) … but easy to implement! MortalitySmooth (Carlo G Camarda) in R Smoothed values = 21st entry in list of R output Mort2Dsmooth(x=ages,y=years,Z=deaths,offset=log(pop))
 in R Smoothed values = 21st entry in list of R output Mort2Dsmooth(x=ages,y=years,Z=deaths,offset=log(pop)).")
27
Results - testing MalesFemales Sensitivity – adding annual data Ages 0 - 103 1961 – 2003 1961 – 2004 1961 – 2005 1961 – 2006 1961 – 2007 1961 – 2008 1961 – 2009 Ages 0 - 104 1961 – 2003 1961 – 2004 1961 – 2005 1961 – 2006 1961 – 2007 1961 – 2008 1961 – 2009 Sensitivity - adding years of age 1961 – 2009 0 – 90 0 – 100 0 – 103 1961 – 2005 1961 - 2009 0 – 104 0 – 90 0 – 105 0 – 100 0 – 106 0 – 104 0 – 105 0 – 106

28
Results - testing 0 1 2 3 4 5 6 102 % Age 0 20406080 10 30507090 61-04 61-05 61-06 61-09 Mortality improvement rates by age, 2003/04 61-07 61-08

29
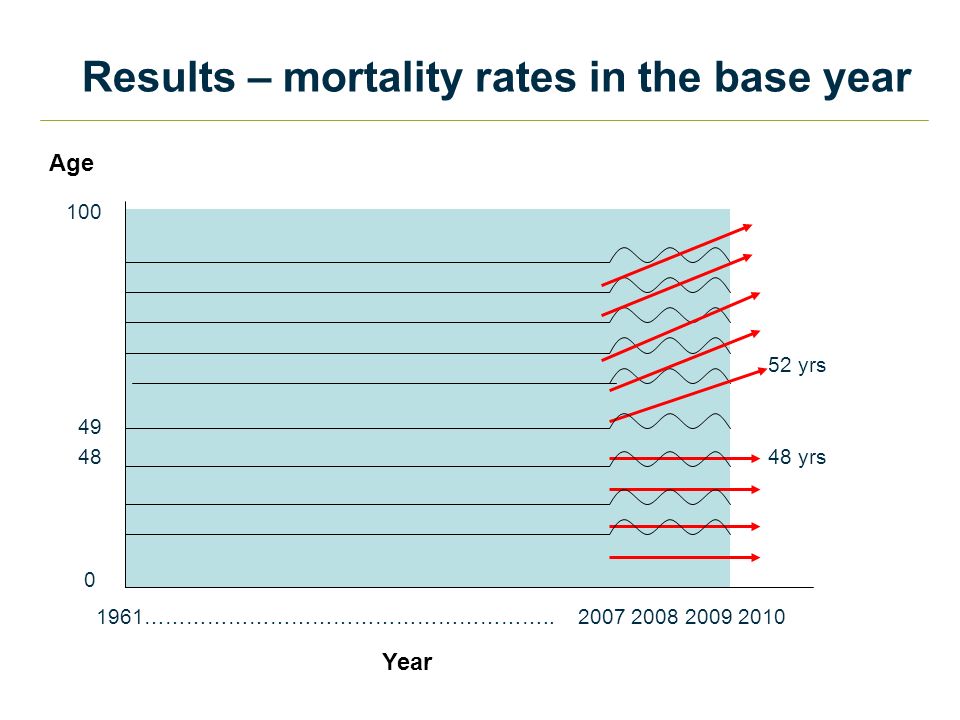
Results – mortality rates in the base year Issues New method does not project rates forward to base year Edge effects Solution Step back 2 years into the data set 2010 mortality rates = 2007 mortality rates x (1 – 2006-07 improvement rates/100) ^ 3
 ^ 3")
30
Results – mortality rates in the base year Year Age 100 52 yrs 49 48 48 yrs 0 1961………………………………………………….. 2007 2008 2009 2010
31
Past improvements in smoothed mortality rates, males – old method

32
Past improvements in smoothed mortality rates, males – new method

33
Past improvements in smoothed mortality rates, Scotland males – new method

34
Past improvements in smoothed mortality rates, females – old method

35
Past improvements in smoothed mortality rates, females – new method

36
Comparison of projected smooth % changes in death rates by age, UK 2009-10 Males

37
Comparison of projected smooth % changes in death rates by age, UK 2009-10 Females

38
Comparison of actual and projected expectation of life at birth

39
Summary New smoothing method used to produce the 2010-based ‘proposed’ mortality assumptions Introduced in the 2010-based consultation with devolved administrations and government departments

40
What’s next? More testing/evaluation: Over-smoothing Adding 2010 data Derivation of base year rates Using R to project mortality rates

Similar presentations


>")


. Presentation Outline Background Methodology Wales Results Household Estimates HOUSEGROUP WALES.>")
 Alistair.>")


