Download presentation
Presentation is loading. Please wait.

2
Measuring Light Quantitatively Spectroscopy: measuring wavelengths ( ) and frequencies ( ) emitted or absorbed by matter; composition of stars Photometry: measuring the intensity of light; luminosity of stars
 and frequencies ( ) emitted or absorbed by matter; composition of stars Photometry: measuring the intensity of light; luminosity of stars")
3
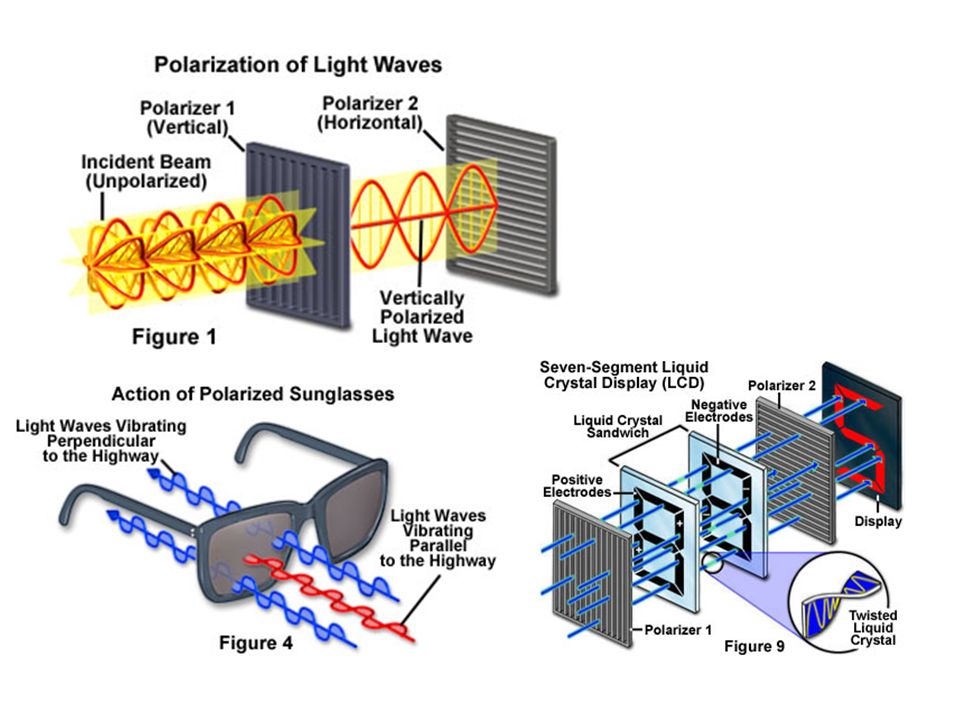
Measuring Light Quantitatively Polarimetry: measurement and interpretation of the polarization of light waves. Polarization: waves that have traveled through or have been reflected, refracted, or diffracted by some material; plane(s) of transmission absorbed
 of transmission absorbed.")
6
Radiation Radiant Energy: Electromagnetic (EM) energyElectromagnetic (EM) energy Energy that spreads out as it travels from its sourceEnergy that spreads out as it travels from its source Follows an inverse square lawFollows an inverse square law Can be measured in many different waysCan be measured in many different ways
 energyElectromagnetic (EM) energy Energy that spreads out as it travels from its sourceEnergy that spreads out as it travels from its source Follows an inverse square lawFollows an inverse square law Can be measured in many different waysCan be measured in many different ways")
7
Properties of Light Light is radiant energy Can travel through space without a physical mediumCan travel through space without a physical medium Speed = 300,000 km/secSpeed = 300,000 km/sec Speed in a vacuum is constant and is denoted by the letter “c”Speed in a vacuum is constant and is denoted by the letter “c”

8
Properties of Light c is reduced as it enters transparent materials;c is reduced as it enters transparent materials; The speed is dependent on color (Blue light slows more than red)The speed is dependent on color (Blue light slows more than red) Lenses and prisms work this wayLenses and prisms work this way Light is a “mix” of electrical and magnetic energyLight is a “mix” of electrical and magnetic energy
The speed is dependent on color (Blue light slows more than red) Lenses and prisms work this wayLenses and prisms work this way Light is a mix of electrical and magnetic energyLight is a mix of electrical and magnetic energy")
9
Nature of Light Light shows properties of waves Can measure wavelength ( λ) and frequency (υ)
 and frequency (υ)")
10
Nature of Light Light also behaves like a stream of particles called photonsLight also behaves like a stream of particles called photons Each photon carries a specific amount of energyEach photon carries a specific amount of energy All particles can also behave as wavesAll particles can also behave as waves Application: Photoelectric effectApplication: Photoelectric effect

11
Mathematical relationships:Mathematical relationships: c = = wavelength; = wavelength; = frequency c = speed of light As wavelength increases, frequency ____________

12
Energy and Light: E = h E = energy; h = Planck’s constant As frequency increases, energy ____________

13
visible spectrumThe range of colors to which the human eye is sensitive is called the visible spectrum wavelengthColor is determined by wavelength ( ) Frequency (or )Frequency (or ) is the number of wave crests that pass a given point in 1 second (measured in Hertz, Hz)
 Frequency (or )Frequency (or ) is the number of wave crests that pass a given point in 1 second (measured in Hertz, Hz)")
14
C Long λ; Low ν; Low E (Red)C Long λ; Low ν; Low E (Red) O L Mid λ; Mid ν; Mid E (Yellow)L Mid λ; Mid ν; Mid E (Yellow) O R Short λ; High ν; High E (Violet)R Short λ; High ν; High E (Violet)
C Long λ; Low ν; Low E (Red) O L Mid λ; Mid ν; Mid E (Yellow)L Mid λ; Mid ν; Mid E (Yellow) O R Short λ; High ν; High E (Violet)R Short λ; High ν; High E (Violet)")
15
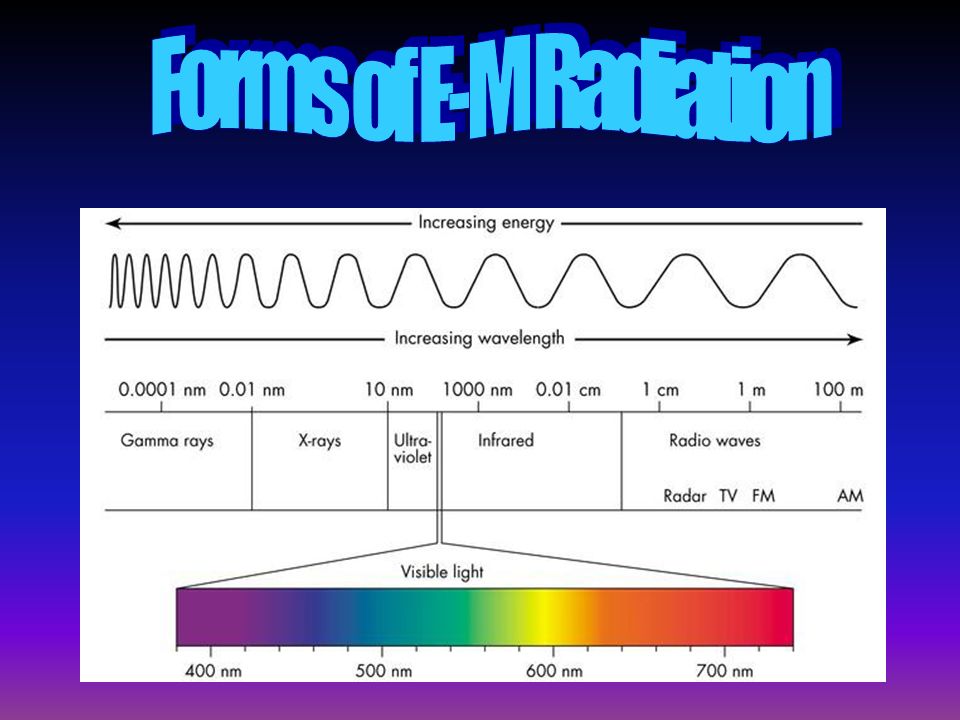
Electromagnetic Radiation Wavelengths range: 10 -14 m to 10 3 m Energy range follows the same pattern These trends make light a great probe for studying the Universe E-M spectrum includes radio, microwave, infrared, visible, ultraviolet, x-ray, and gamma radiations

18
Invisible Light in Our Universe www.warren-wilson.edu/.../sstephens/bragg2.html

19
Radio Waves Produced in 1888 by Hertz First cosmic detection - 1930’s Long wavelengths (big telescopes needed) Temperatures < 10 K Very Large Array – New Mexico M87 Galactic Center in radio
 Temperatures < 10 K Very Large Array – New Mexico M87 Galactic Center in radio")
20
Radio Waves For detection/study of: Cosmic Background Cold interstellar medium; site of star formation Regions near neutron stars & white dwarfs Dense regions of interstellar space (e.g. near the galactic center) Milky Way in visible (top) and radio wavelengths
 Milky Way in visible (top) and radio wavelengths.")
21
Infrared Radiation Discovered by Sir William Herschel (around 1800)Discovered by Sir William Herschel (around 1800) Long wavelength (λ); low frequency ( υ )Long wavelength (λ); low frequency ( υ ) Temperature range: 10 -10 3 KTemperature range: 10 -10 3 K Spitzer Space Telescope
Discovered by Sir William Herschel (around 1800) Long wavelength (λ); low frequency ( υ )Long wavelength (λ); low frequency ( υ ) Temperature range: KTemperature range: K Spitzer Space Telescope")
22
Infrared Radiation Useful in detecting: Cool stars Star Forming Regions Interstellar dust warmed by starlight Planets, Comets, Asteroids M104 in visible light M104 in IR

23
Ultraviolet Radiation Discovered by J. Ritter in 1801 Photographic plates exposed by “light” beyond the violet λ, higher energyShorter λ, higher energy Temperatures: 10 4 - 10 6 KTemperatures: 10 4 - 10 6 K Hampton UV Telescope

24
Ultraviolet Radiation Used to detect/study: Supernova remnants Very hot stars Quasars M101 in visible lightM101 in UV light

25
X-Rays Roentgen discovered X rays in 1895 First detected beyond the Earth in the Sun in late 1940s Used to study Neutron stars, Supernova remnants Chandra x-ray telescope The sun in x-ray

26
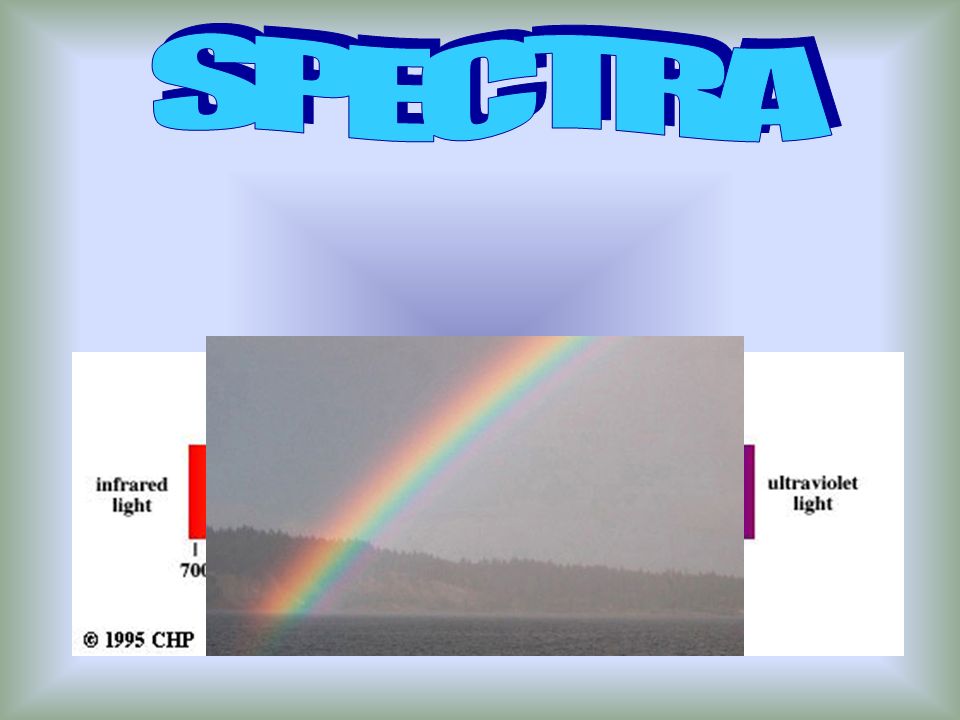
SPECTRA

27
Kirchhoff’s Law

28
Continuous Spectrum: produced when dense, hot matter emits a continuous array of wavelengths we see it as white light

30
Emission Spectrum emitwhen heated, a low-density gas (low pressure) will emit light in specific wavelengths emissionthe spectrum produced is called a line spectrum (also called an emission spectrum
 will emit light in specific wavelengths emissionthe spectrum produced is called a line spectrum (also called an emission spectrum")
31
Emission spectrum of H

32
Absorption Spectrum Cool, low-density gas between the source and observer absorbs light of specific wavelengths one gas will absorb and emit in the same waveleng ths

34
Spectra and Stars

35
Hydrogen Atom

36
Light & The Atom Electrons found in discrete energy levelsElectrons found in discrete energy levels Electrons absorb energy, move to higher levelsElectrons absorb energy, move to higher levels Electrons release energy as they move to lower energy levelsElectrons release energy as they move to lower energy levels

37
Solar Spectrum The core of our star produces a continuous spectrumThe core of our star produces a continuous spectrum Atoms in the atmosphere absorb the lightAtoms in the atmosphere absorb the light These atoms emit light in random directions – that produces dark lines in the spectrumThese atoms emit light in random directions – that produces dark lines in the spectrum

38
Solar Spectrum

39
Fraunhofer linesThe dark lines are called Fraunhofer lines

40
The Sun’s Spectrum

41
Arcturus Spectrum

42
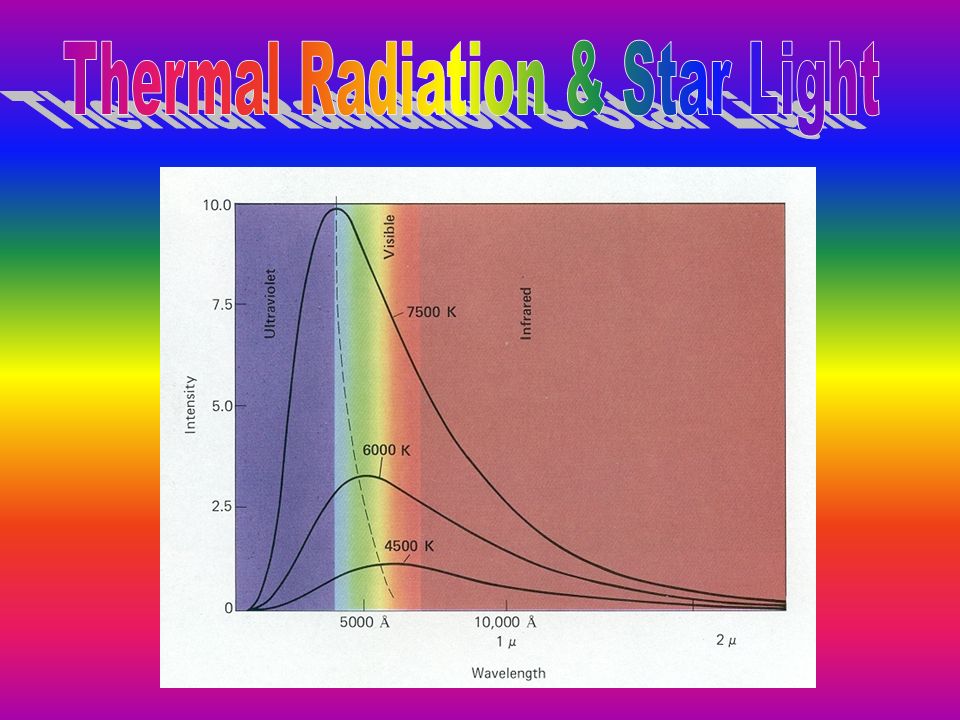
Thermal Radiation & Starlight Wien’s Displacement Law Heated bodies generally radiate across the entire electromagnetic spectrumHeated bodies generally radiate across the entire electromagnetic spectrum There is one particular wavelength, λ m, at which the radiation is most intense and is given by Wien’s Law:There is one particular wavelength, λ m, at which the radiation is most intense and is given by Wien’s Law: λ m = k/T Where k is some constant and T is the temperature of the body

43
Thermal Radiation & Starlight As the temperature of a star increases, the most intense wavelengths become shorterAs the temperature of a star increases, the most intense wavelengths become shorter As an object heats, it appears to change color from red to white to blueAs an object heats, it appears to change color from red to white to blue

44
Spectroscopy

46
Stefan-Boltzmann Law As the temperature of a star increases, the total energy output increases as the 4th power of the temperature E T 4

47
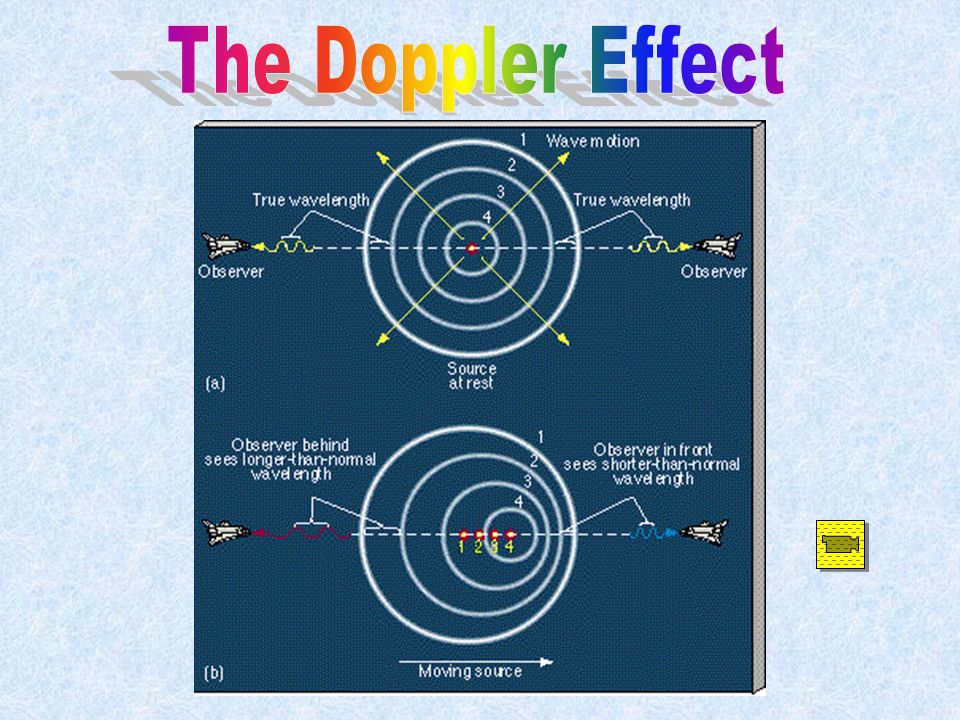
Motion-induced change in the observed wavelength of any wave — light or sound—is known as the Doppler effect If the source is moving toward the observer, waves become compressed blueA shorter wavelength will appear blue blue-shiftThis is called a blue-shift

48
If the source is moving away from the observer, waves will be “stretched out” redA longer wavelength will appear red red-shiftKnown as red-shift

50
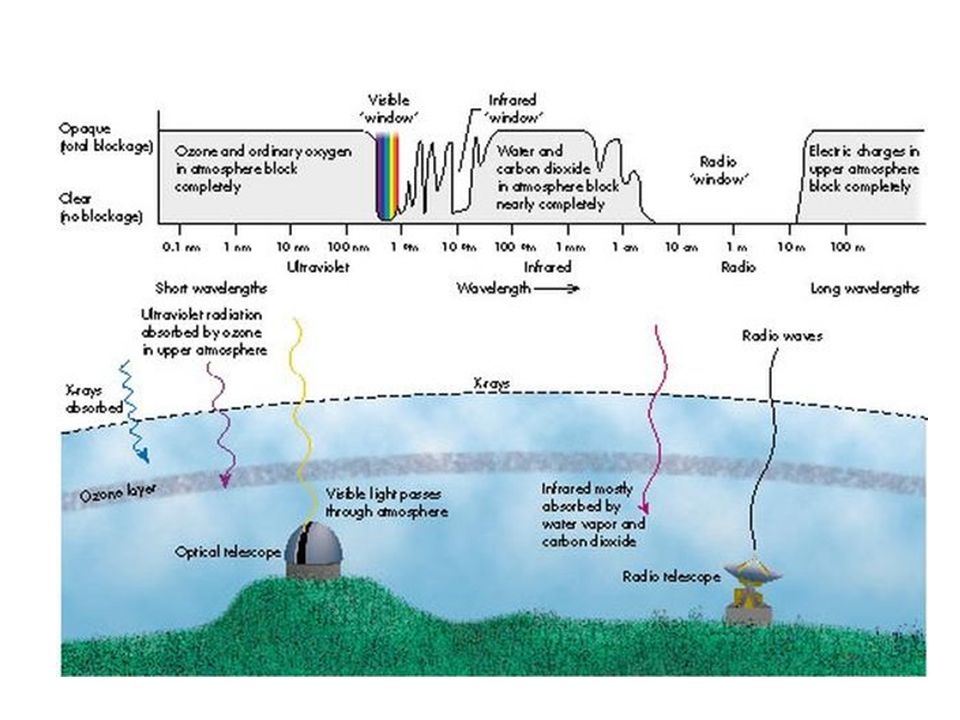
Absorption in the Atmosphere Gases in the Earth’s atmosphere absorb electromagnetic radiation: most wavelengths from space do not reach the groundGases in the Earth’s atmosphere absorb electromagnetic radiation: most wavelengths from space do not reach the ground Visible light, most radio waves, and some infrared penetrate the atmosphere through atmospheric windows, wavelength regions of high transparencyVisible light, most radio waves, and some infrared penetrate the atmosphere through atmospheric windows, wavelength regions of high transparency Lack of atmospheric windows at other wavelengths is the reason for astronomers placing telescopes in spaceLack of atmospheric windows at other wavelengths is the reason for astronomers placing telescopes in space

Similar presentations


>")


 The McGraw-Hill Companies, Inc. Permission required for reproduction or display.>")


