Download presentation
Presentation is loading. Please wait.

1
Ch.9 – Graphics and Visual Information Melek OKTAY www.fatih.edu.tr/~moktay moktay@fatih.edu.tr

2
Outline The Power of the Picture When to Use Visual Different Visuals for Different Audiences Text into Tables Numbers into Table Illustrations Diagrams Symbols and Icons Wordless Instruction Photographs Maps

3
The Power of the Picture When to Use Visual Different Visuals for Different Audiences Text into Tables Numbers into Table Illustrations Diagrams Symbols and Icons Wordless Instruction Photographs Maps

4
The Power of the Picture “We all think visually” William Horton Before there were alphabets or symbols for numbers, humans communicated visually. When people look at a visual pattern, such as graph they see it as one large pattern A whole unit that conveys information quickly and efficiently For instance, the line graph in Figure 9.1. has no verbal information Without verbal info. or without the help of any words, tells you that the trend is rising

5
The Power of the Picture The stock began at ~15, then rose to 16. It rose again to 17,18,18.5, and 19…

6
The Power of the Picture Visuals are especially important in technical communication because they enhance accessibility (ulaşılabilirlik), usibility and relevance (belirli bir konuya ilgi) Accessibility: Because humans understand visuals intuitively, visual information makes your cont ent accesible to wide audiance. Also, if your manual or report is written in English, charts or graphs can often be easily understood by non-English speakers. Usibility: Information is usable when audiences can find what they need to perform the tasks at hand. Visuals can simplify this process, because they focus and organize information, making it easier to remember and interpret Relevance: Information is relevant if people can relate the content of the information to the task they need to perform Well designed visual can help readers see the connection between information and their task or project.

7
When to Use Visual The Power of the Picture When to Use Visual Different Visuals for Different Audiences Text into Tables Numbers into Table Illustrations Diagrams Symbols and Icons Wordless Instruction Photographs Maps

8
When to Use Visual Ingeneral, you should use visuals whenever they make your point more clearly than text or when they enhance your text. Use visuals to clarify and enhance your discussion, not just to decorate your document. Use Visuals to direct the audience’s focus or help people remember something. Certain Industries, such as the financial sector, often use graphs and charts (Dow Jones Industrial average)
.")
9
Different Visuals for Different Audiences The Power of the Picture When to Use Visual Different Visuals for Different Audiences Text into Tables Numbers into Table Illustrations Diagrams Symbols and Icons Wordless Instruction Photographs Maps

10
Different Visuals for Different Audiences Like all effective technical communication, visuals must fit your audience and purpose. For example, Figure 9.2. shows a special type of visual called a surface temperature plot. Using curves,lines and other symbolls makes complete sense to a trained meteorologiest but would baffle (şaşırtmak) a general audience Compare this chart with the line graph in Figure 9.3, taken National Climate Data Center Web site In short, a visiual’s content must be familiar to the audience, and the type of visual must also be understandable
 a general audience Compare this chart with the line graph in Figure 9.3, taken National Climate Data Center Web site In short, a visiual’s content must be familiar to the audience, and the type of visual must also be understandable.")
11
Different Visuals for Different Audiences (Figure 9.2)
")
12
Different Visuals for Different Audiences (Figure 9.3)
")
13
Text into Tables The Power of the Picture When to Use Visual Different Visuals for Different Audiences Text into Tables Numbers into Table Illustrations Diagrams Symbols and Icons Wordless Instruction Photographs Maps

14
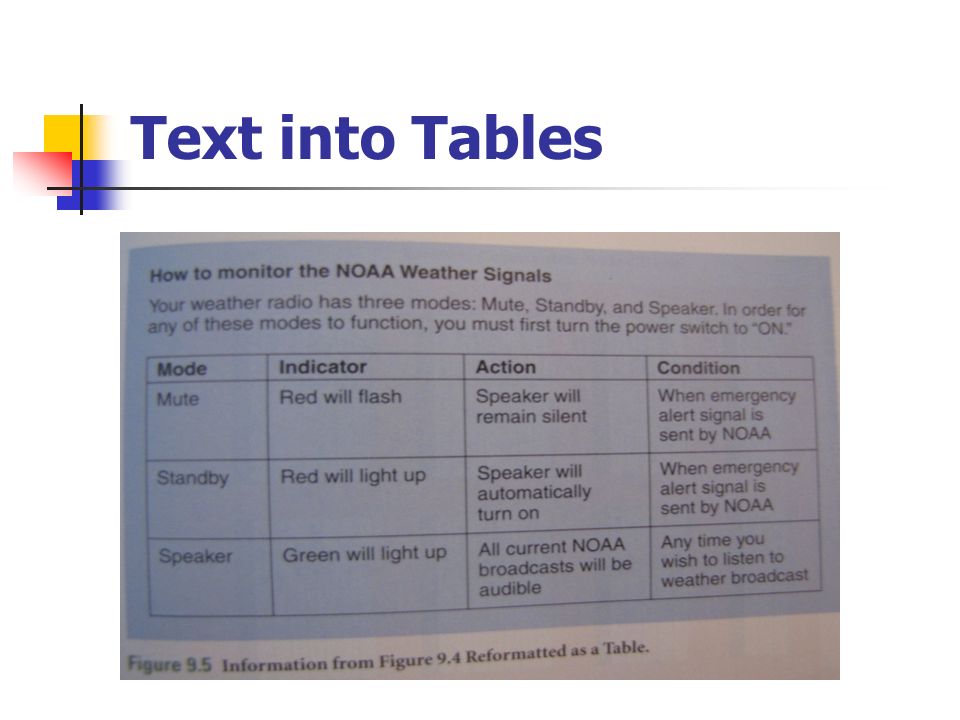
Text into Tables A table is powerful way to illustrate dense textual information, such as specifications, comparisons, or conditions. Figure 9.4 shows a page from an instruction manual for a weather radio. In its purely textual form, this information is hard to follow, because readers have to jump back and fourth between the sentences to compare the different conditions. But in a table format, parallel information can be listed in the same column and row, as shown in Figure 9.5.

15
Text into Tables

17
Numbers into Table The Power of the Picture When to Use Visual Different Visuals for Different Audiences Text into Tables Numbers into Table Illustrations Diagrams Symbols and Icons Wordless Instruction Photographs Maps

18
Numbers into Table Visuals are especially effective in translating numeric data into shapes, shades, and patterns. Graphs and charts help you achieve this purpose.

19
Graphs Graphs display, at a glance (bir bakışta), the approximate values, the point being made about those values, and the relationship being emphasized (vurgulamak). Simple line Graph: a simple line graph, as illustrate in Figure 9.7, uses one line to plot time intervals on the horizontal scale and values on the vertical scale. Multiline Graph: The multiline graph is Figure 9.8 uses three line to illustrate seperate trends for two major types of Information Technology (IT) workers, as well as the overall trend for all workers.
 workers, as well as the overall trend for all workers..")
20
Simple Line Graph (Figure 9.7)
")
21
Multiline Graph (Figure 9.8)
")
22
Graphs Band Graph: The text graph, Figure 9.9, is also a type of line graph called a band or area graph By shading in the areas beneath the main plot lines, you can highlight specific features. Bar Graph: Bar graph show discrete comparisons, such as year by year or month by month. Each represents a specific quantity Simple Bar Graph: A simple bar graph displays one trend or theme. The simple bar graph in Figure 9.10 is derived from U.S. Census data for the year 1890 Bar graph call attention to the high and low points by focusing the eye on the highest and lowest bar.

23
Band Graph (Figure 9.9)
")
24
Simple Bar Graph (Figure 9.10)
")
25
Graphs Multiple Bar Graph: A bar graph can display two or three relationships simultaneously. Figure 9.11 contrasts three sets of information, allowing readers to see three trends When you create a multiple-bar graph, be sure to use a different color or pattern for each bar, and include a key so your audience knows which color or pattern corresponds to which bar. (More than three use another graph) Deviation Bar Graph: Most graph begin at a zero axis point, displaying only positive value. Deviation bar graph, however, display positive and negative values, as Figure 9.12
 Deviation Bar Graph: Most graph begin at a zero axis point, displaying only positive value. Deviation bar graph, however, display positive and negative values, as Figure")
26
Multiple Bar Graph (Figure 9.11)
")
27
Deviation Bar Graph (Figure 9.12)
")
28
Charts The term graph and chart are often used interchangeably. But a chart displays relationships that are not plotted on a coordinate system (x and y axes) Commonly used charts include pie charts, Gantt charts, tree charts, and pictograms.
 Commonly used charts include pie charts, Gantt charts, tree charts, and pictograms..")
29
Pie Charts Pie charts are among the common charts and are easy for almost anyone to understand. Pie charts display the relationship of parts or percentage to whole. With pie chart, make sure the parts add up to 100 percent. Use different colors or shades to distinguish between parts and the whole, or differentiate by exploding out each pie “slice”

30
Pie Charts (Figure 9.13)
")
31
Gantt Chart Gantt charts (named for engineer H.L. Gantt, 1861-1919) depict how the parts of an idea or concept relate to each other. A series of bars or lines (time lines) indicates beginning and completion dates for each phase or task in a project. Many professionals use project managment software to produce Gantt and similar charts
 depict how the parts of an idea or concept relate to each other. A series of bars or lines (time lines) indicates beginning and completion dates for each phase or task in a project. Many professionals use project managment software to produce Gantt and similar charts.")
32
Gantt Chart (Figure 9.15)
")
33
Tree Chart Many types of charts can be generally categorized as “tree” chart. These include following: Flowcharts, which use a tree structure to trace a produce from beginning to end. Software charts, which use a tree structure to outline the logical steps in a computer program Organization charts, which show the hierarchy and relationships between different departments and other units in an organization. Figure 9.16 shows an organizational tree chart

34
Tree Chart (Figure 9.16)
")
35
Pictogram Pictograms are something of a cross between a bar graph and a chart. Like line graphs, pictogram display numeric data, often by plotting it across x and y axes. But like a chart, pictograms use icons, symbols, and other graphic devices rather than simple lines or bars. Figure 9.17 is a pictogram taht uses stick figure icons to illustrate population at different times Pictograms are visually appealing and can be especially useful for nontechnical audiences.

36
Pictogram (Figure 917)
")
37
Illustrations The Power of the Picture When to Use Visual Different Visuals for Different Audiences Text into Tables Numbers into Table Illustrations Diagrams Symbols and Icons Wordless Instruction Photographs Maps

38
Illustrations An illustration is sometimes the best and only way to convey information. Illustrations can be drawings, diagrams, symbols, icons, photographs, maps, or any other visual that relies on picture rather than data or words. Figure 9.18, it offers an overview of the brain’s shape, the relative size of its segments, and its structure. You can simplify the view, remove any unnecessary features, and focus on what is important.

39
Illustrations (Figure 9.18)
")
Similar presentations