Download presentation
Presentation is loading. Please wait.

1
Hurricane Insurance Panel Presentation by Mike Smith, Ray Stahl, Scott Ward & Mark Yearn

3
Hurricane History Andrew (1992) Total insured losses…. $30 billion Boat Losses….. $500 million Charley, Frances, Ivan & Jeanne (2004) Total insured losses $25 billion Boat losses…….$680 million
 Total insured losses $25 billion Boat losses…….$680 million.")
4
Monty’ Marina - Coconut Grove, FL

5
Black Hawk Marina - Homestead, FL

11
Landfall in the Caribbean Average*2006F Entire US Coast52%81% US East Coast Including Florida Peninsula31%64% Gulf Coast from FL Panhandle to Brownsville, TX 30%47% Above-Average Major Hurricane

12
Hurricane Activity Statistics Average*2005**2006F Named Storms9.62617 Named Storm Days49.1115.585 Hurricanes5.9149 Hurricane Days24.547.545 Intense Hurricanes2.375 Intense Hurricane Days2.375 Net Tropical Cyclone Activity100%263%195%

13
Hurricane Isabel Approaching

15
Boat Heap – Hurricane Jeanne (2004)
")
16
Marsh Harbour, Bahamas Tropical Storm Jeanne (2004)
")
17
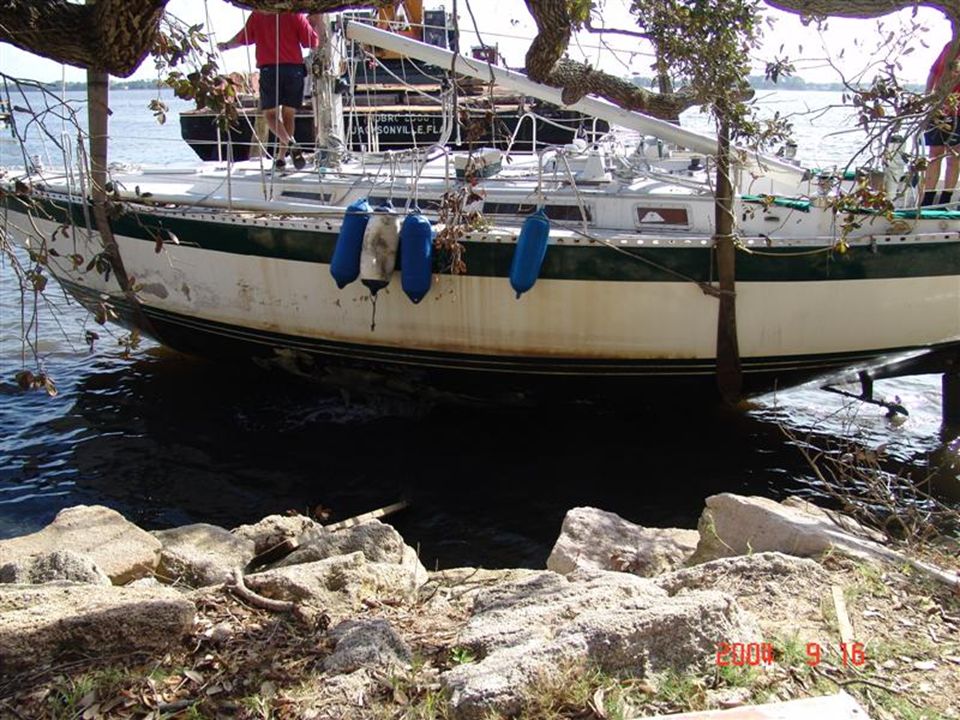
Hurricane Frances (2004)
")
18
Boat on Dock - Hurricane Frances

19
Hurricane Frances – Jensen Beach, FL

20
Hurricane Frances – Palm Beach, FL

21
Spice Island Marina, Grenada Hurricane Ivan (2004)
")
22
Hurricane Ivan (2004)
")
23
Hurricane Ivan Flooding (2004)
")
24
Hurricane Frances (2004)
")
25
Tropical Storm Cindy (2005)
")
26
Hurricane Isabel (2003)
")
27
Sailboat - Bahamas

28
Hurricane Charley (2003)
")
29
Hurricane Katrina Wind Speed Approximately 140 mph

30
Most Intense U.S. Hurricanes at Landfall Source: National Weather Service HurricaneYear Barometric pressure (inches) Wind speed (mph) "Labor Day" (Fla. Keys) 193526.35160 Camille196926.84190 Katrina200527.11140 Andrew199227.23165
 Wind speed (mph) Labor Day (Fla. Keys) Camille Katrina Andrew")
31
Hurricane Rita

32
Hurricane Wilma (2005)
")
33
Hurricane Ivan

34
Storm Surge Okaloosa Island Hurricane Dennis

35
Hurricane Camille (1969)
")
36
Hurricane Camille – Gulfport, MS

37
Hurricane Camille Satellite Imagery

38
“Labor Day Hurricane” Florida Keys (1935)
")
39
Hurricane Andrew (1992)
")
40
Boat Storage – Hurricane Andrew

41
Bertram Yacht on Dock Hurricane Andrew

42
Hurricane Hugo (1989)
")
43
Hurricane Alicia (1983)
")
44
Hurricane Opal (1995)
")
45
Hurricane Wilma (2005)
")
46
Top 10 Deadliest Hurricanes (Atlantic) * www.mthurricanes.com Rank Hurricane NameYear CategoryDeaths 1Texas (Galveston)190048000 2FL (Lake Okeechobee)192841836 3Hurricane Katrina200541336+ 4Florida Keys19194600 5New England19383600 6Florida Keys (Labor Day)19355408 7Audrey19574390 8NE United States19443390 9LA (Grand Isle)19094350 10LA (New Orleans)19154275
 * Rank Hurricane NameYear CategoryDeaths 1Texas (Galveston) FL (Lake Okeechobee) Hurricane Katrina Florida Keys New England Florida Keys (Labor Day) Audrey NE United States LA (Grand Isle) LA (New Orleans)")
47
Most Expensive Hurricanes (Atlantic) *www.mthurricanes.com Rank Hurricane NameYearCategoryDamage (U.S.) 1Hurricane Katrina20054$80 Billion 2Hurricane Andrew19925$26.5 Billion 3Hurricane Charley20044$15 Billion 4Hurricane Wilma20053$14.4 Billion 5Hurricane Ivan20043$14.2 Billion 6Hurricane Rita20053$10 Billion 7Hurricane Frances20042$8.9 Billion 8Hurricane Hugo19894$7 Billion 9Hurricane Jeanne20043$6.9 Billion 10Tropical Storm Allison2001T.S.$5 Billion Note: Damages are listed in US dollars and are not adjusted for inflation.
 * Rank Hurricane NameYearCategoryDamage (U.S.) 1Hurricane Katrina20054$80 Billion 2Hurricane Andrew19925$26.5 Billion 3Hurricane Charley20044$15 Billion 4Hurricane Wilma20053$14.4 Billion 5Hurricane Ivan20043$14.2 Billion 6Hurricane Rita20053$10 Billion 7Hurricane Frances20042$8.9 Billion 8Hurricane Hugo19894$7 Billion 9Hurricane Jeanne20043$6.9 Billion 10Tropical Storm Allison2001T.S.$5 Billion Note: Damages are listed in US dollars and are not adjusted for inflation.")
Similar presentations


 as a tropical wave on August 14, 1992. Became a tropical.>")


 Computer (categorizes storm) Communications (issues watches and warnings) FEMA.>")


