Download presentation
Presentation is loading. Please wait.

1
Floyds Fork Bacteria TMDL Andrea M. Fredenburg Kentucky Division of Water TMDL Section November 28, 2012

2
Goals Present watershed information Present TMDL calculations Provide example for one stream segment Vote on options for path forward to public notice

3
KY’s Bacteria Criteria Summer PCR Limit (May 1 - Oct. 31)SCR Limit (year round) Bacteria Geometric Mean (colonies/100 ml) Maximum (colonies/100 ml) Geometric Mean (colonies/100 ml) Maximum (colonies/100 ml) Fecal coliform 200 (from 5 samples collected within 30 days) 400 (number not to be exceeded in more than 20% of the samples) 1000 (from 5 samples collected within 30 days) 2000 (number not to be exceeded in more than 20% of the samples) E. coli 130 (from 5 samples collected within 30 days) 240 (number not to be exceeded in more than 20% of the samples) No criterion (this does not mean that any number is safe; rather that KY regulations do not tell the safe limit ) No criterion (this does not mean that any number is safe; rather that KY regulations do not tell the safe limit )
SCR Limit (year round) Bacteria Geometric Mean (colonies/100 ml) Maximum (colonies/100 ml) Geometric Mean (colonies/100 ml) Maximum (colonies/100 ml) Fecal coliform 200 (from 5 samples collected within 30 days) 400 (number not to be exceeded in more than 20% of the samples) 1000 (from 5 samples collected within 30 days) 2000 (number not to be exceeded in more than 20% of the samples) E. coli 130 (from 5 samples collected within 30 days) 240 (number not to be exceeded in more than 20% of the samples) No criterion (this does not mean that any number is safe; rather that KY regulations do not tell the safe limit ) No criterion (this does not mean that any number is safe; rather that KY regulations do not tell the safe limit ).")
4
Monitoring Data 319 (h) funded—Currys Fork and Bullitt Co. MSD Historical KDOW data EPA funded—USGS data collection

5
Currys Fork WBP Sites (2007, 2009) Station Name# % Exceeding WQC (400 col/100 ml) Min (col/100 ml) Max (col/100 ml) Ave (col/100 ml) CF12454.25099001478 CF22470.860250003314 CF32466.7200880004987 NC13076.7100220003567 NC1a1872.260210003329 NC1b1060.05068001828 NC21747.1185000890 SC12785.2110870006381 SC22857.15063002049 TB12065.030130001788 TB1a1291.720059001777
 Station Name# % Exceeding WQC (400 col/100 ml) Min (col/100 ml) Max (col/100 ml) Ave (col/100 ml) CF CF CF NC NC1a NC1b NC SC SC TB TB1a")
6
Bullitt County WBP Sites (2005-2006) Station Name# % Exceeding WQC (400 col/100 ml) Min (col/100 ml) Max (col/100 ml) Ave (col/100 ml) BB-1366.73206000020267 BB-2366.7206000021773 BL-1310060030001500 BL-2333.32102100900 BR-1310021006000023700 BR-2310060017001233 CC-13100500560520 CC-2366.7230500410 CR-1310014006000021300 FF-1771.413079002700 FF-2757.110060001393 TB-13100230006000043000 TB-231008006000020567 WR-13100600230009200 WR-231006006000020667
 Station Name# % Exceeding WQC (400 col/100 ml) Min (col/100 ml) Max (col/100 ml) Ave (col/100 ml) BB BB BL BL BR BR CC CC CR FF FF TB TB WR WR")
7
MSD Sample Sites (2000-2010) Station Name# % Exceeding WQC (400 col/100 ml) Min (col/100 ml) Max (col/100 ml) Ave (col/100 ml) ECCCC00134523.5358400788 EFFCR00134628.6315000769 EFFCR00234337.92294001264 EFFFF00231930.73313501041 EFFFF00334628.6364800859 EFFFF00134330.63334292859 EPRPR00133636.03456001334
 Station Name# % Exceeding WQC (400 col/100 ml) Min (col/100 ml) Max (col/100 ml) Ave (col/100 ml) ECCCC EFFCR EFFCR EFFFF EFFFF EFFFF EPRPR")
8
KDOW Sample Sites (1998-2009) Station Name# % Exceeding WQC (400 col/100 ml) Min (col/100 ml) Max (col/100 ml) Ave (col/100 ml) 11010 N/A 211001500 N/A 31100500 N/A 41100520 N/A 511003000 N/A 611003000 N/A 710200 N/A 810300 N/A 97040310176 PRI1003330.31012000806 SRW012633.31203400987 Station Name# % Exceeding WQC (240 col/100 ml) Min (col/100 ml) Max (col/100 ml) Ave (col/100 ml) PRI1001838.939.93100830
 Station Name# % Exceeding WQC (400 col/100 ml) Min (col/100 ml) Max (col/100 ml) Ave (col/100 ml) N/A N/A N/A N/A N/A N/A N/A N/A PRI SRW Station Name# % Exceeding WQC (240 col/100 ml) Min (col/100 ml) Max (col/100 ml) Ave (col/100 ml) PRI")
9
USGS Sample Sites (2007-2008) Station Name# % Exceeding WQC (240 col/100 ml) Min (col/100 ml) Max (col/100 ml) Ave (col/100 ml) AR-16100390210007022 CANE-1125020360004187 CF-1207092200002295 FF-11741.2168300925 FF-21872.220520005058 FF-31952.64480003178 FF-42128.660140001008 FF-72231.810310001816 LR-11361.581100403 LR-21662.56089001650 NFCF-1209092140001867 PL-11770.624170001997 PL-2207080200002277 PL-31747.1369000854 SFCF-11533.343300449 SFCF-21963.24220002760 SLR-11855.61099001693
 Station Name# % Exceeding WQC (240 col/100 ml) Min (col/100 ml) Max (col/100 ml) Ave (col/100 ml) AR CANE CF FF FF FF FF FF LR LR NFCF PL PL PL SFCF SFCF SLR")
10
USGS Sample Sites (2007-2008) Station Name# % Exceeding WQC (240 col/100 ml) Min (col/100 ml) Max (col/100 ml) Ave (col/100 ml) CC-222505495001023 CR-12176.296230002533 CR-2204540120001084 CR-32454.260180002202 FF-521194190001149 FF-6211912190001239 FF-82142.984210001938 JTOWNSTP1822.2813000978 PR-12157.1100140002522
 Station Name# % Exceeding WQC (240 col/100 ml) Min (col/100 ml) Max (col/100 ml) Ave (col/100 ml) CC CR CR CR FF FF FF JTOWNSTP PR")
11
Bacteria Impaired Segments 18 impaired stream segments –18 E. coli PCR –4 Fecal coliform PCR –4 Fecal coliform SCR 26 listed waterbody/pollutant combinations

12
Floyds Fork Bacteria Impairments Waterbody NamePollutantCountyImpaired Use Ashers Run 0.0 to 4.8E. coliOldhamPCR Ashers Run 0.0 to 4.8Fecal coliformOldhamPCR Cane Run 0.0 to 7.3E. coliJeffersonPCR Cedar Creek 4.3 to 11.1E. coliJeffersonPCR Cedar Creek 4.3 to 11.1Fecal coliformJeffersonPCR Chenoweth Run 0.0 to 5.25E. coliJeffersonPCR Chenoweth Run 0.0 to 5.25Fecal coliformJeffersonPCR Chenoweth Run 0.0 to 5.25Fecal coliformJeffersonSCR Chenoweth Run 5.25 to 9.2E. coliJeffersonPCR Chenoweth Run 5.25 to 9.2Fecal coliformJeffersonPCR Chenoweth Run 5.25 to 9.2Fecal coliformJeffersonSCR Currys Fork 0.0 to 4.8E. coliOldhamPCR Floyds Fork 0.0 to 11.7E. coliBullittPCR Floyds Fork 11.7 to 24.2E. coliJeffersonPCR Floyds Fork 24.2 to 34.1E. coliJeffersonPCR Floyds Fork 34.1 to 61.9E. coliShelbyPCR Floyds Fork 34.1 to 61.9Fecal coliformShelbySCR Long Run 0.0 to 9.9E. coliJeffersonPCR North Fork Currys Fork 0.0 to 6.0E. coliOldhamPCR Pennsylvania Run 0.0 to 3.3E. coliJeffersonPCR Pennsylvania Run 0.0 to 3.3Fecal coliformJeffersonSCR Pope Lick 0.0 to 2.1E. coliJeffersonPCR Pope Lick Creek 2.1 to 5.5E. coliJeffersonPCR South Fork Currys Fork 0.0 to 6.1E. coliOldhamPCR South Long Run 0.0 to 3.35E. coliJeffersonPCR UT of South Fork Currys Fork 0.0 to 1.8E. coliOldhamPCR

13
Floyds Fork Bacteria Impairments

16
Potential Sources KPDES-permitted sources to WLA Others to LA

17
Sanitary Wastewater Systems

19
MS4 Entities

20
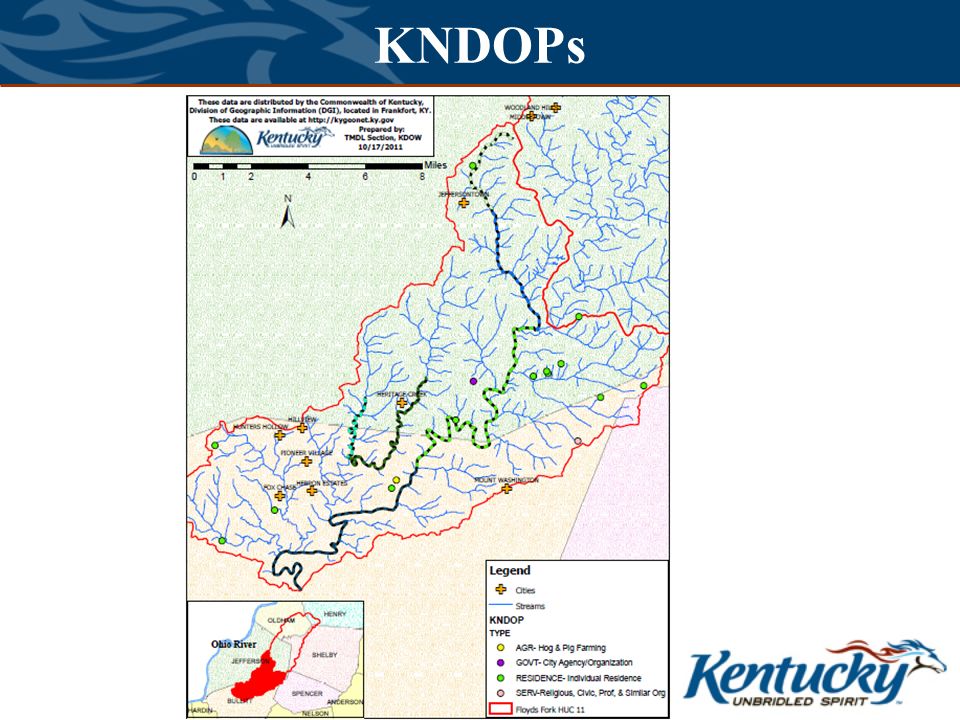
KNDOPs

22
Sewer Lines* *Information Not Available for Jefferson County

23
Sewer Lines* *Information Not Available for Jefferson County

24
Septic Tank Suitability

25
Land Cover

26
TMDL Calculation Example South Fork Currys Fork 0.0 to 6.1 E. coli PCR impairment SFCF-2 USGS sample site

27
South Fork Currys Fork

28
TMDL Equation TMDL (allowable # per day) = Allowable Concentration (allowable # per 100 ml) x Flow (in cubic feet per second) x Conversion Factor (24,465,758.4 per day) Conversion factor is figured as 1 cubic foot = 28316.85 ml and 1 day = 86400 seconds 1 x 1 cubic foot x 28316.85 ml x 86400 seconds = 24,465,758.4 100 ml second 1 cubic foot 1 day 1 day
 = Allowable Concentration (allowable # per 100 ml) x Flow (in cubic feet per second) x Conversion Factor (24,465,758.4 per day) Conversion factor is figured as 1 cubic foot = ml and 1 day = seconds 1 x 1 cubic foot x ml x seconds = 24,465, ml second 1 cubic foot 1 day 1 day")
29
SFCF-2 Sample Data USGS Site IDDate Discharge (cfs) E. coli (colonies/ 100 ml) SFCF-25/23/2007 190 SFCF-26/11/2007 461 SFCF-26/25/2007 550 SFCF-27/17/2007 580 SFCF-27/31/20070.32450 SFCF-28/14/2007 140 SFCF-29/6/2007 28 SFCF-210/16/2007 56 SFCF-210/24/2007 4300 SFCF-26/10/2008 640 SFCF-26/23/2008 720 SFCF-27/16/2008 <4 SFCF-27/31/2008 22000 SFCF-28/19/2008 110 SFCF-29/23/2008 >1000 SFCF-210/2/2008 1800 SFCF-210/9/2008 3400 SFCF-210/16/2008 16000 SFCF-210/23/2008 20
 SFCF-25/23/ SFCF-26/11/ SFCF-26/25/ SFCF-27/17/ SFCF-27/31/ SFCF-28/14/ SFCF-29/6/ SFCF-210/16/ SFCF-210/24/ SFCF-26/10/ SFCF-26/23/ SFCF-27/16/2008 <4 SFCF-27/31/ SFCF-28/19/ SFCF-29/23/2008 >1000 SFCF-210/2/ SFCF-210/9/ SFCF-210/16/ SFCF-210/23/")
30
Convert Gage Flow to TMDL Site Flow Gage03297900 Date Flow at Gage (cfs) 7/27/20085.1 7/28/20085.6 7/29/20085.6 7/30/20085.7 7/31/2008233 8/1/200860 8/2/200821 8/3/200813 8/4/20089.1 8/5/20087.2 Flow at sample site = Acres of land draining to sample site ÷ Acres of land draining to gage site x Flow at gage Sample Site SFCF-2 Acres Gage Acres 467251136 Flow at sample site = 4672 acres ÷ 51136 acres x 233 cfs Flow at sample site = 21.3 cfs
 7/27/ /28/ /29/ /30/ /31/ /1/ /2/ /3/ /4/ /5/ Flow at sample site = Acres of land draining to sample site ÷ Acres of land draining to gage site x Flow at gage Sample Site SFCF-2 Acres Gage Acres Flow at sample site = 4672 acres ÷ acres x 233 cfs Flow at sample site = 21.3 cfs")
31
Site SFCF-2 TMDL TMDL = Allowable Concentration x Flow x Conversion Factor TMDL = 240 E. coli colonies per 100 ml x 21.3 cfs x 24,465,758.4 per day TMDL = 125,068,956,900 E. coli colonies per day TMDL = 1.25E+11 E. coli colonies/day

32
Segment TMDL Segment TMDL = Site TMDL x Acres at downstream end of segment ÷ Acres at site Sample Site SFCF-2 Acres South Fork Currys Fork at RM 0.0 acres 46725949 Segment TMDL = 1.25E+11 E. coli colonies/day x 5949 acres ÷ 4672 acres Segment TMDL = 1.59E+11 E. coli colonies/day

33
TMDL and Flow TMDL = Allowable Concentration x Flow x Conversion Factor TMDL ≈ Flow Sample Load = Sample Concentration x Flow (on sample day) x Conversion Factor
 x Conversion Factor")
34
Load Duration Curve

35
Source Areas

36
TMDL Allocations TMDL = ∑WLA + ∑LA + MOS Explicit MOS is 10% of TMDL Segment TMDL = 1.59E+11 E. coli colonies/day MOS= 1.59E+11 E. coli colonies/day x 10% MOS= 1.59E+10 E. coli colonies/day South Fork Currys Fork 0.0-6.1

37
SWS-WLA SWS-WLA = Allowable Concentration of Bacteria (#/100 ml) x Facility Design Capacity (Design Flow in cfs) x Conversion Factor (24,465,758.4/day) Permit #Facility Name Maximum Allowable Limit for E. coli (colonies/100 ml) Facility Design Capacity (cfs) Conversion Factor (1/day) SWS-WLA (E. coli colonies/day KY0029441 Green Valley Apartments 2400.0464168724,465,758.402.73E+08 KY0039870 Lakewood Valley 2400.154722924,465,758.409.08E+08 KY0054674 Lockwood Estates Subdivision 2400.06962530524,465,758.404.09E+08 KY0076732 Centerfield Elementary 2400.0154722924,465,758.409.08E+07 KYG400289 Gibson Residence 2400.00061889224,465,758.403.63E+06 Total subwatershed SWS-WLA 1.68E+09 South Fork Currys Fork 0.0 to 6.1
 Facility Design Capacity (cfs) Conversion Factor (1/day) SWS-WLA (E. coli colonies/day KY Green Valley Apartments ,465, E+08 KY Lakewood Valley ,465, E+08 KY Lockwood Estates Subdivision ,465, E+08 KY Centerfield Elementary ,465, E+07 KYG Gibson Residence ,465, E+06 Total subwatershed SWS-WLA 1.68E+09 South Fork Currys Fork 0.0 to 6.1.")
38
Remainder Remainder = TMDL – MOS – ∑SWS-WLA South Fork Currys Fork 0.0 to 6.1 Remainder = 1.59E+11 - 1.59E+10 - 1.68E+09 Remainder = 1.42E+11 E. coli (colonies/day)
.")
39
MS4-WLA MS4-WLA = # Acres of Developed Land in MS4 ÷ # Acres in Subwatershed x Remainder For South Fork Currys Fork 0.0 to 6.1 754 acres of developed land in the MS4 5948.52 acres in the subwatershed Remainder = 1.42E+11 E. coli (colonies/day) South Fork Currys Fork 0.0 to 6.1 MS4-WLA = 754 ÷ 5948.52 x 1.42E+11 MS4-WLA = 1.80E+10 E. coli (colonies/day)
 South Fork Currys Fork 0.0 to 6.1 MS4-WLA = 754 ÷ x 1.42E+11 MS4-WLA = 1.80E+10 E. coli (colonies/day).")
40
Future Growth WLA Percent Developed Area in the Subwatershed Future Growth WLA Percentage ≥25%5% ≥20% – <25%4% ≥15% – <20%3% ≥10% – <15%2% ≥5% – <10%1% <5%0.5% Future Growth-WLA = Future Growth WLA Percentage x Remainder South Fork Currys Fork 0.0 to 6.1 754 acres of developed land 5948.52 acres of land in the subwatershed. Percent Developed Area = 12.68 (754 ÷ 5948.52 = 12.68%) Future Growth WLA Percentage = 2%, Remainder = 1.42E+11 Future Growth-WLA = 2% x 1.42E+11 E. coli (colonies/day) Future Growth-WLA = 2.83E+09 E. coli (colonies/day)
 Future Growth WLA Percentage = 2%, Remainder = 1.42E+11 Future Growth-WLA = 2% x 1.42E+11 E. coli (colonies/day) Future Growth-WLA = 2.83E+09 E. coli (colonies/day).")
41
LA ∑LA = TMDL - MOS - ∑WLA South Fork Currys Fork 0.0 to 6.1 TMDL = 1.59E+11 MOS = 1.59E+10 ∑ SWS-WLA = 1.68E+09 MS4-WLA = 1.80E+10 Future Growth-WLA = 2.83E + 09 ∑WLA =2.25E+10 ∑LA= 1.59E+11 – 1.59E+10 – 2.25E+10 ∑LA= 1.21E+11

42
The TMDLs and Allocations E. coli PCR Fecal coliform PCR Fecal coliform SCR

43
E. Coli PCR TMDLs Waterbody Name TMDL (colonies/ day) MOS (colonies/ day) SWS-WLA (colonies/ day) Future Growth- WLA (colonies/day) MS4-WLA (colonies/day) LA (colonies/ day) Asher Run 0.0 to 4.8 5.71E+105.71E+090.05.14E+084.79E+094.61E+10 Cane Run 0.0 to 7.3 4.67E+104.67E+094.54E+062.10E+087.82E+084.11E+10 Cedar Creek 4.3 to 11.1 1.44E+121.44E+116.83E+106.16E+104.17E+117.53E+11 Chenoweth Run 0.0 to 5.25 2.43E+122.43E+113.86E+101.07E+118.55E+111.19E+12 Chenoweth Run 5.25 to 9.2 4.09E+114.09E+103.63E+101.66E+102.48E+116.74E+10 Currys Fork 0.0 to 4.8 4.91E+114.91E+102.07E+101.26E+106.82E+103.41E+11 Floyds Fork 0.0 to 11.7 4.33E+134.33E+122.27E+111.16E+126.50E+123.11E+13 Floyds Fork 11.7 to 24.2 3.38E+133.38E+121.34E+116.05E+113.83E+122.58E+13 Floyds Fork 24.2 to 34.1 2.00E+132.00E+129.41E+103.59E+111.88E+121.57E+13 Floyds Fork 34.1 to 61.9 1.74E+131.74E+129.40E+103.12E+112.12E+121.32E+13 Long Run 0.0 to 10.0 5.52E+105.52E+098.18E+062.48E+081.14E+094.83E+10 North Fork Currys Fork 0.0 to 6.0 1.78E+111.78E+101.85E+105.67E+093.51E+101.01E+11 Pennsylvania Run 0.0 to 3.3 8.20E+098.20E+081.87E+092.76E+081.85E+093.39E+09 Pope Lick Creek 0.0 to 2.1 3.18E+113.18E+103.63E+071.43E+107.32E+101.99E+11 Pope Lick Creek 2.1 to 5.5 5.36E+115.36E+101.82E+072.41E+101.81E+112.77E+11 South Fork Currys Fork 0.0 to 6.1 1.59E+111.59E+101.68E+092.83E+091.80E+101.21E+11 South Long Run 0.0 to 3.35 2.63E+092.63E+080.02.37E+074.57E+072.30E+09 UT to South Fork Currys Fork 0.0 to 1.8 1.18E+111.18E+100.01.06E+096.57E+099.86E+10
 MOS (colonies/ day) SWS-WLA (colonies/ day) Future Growth- WLA (colonies/day) MS4-WLA (colonies/day) LA (colonies/ day) Asher Run 0.0 to E E E E E+10 Cane Run 0.0 to E E E E E E+10 Cedar Creek 4.3 to E E E E E E+11 Chenoweth Run 0.0 to E E E E E E+12 Chenoweth Run 5.25 to E E E E E E+10 Currys Fork 0.0 to E E E E E E+11 Floyds Fork 0.0 to E E E E E E+13 Floyds Fork 11.7 to E E E E E E+13 Floyds Fork 24.2 to E E E E E E+13 Floyds Fork 34.1 to E E E E E E+13 Long Run 0.0 to E E E E E E+10 North Fork Currys Fork 0.0 to E E E E E E+11 Pennsylvania Run 0.0 to E E E E E E+09 Pope Lick Creek 0.0 to E E E E E E+11 Pope Lick Creek 2.1 to E E E E E E+11 South Fork Currys Fork 0.0 to E E E E E E+11 South Long Run 0.0 to E E E E E+09 UT to South Fork Currys Fork 0.0 to E E E E E+10.")
44
Fecal Coliform PCR TMDLs Waterbody Name TMDL (colonies/ day) MOS (colonies/ day) SWS-WLA (colonies /day) Future Growth- WLA (colonies/ day) MS4-WLA (colonies/ day) LA (colonies/ day) Asher Run 0.0 to 4.82.41E+092.41E+0802.17E+072.02E+081.95E+09 Cedar Creek 4.3 to 11.12.23E+112.23E+101.14E+114.35E+092.95E+105.32E+10 Chenoweth Run 0.0 to 5.253.80E+113.80E+106.43E+101.39E+101.11E+111.54E+11 Chenoweth Run 5.25 to 9.21.41E+121.41E+116.06E+10 9.05E+112.46E+11
 MOS (colonies/ day) SWS-WLA (colonies /day) Future Growth- WLA (colonies/ day) MS4-WLA (colonies/ day) LA (colonies/ day) Asher Run 0.0 to E E E E E+09 Cedar Creek 4.3 to E E E E E E+10 Chenoweth Run 0.0 to E E E E E E+11 Chenoweth Run 5.25 to E E E E E+11")
45
Fecal Coliform SCR TMDLs Waterbody Name TMDL (colonies/ day) MOS (colonies/ day) SWS-WLA (colonies/ day) Future Growth- WLA (colonies/ day) MS4- WLA (colonies/ day) LA (colonies/ day) Chenoweth Run 0.0 to 5.253.17E+123.17E+116.43E+101.39E+111.11E+121.54E+12 Chenoweth Run 5.25 to 9.27.07E+127.07E+116.06E+103.15E+114.71E+121.28E+12 Floyds Fork 34.1 to 61.91.46E+121.46E+111.57E+112.32E+101.58E+119.79E+11 Pennsylvania Run 0.0 to 3.39.20E+129.20E+113.12E+094.14E+112.77E+125.09E+12
 MOS (colonies/ day) SWS-WLA (colonies/ day) Future Growth- WLA (colonies/ day) MS4- WLA (colonies/ day) LA (colonies/ day) Chenoweth Run 0.0 to E E E E E E+12 Chenoweth Run 5.25 to E E E E E E+12 Floyds Fork 34.1 to E E E E E E+11 Pennsylvania Run 0.0 to E E E E E E+12")
46
Vote TAC review/comments prior to public notice TAC review/comments concurrent with public notice

47
Contact Information Andrea M. Fredenburg TMDL Section Division of Water 200 Fair Oaks Lane Frankfort, KY 40601 Andrea.Fredenburg@ky.gov

Similar presentations


 (GP-0-10-002)>")