Download presentation
Presentation is loading. Please wait.

1
Route 1 Project Study Report Overview

2
A report that describes the transportation problem and identifies the project scope, schedule and estimated cost so that the project can be programmed for environmental studies.

3
Two PSRs Developed (1) Widening with Interchange Modifications (2) Auxiliary Lanes with Ramp Metering
 Widening with Interchange Modifications (2) Auxiliary Lanes with Ramp Metering")
4
Range of Alternatives Widening for High Occupancy Vehicles (HOV) Widening for Mixed Flow Vehicles Widening for High Occupancy Toll (HOT) Interchange/Ramp Improvements Auxiliary Lanes at Various Locations Ramp Metering (with all build alternatives) No Build
 Widening for Mixed Flow Vehicles Widening for High Occupancy Toll (HOT) Interchange/Ramp Improvements Auxiliary Lanes at Various Locations Ramp Metering (with all build alternatives) No Build")
5
Project Purpose To facilitate more efficient and safe operations of Route 1 as measured by congestion, travel times, mobility and accidents. To discourage reliance on single-occupant vehicle travel by improving travel conditions and interconnectivity for transit and high occupancy vehicles. To maximize the utility of any additional capacity that is created.

6
Presentation Team Rich KrumholzTransportation Planner Claudia Espino Senior Design Engineer Scott EadesTransportation Engineer Luis Duazo Project Manager

7
PROJECT LOCATION MAP

8
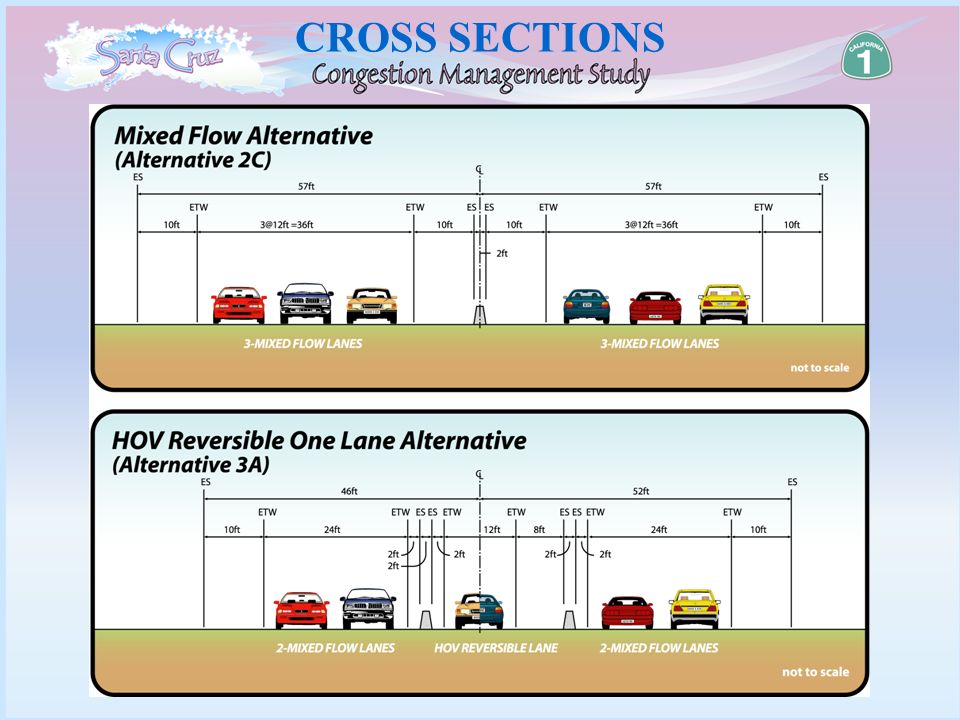
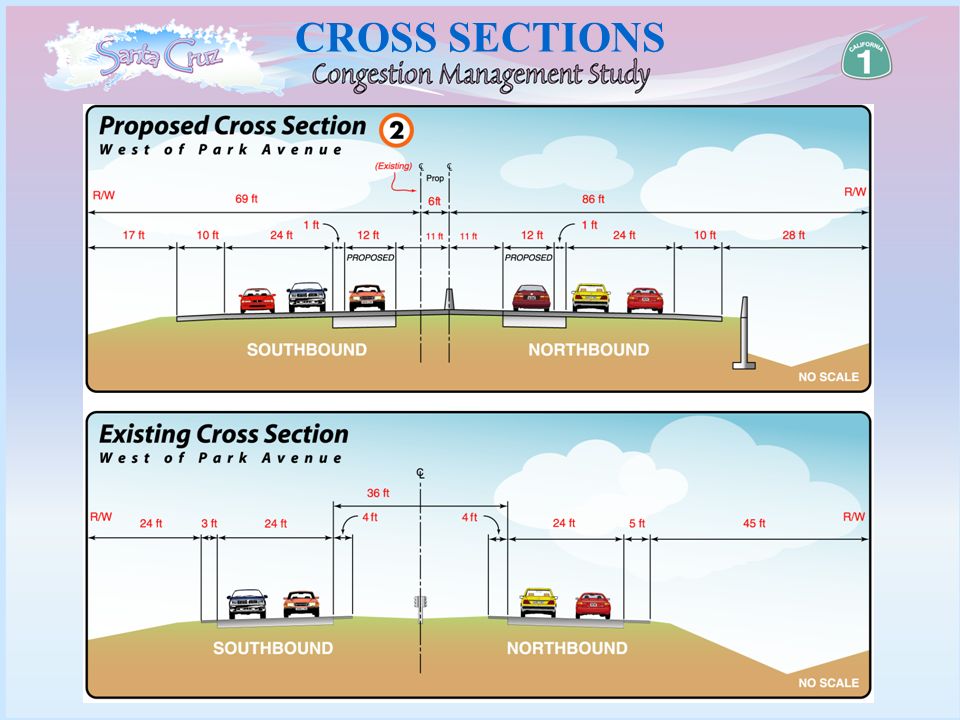
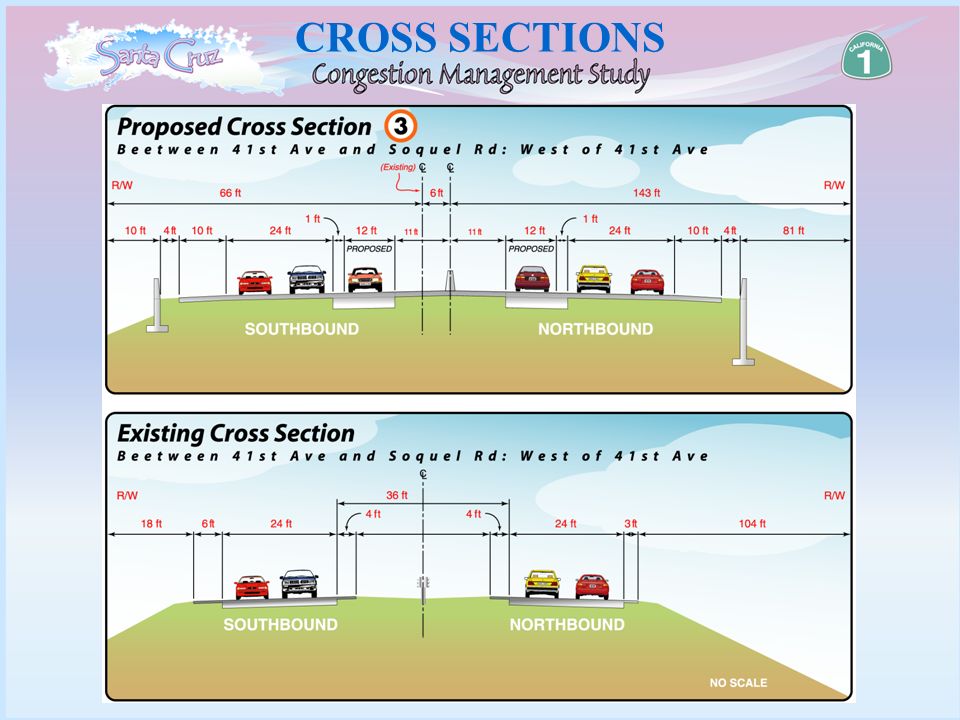
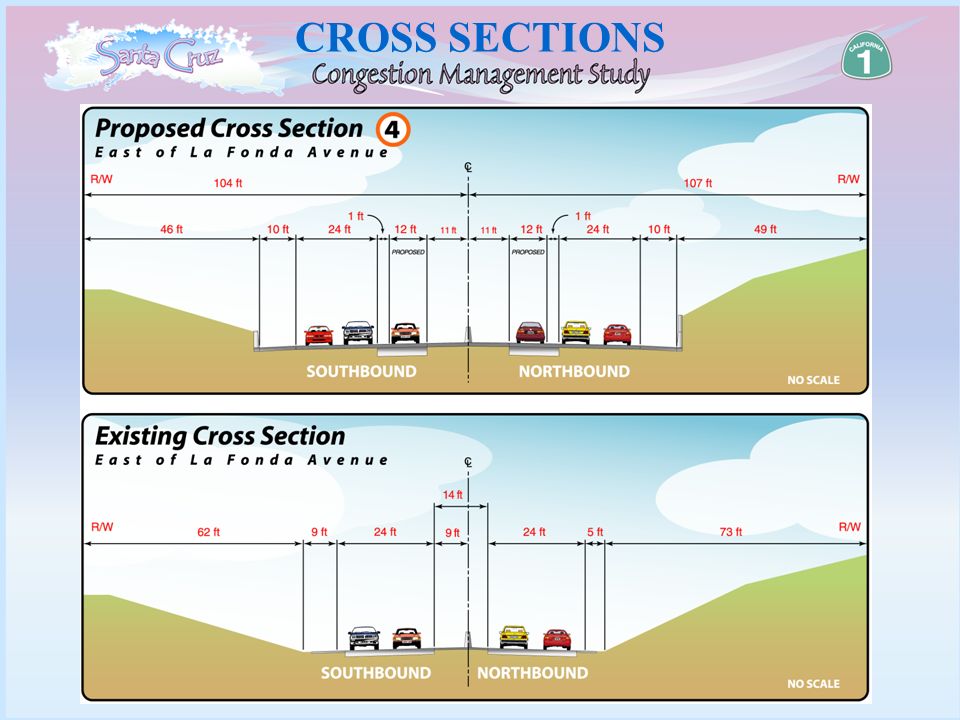
CROSS SECTIONS

10
CROSS SECTION LOCATIONS

11
CROSS SECTIONS

15
AUXILIARY LANE LOCATIONS

16
PEDESTRIAN OVERCROSSING LOCATIONS

17
On Route 1 Northbound at Morrissey On Ramp

18
On Route 1 Southbound at Morrissey Off Ramp

19
41st and Bay

20
On Route 1 Northbound at State Park On Ramp

21
On Route 1 Southbound at State Park On Ramp

22
Traffic Analysis

23
FREQ Output: 06 miles Northbound AM: Existing Configuration

24
6:00 7:00 8:00 9:00 11:00 10:00 Timeslices (each =15 minutes) Subsections (Freeway segments) Sample FREQ Output - Northbound Direction of travel Time Period = 5 hrs, 45 min. Timeslice 1 ------> Timeslice 2 ------> Timeslice 3 ------>. Green = Uncongested flow (v/c < 0.9), 60+ MPH Blue = Near Capacity (0.9 < v/c < 1.0), 50 + MPH Yellow = At Capacity (v/c = 1), Represents bottleneck location Orange = Congested Flow - Resulting from upstream bottleneck, typically 0-35 MPH Legend Rte 17 off NBMorrissey Blvd41st AveBay/Porter Ave Soquel Ave Park Ave State Park DrRio Del MarFreedom BlvdMar MonteLarkin ValleyBuena Vista
, 60+ MPH Blue = Near Capacity (0.9 < v/c < 1.0), 50 + MPH Yellow = At Capacity (v/c = 1), Represents bottleneck location Orange = Congested Flow - Resulting from upstream bottleneck, typically 0-35 MPH Legend Rte 17 off NBMorrissey Blvd41st AveBay/Porter Ave Soquel Ave Park Ave State Park DrRio Del MarFreedom BlvdMar MonteLarkin ValleyBuena Vista.")
25
No-Build Green = Uncongested (v/c < 0.9) Blue = Near Capacity (0.9 < v/c < 1.0) Yellow = At Capacity (v/c = 1) Orange = Congested Flow Ramp Meter (4-Lane) Auxiliary Lane 6-Lane Mixed Flow Northbound AM Existing Conditions (2001) HOV (Mixed Flow Lanes) Alternatives Analysis (with 2020 Volumes)
 Blue = Near Capacity (0.9 < v/c < 1.0) Yellow = At Capacity (v/c = 1) Orange = Congested Flow Ramp Meter (4-Lane) Auxiliary Lane 6-Lane Mixed Flow Northbound AM Existing Conditions (2001) HOV (Mixed Flow Lanes) Alternatives Analysis (with 2020 Volumes)")
26
Northbound AM 2020 volumes2001 *during the 6 hour peak period (6am-Noon) * 2020 volumes2001 2020 volumes2001
 * 2020 volumes volumes2001")
27
2020 No-Build Green = Uncongested (v/c < 0.9) Blue = Near Capacity (0.9 < v/c < 1.0) Yellow = At Capacity (v/c = 1) Orange = Congested Flow Ramp Meter (4-Lane) Auxiliary Lane 6-Lane Mixed Flow Northbound PM Existing Conditions (2001) HOV (Mixed Flow Lanes) Alternatives Analysis (with 2020 Volumes)
 Blue = Near Capacity (0.9 < v/c < 1.0) Yellow = At Capacity (v/c = 1) Orange = Congested Flow Ramp Meter (4-Lane) Auxiliary Lane 6-Lane Mixed Flow Northbound PM Existing Conditions (2001) HOV (Mixed Flow Lanes) Alternatives Analysis (with 2020 Volumes)")
28
Northbound PM 2020 volumes20012020 volumes2001 * * * 2020 volumes2001 2020 volumes2001 *during the 6 hour peak period (2pm-8pm)
")
29
Green = Uncongested flow Blue = Near Capacity Yellow = At Capacity Orange = Congested Flow Legend Sample FREQ Output - Southbound Yellow = At Capacity Orange = Congested Flow Green = Uncongested flow Blue = Near Capacity 2:00 3:00 4:00 5:00 7:00 6:00 Rte 17 on SBMorrissey Blvd41st AveBay/Porter AveSoquel AvePark AveState Park DrRio Del MarFreedom BlvdLarkin ValleyOcean St Direction of travel ----- Timeslice 1 ------> ----- Timeslice 2 ------> ----- Timeslice 3 ------>. Scale

30
No-Build Green = Uncongested (v/c < 0.9) Blue = Near Capacity (0.9 < v/c < 1.0) Yellow = At Capacity (v/c = 1) Orange = Congested Flow Ramp Meter (4-Lane) Auxiliary Lane 6-Lane Mixed Flow* Southbound PM - With widening to State Park Drive Existing Conditions (2001) HOV ( Mixed Flow Lanes) * Alternatives Analysis (with 2020 Volumes) *Extended only to State Park Drive
 Blue = Near Capacity (0.9 < v/c < 1.0) Yellow = At Capacity (v/c = 1) Orange = Congested Flow Ramp Meter (4-Lane) Auxiliary Lane 6-Lane Mixed Flow* Southbound PM - With widening to State Park Drive Existing Conditions (2001) HOV ( Mixed Flow Lanes) * Alternatives Analysis (with 2020 Volumes) *Extended only to State Park Drive")
31
Southbound PM 2020 volumes 2001 **during the 6 hour peak period (2pm-8pm) 2020 volumes 2001 ** *Additional lane terminates at State Park Drive * * * * * * 2020 volumes2001
 2020 volumes 2001 ** *Additional lane terminates at State Park Drive * * * * * * 2020 volumes2001")
32
2020 No-Build Green = Uncongested (v/c < 0.9) Blue = Near Capacity (0.9 < v/c < 1.0) Yellow = At Capacity (v/c = 1) Orange = Congested Flow Ramp Meter (4-Lane) Auxiliary Lane 6-Lane Mixed Flow* Southbound PM - With widening to Larkin Valley/San Andreas Existing Conditions (2001) HOV (Mixed Flow Lanes)* Alternatives Analysis (with 2020 Volumes) *Extended to Larkin Valley Road
 Blue = Near Capacity (0.9 < v/c < 1.0) Yellow = At Capacity (v/c = 1) Orange = Congested Flow Ramp Meter (4-Lane) Auxiliary Lane 6-Lane Mixed Flow* Southbound PM - With widening to Larkin Valley/San Andreas Existing Conditions (2001) HOV (Mixed Flow Lanes)* Alternatives Analysis (with 2020 Volumes) *Extended to Larkin Valley Road")
33
Southbound PM 2020 volumes20012020 volumes2001 ** *Extended to Larkin Valley/San Andreas * * ** * * 2020 volumes2001 **during the 6 hour peak period (2pm-8pm)
")
Similar presentations


. ITS Produce Data The (sensor) data are used for to help take transportation management actions –Traffic control systems.>")


