Download presentation
Presentation is loading. Please wait.

1
APES 9/14-9/15 No Warm-Up! Log in to a netbook
Please put your age structure diagram for your chosen country by the matching table tent. #2 on worksheet- change Japan to France Rotate through stations looking at the diagrams and then answer the remaining discussion questions.

2
Due Dates, etc. FYI- Unit Test will be on 22nd (blue) and 23rd (gold)
Ch. 7 Reading Assignment due 21st (gold) and 22nd (blue) Blue days- have at least read the chapter and done the multiple choice for Friday the 18th
 and 22nd (blue) Blue days- have at least read the chapter and done the multiple choice for Friday the 18th.")
3
Learning Target I can describe the 4 stages of Demographic Transition and explain why they correlate to a certain age structure diagram.

4
7.2 Billion: How did we get here?
Cool animation of growth world wide /visualizing-how-a-population- grows-to-7-billion

5
Human Population Growth Historically
Early Hunter Gatherers Nomadic, with a strong sense of the earth Practiced intentional birth control Rise of Agriculture Necessary for Survival Animals became extinct via predation and altered habitat Humans began to cultivate own food

6
Human Population Growth Historically
C. Agriculture Gives Rise to Cities Food produced in country, consumed in city Food wastes are no longer returned to soil Soil becomes less productive Waste of populations concentrated in cities Population control in medieval societies Infanticide Plagues

7
Human Population Growth Historically
D. Industrialization Children valued as cheap source of income and cheap labor Exponential growth of populations By 1900s, Birth Rate in Industrialized World Dropped Rise in standards of living Safe and inexpensive means of birth control introduced Increase in the cost of child rearing

8
Increasing our Carrying Capacity
Technology has allowed us to raise Earth’s carrying capacity for our species time and again. Tool-making, agriculture, and industrialization each enabled humans to sustain greater populations.

10
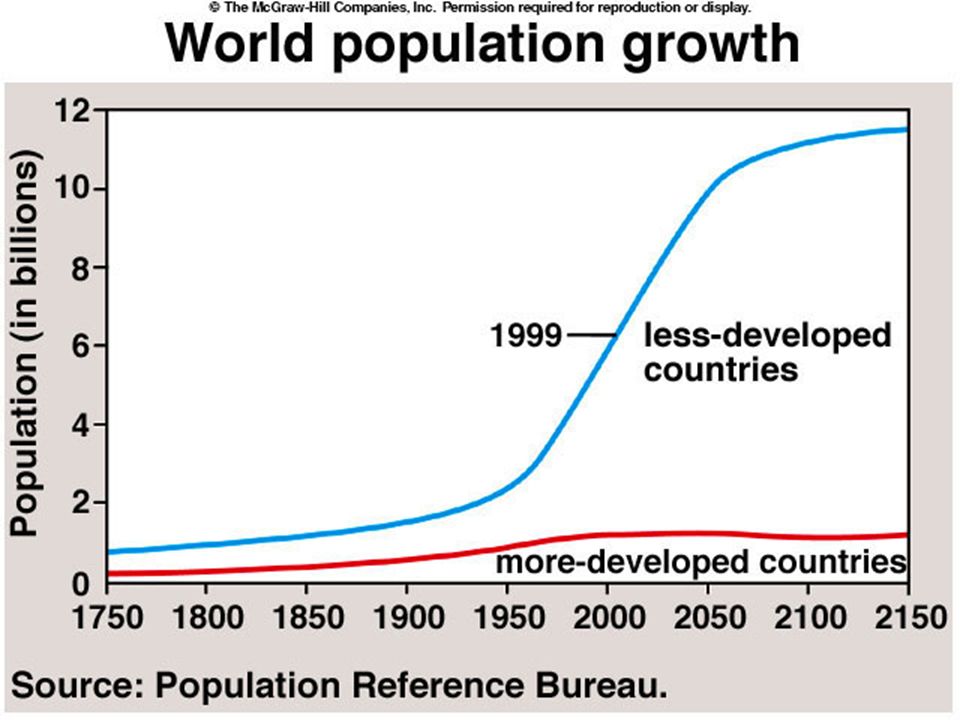
Population Projections
Over 95% of this increase will take place in “Developing Countries”

13
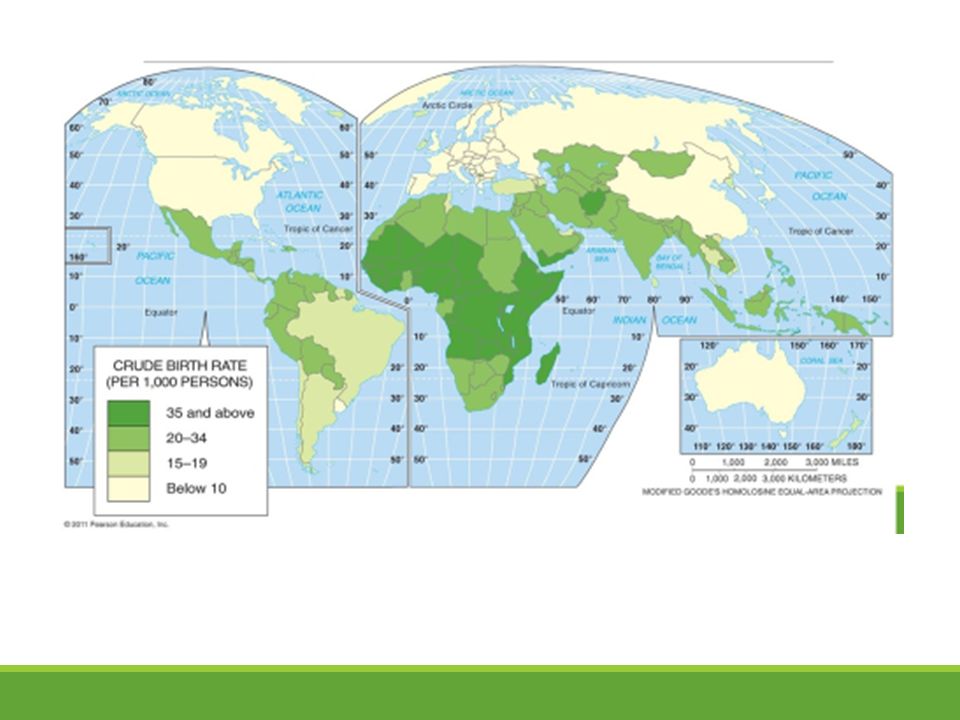
Patterns in developed vs. developing countries

14
Demographic Transition
Movement of a nation from high to low pop. growth as it develops economically: Stage 1—Birth and death rates are both high Stage 2—Death rates fall; birth rates remain high; growth rate rises Stage 3—Birth rates fall as standard of living rises; growth rate falls Stage 4—Growth rate continues to fall to zero or to a negative rate

15
Demographic Transition: Stages

16
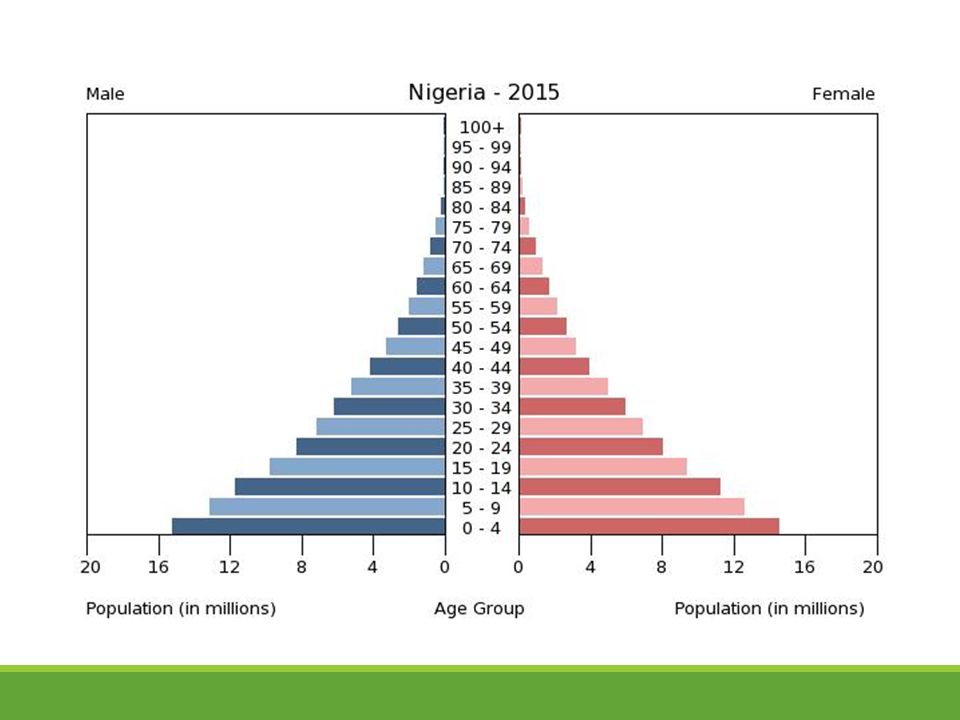
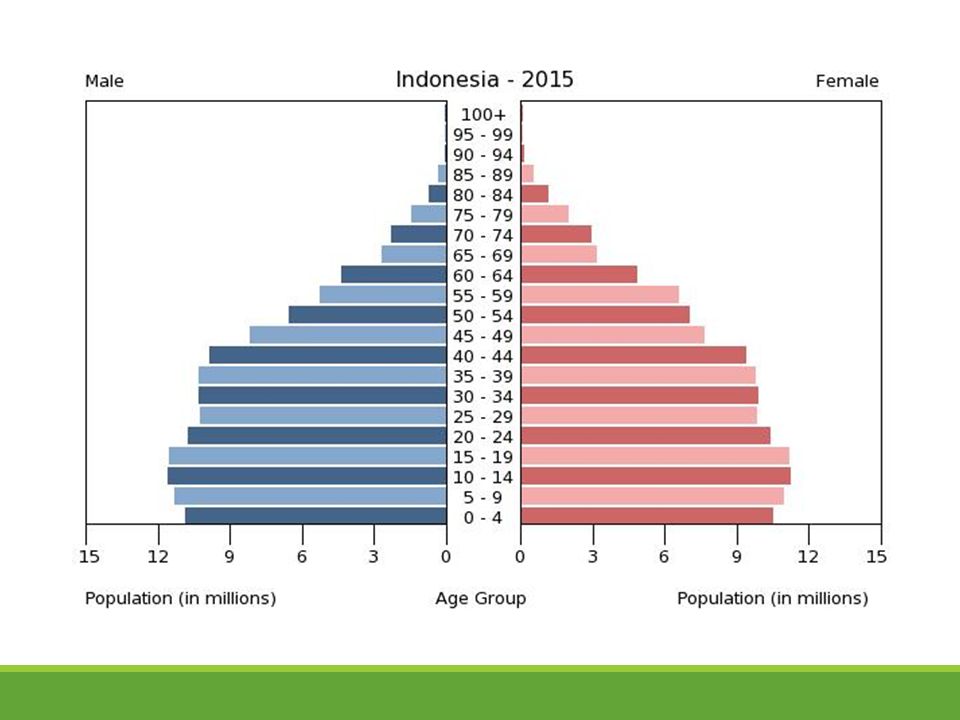
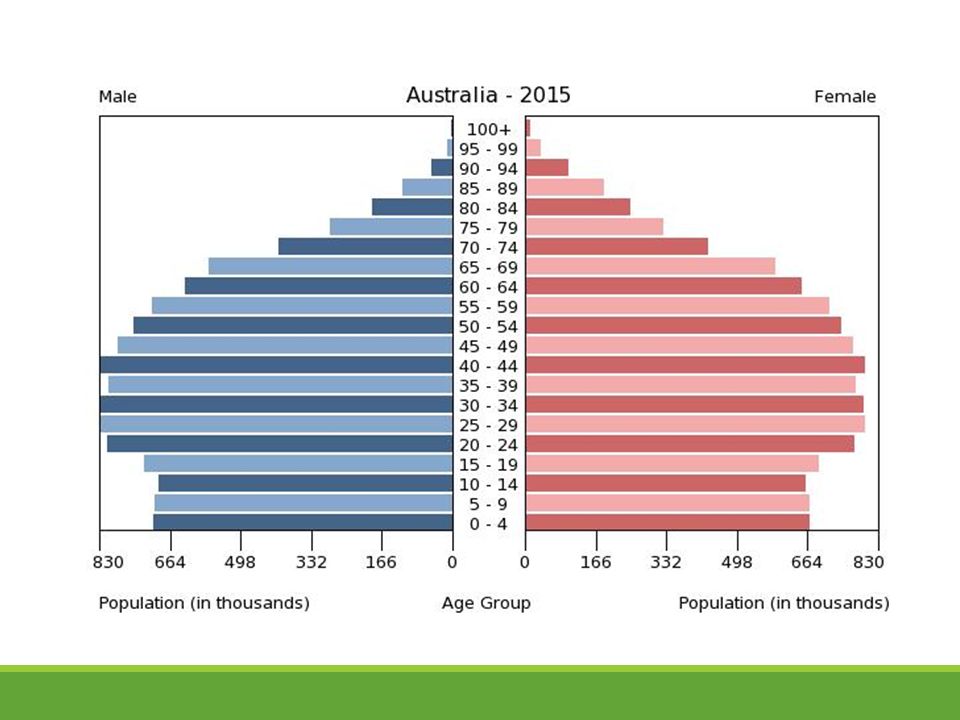
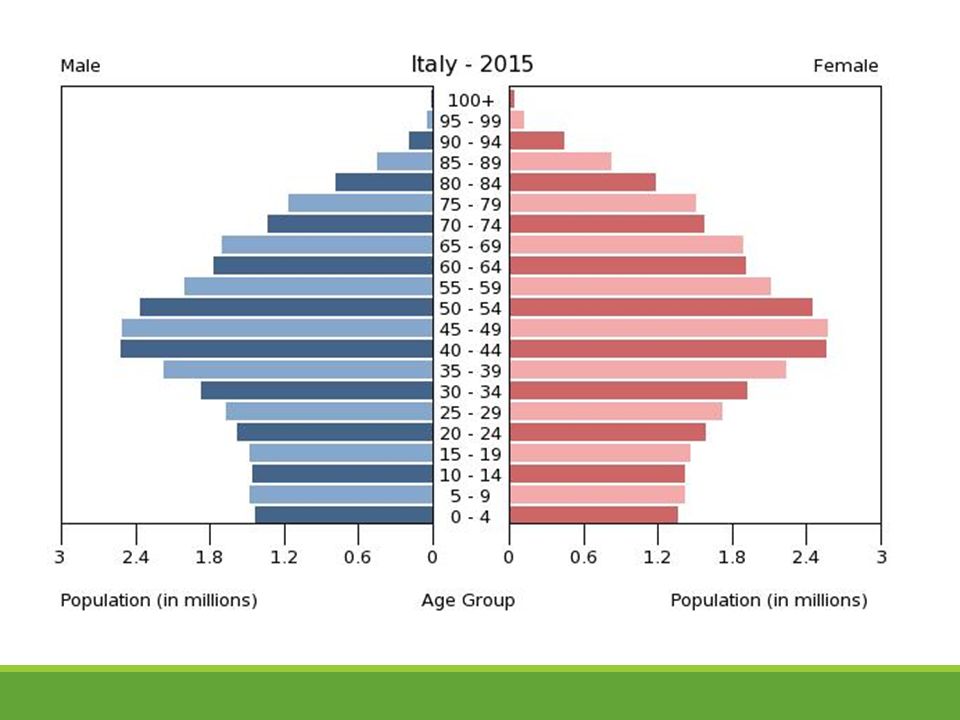
Pop. Pyramids at Diff. Stages

17
Stage 1 High birth rates, high (at times erratic) death rates, low growth rates Stage for much of human history No current countries

18
Stage 2 High birth rates, declining death rates, rising growth rates
Improvements in sanitation (water) and medicine In U.S., Europe during Industrial Revolution In developing countries since the 50s/60s Much of Africa today, some countries of Asia (Afghanistan, Nepal, etc.)
 and medicine. In U.S., Europe during. Industrial Revolution. In developing countries since the 50s/60s. Much of Africa today, some countries of Asia (Afghanistan, Nepal, etc.)")
20
Demographic Trap Population Path of Most Less-Developed Countries
“Trapped” in Stage 2 Before 1970, these countries were poised to make transition thanks to economic growth Since 1970, econ. growth has not kept pace with population High birth and low death rates result in explosive population growth Downward spiral in standard of living

21
Demographic Fatigue Lack of $$$ and ability to deal with natural disasters and disease Possibility that countries suffering from demographic fatigues could slip back into Stage 1 of demographic transition

22
Stage 3 Continued decline of death rates, declining birth rates,
growth rates decline from high to lower levels Change in behavior: adaptation to lower death rate, in particular infant mortality rate Economic change: urbanization (incentive to have fewer children)
")
24
Stage 4 & 5 Stage 4: low birth rates, low death rates, low
growth rates United States today Stage 5: low birth rates, rising death rates, declining growth rates (if birth rates drop below death rates: negative growth rates) several countries of Europe today (Austria)
 several countries of Europe today (Austria)")
27
Effects of Population Decline
As percentage of 60+ aged people increases, population begins decline 60+population increase --> severe economic and social problems because 60+ consume more medical care Social Security costly public services Labor shortages require automation & immigration

28
Demographic Transition Activity
Due next time! Graph + pieces arranged in proper order and glued/taped down.

29
Exit Task 9/14 & 9/15 On the provided half-sheet:
Name: __________________ 1. What demographic Transition phase is Canada in? 2. Why does this phase result in this particular graph shape? (give at least two reasons).
.")
30
Where is the world in the Demographic Transition?
Stage 2! – There are many countries “stuck” Why does the world need to move forward? Factors that will influence this process… Empowerment of women Family planning programs Poverty HIV/AIDS Key is to get women to stop having so many babies – and to feel like they don’t need to have as many children

31
Human Population Dynamics
There are just three sources of change in population size — Fertility Mortality "natural decrease" refers to population decline resulting from more deaths than births Migration Net migration is the number of immigrants minus emigrants

32
TFR and RFR Total fertility rate (TFR)
The average number of children born to a woman Average in developed countries = 1.5 Average in developing countries = 3.8 Worldwide 1990: 3.1 Now: 2.5 Replacement fertility rate (RFR) The # of children a couple must have to replace themselves A TFR of 2.1 for developed countries with low infant and child mortality rates Africa RFR = 2.5
 The # of children a couple must have to replace themselves. A TFR of 2.1 for developed countries with low infant and child mortality rates. Africa RFR = 2.5.")
33
Falling growth rates doesn’t mean fewer people!
Falling rates of growth do not mean a decreasing population, but only that rates of increase are slowing

34
Female Education and TFR
Female literacy, school enrollment, and access to family planning are correlated with total fertility rate. In 2007, 54% of married women worldwide used contraception; China = 86%; the U.S. = 68%; 20 African nations < 10%

35
What Is Family Planning?
Blue = family planning accessible Red = family planning not accessible What Is Family Planning? Measures enabling parents to control number of children. Goals of Family Planning- healthy children that parents can care for; parents can have # children they desire.

36
The Int’l Conference on Pop. and Development
In 1994 Cairo, Egypt, 179 nations called on all governments to offer universal access to reproductive health care within 20 years Offer better education and health care and alleviate poverty, disease, and sexism Controversy in the U.S. Currently, GOP House of Reps. is working on legislation to limit Planned Parenthood Employers affiliated with religious orgs. have asked for exceptions to Affordable Care Act’s coverage of contraception (“Obamacare”)
")
37
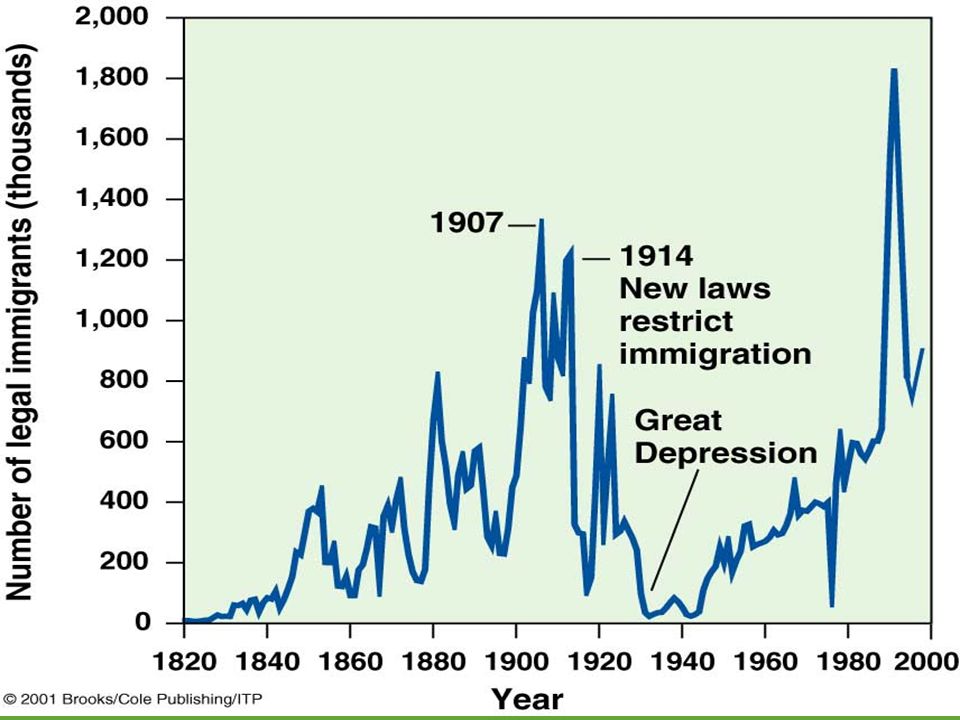
Influencing Population Size
Most countries restrict immigration Canada, Australia, U.S. - most immigration Involuntary immigration results from armed conflict environmental degradation natural disaster --> environmental refugees Migration from rural to urban areas

38
Nation With Best Known Population Control Program
China’s Program Nation With Best Known Population Control Program Reasons Chinese Government Initiated Population Control Measures Freshwater and food at a premium for nation’s population Country experiencing population momentum Government Perks / Coercive Measures for Citizen Compliance Free education and health care Increased personal and family incomes Increased legal marrying age for women Contraceptives, abortions, and sterilizations free of charge Preferential housing and retirement income

40
Rewards and Penalties to reduce births
What might work: encourage, rather than coerce, people to have fewer children reinforce existing customs and trends toward smaller families don’t penalize for already existing larger family increase poor family’s economic status

41
Case Studies - India Family planning efforts began in 1952; fertility rate declined from 5.3 to but population grow is still exponential -1.9% Disappointing results due to: poor planning bureaucratic inefficiency low status of women extreme poverty lack of administrative & financial support

42
Case Studies - China Family planning efforts began in 1970; TFR fell from 5.7 to 1.8; infant mortality and illiteracy rates 1/3 to 1/2 of India’s rates Population control program is extensive, intrusive and strict: postpone childbearing only one child/family -->benefits effect b/c China is dictatorship; limited resources would have mean disaster

43
Cutting Global Population Growth
U. N.Conference on Population and Development, Cairo, 1994 8 goals to be met by 2015 (p. 276) are these goals wishful thinking? Replacement level fertility can be met in years as shown by Japan, Thailand… Invest in family planning, reduce poverty, and elevate status of women
 are these goals wishful thinking Replacement level fertility can be met in years as shown by Japan, Thailand… Invest in family planning, reduce poverty, and elevate status of women.")
44
Population and the environment
Population growth can lead to environmental degradation. Overpopulation in Africa’s Sahel region has led to overgrazing of semi-arid lands. (China obviously also an ex.)
")
45
Affluence and the environment
Poverty can lead to environmental degradation… BUT wealth and resource consumption can produce even more severe and far- reaching environmental impacts.

46
The wealth gap Residents of developed nations have larger houses, more possessions, and more money than residents of developing nations. The richest 20% of the world’s people consumes 86% of its resources, and has > 80 times the income of the poorest 20%.

47
Food and Hunger 840 million people are hungry
799 million of those are in developing countries The other 40 million are in developed countries ½ of the US population relies on food stamps

48
Food and Hunger 1.2 billion are overweight
30% of the U.S. population is obese Why does this dichotomy exist? POVERTY

49
Poverty in Developing Nations
Trade imbalances exist between developed nations and developing nations. U.S. has outsourced production to these poverty-stricken nations. Many will work under terrible conditions and long hours because it is a better alternative to continued poverty.

50
Ecological Footprints
Environmental Impact Equation (Paul Ehrlich Formula) I = P x A x T I= Total Impact P= Population size A= Affluence T= Level of technology
 I = P x A x T. I= Total Impact. P= Population size. A= Affluence. T= Level of technology.")
51
Population growth affects the environment
The IPAT model: I = P x A x T x S Our total impact (I) on the environment results from the interaction of population (P), affluence (A) and technology (T), with an added sensitivity (S) factor Population = individuals need space and resources Affluence = greater per capita resource use Technology = increased exploitation of resources Sensitivity = how sensitive an area is to human pressure Further model refinements include education, laws, ethics Humanity uses 1/3 of all the Earth’s net primary production
 on the environment results from the interaction of population (P), affluence (A) and technology (T), with an added sensitivity (S) factor. Population = individuals need space and resources. Affluence = greater per capita resource use. Technology = increased exploitation of resources. Sensitivity = how sensitive an area is to human pressure. Further model refinements include education, laws, ethics. Humanity uses 1/3 of all the Earth’s net primary production.")
Similar presentations


 G. Tyler Miller’s.>")


 Population size (N) -ideal habitat -maximum reproduction -unlimited resources Increase often.>")


