Download presentation
Presentation is loading. Please wait.

1
Babies Count The National Registry for Children With Visual Impairments, Birth to 3 years Deborah Hatton, Ph.D. University of North Carolina Burt Boyer, M.A. American Printing House for the Blind February 25, 2005 Preliminary Data Analysis: Do not share without permission of authors

2
Model Registry of Early Childhood Visual Impairment Collaborative Group, 1995-2000 Tanni Anthony Diana Bramow Gail Calvello Kay Ferrell J Greeley Patrika Griego Deborah Hatton Creig Hoyt James Jan Mary Nelle McLennan Tom Miller Dennak Murphy Marianne Riggio Lee Robinson Joyce Nesker Simmons Julie Smith Chris Tompkins Hatton, D.D., & Model Registry of Early Childhood Visual Impairment Collaborative Group. (2001). Model Registry of Early Childhood Visual Impairment: First year results. Journal of Visual Impairment & Blindness, 95 (7), 418-433.
. Model Registry of Early Childhood Visual Impairment: First year results. Journal of Visual Impairment & Blindness, 95 (7),")
3
Purpose of National Registry Prevalence of visual impairment (VI) in children was not collected in a systematic or consistent manner Lack of data for children between Birth – 36 months Incidence rates of VI, as well as specific visual diagnoses, have important implications for: –Program development –Evaluation –Personnel preparation –In-service training, and –Funding
 in children was not collected in a systematic or consistent manner Lack of data for children between Birth – 36 months Incidence rates of VI, as well as specific visual diagnoses, have important implications for: –Program development –Evaluation –Personnel preparation –In-service training, and –Funding")
4
Impact of Project Establishes a centralized registry of children with visual impairments, birth to three. Provides a database to more clearly define the population. Allows for development of outcome research and stimulate studies by other professionals (e.g., education, medical, sociological). Assists personnel preparation programs to be more responsive to the needs of the field based upon numbers of children who are blind or VI, changing etiologies and geographical distribution of children.
. Assists personnel preparation programs to be more responsive to the needs of the field based upon numbers of children who are blind or VI, changing etiologies and geographical distribution of children..")
5
Impact of Project, Continued Assists with program development; assessment/evaluation; pre-service/in-service training; advocacy by professionals, parents, organizations; and validates funding for additional related programming. Provides APH with database to identify early trends in etiologies and demographics which will help give data and direction to APH for future research and product/materials development. Provides a natural transition from the centralized registry for children with VI, birth to three, to the Federal Quota Program.

6
Mission of Project To maintain a national registry of young children, ages birth to 36 months, by working with public and private agencies to collect standardized epidemiological and demographic data on young children with visual impairments. To insure that all data are coded to assure confidentiality of children and families.

7
Referral Sources N = 2,155 Data collected from 1/1/00 through 12/31/04 State N % Utah 38918.1 W Virginia 45 2.1 California 377 17.5 Arizona 44 2 Arizona 260 12.1Maryland 381.8 MA 24511.4Kentucky 31 1.4 Colorado 22210.3Vermont 23 1.1 NC 137 6.4Missouri 18.8 New Mexico 122 5.7Iowa 16.7 Illinois 97 4.5MS 14.7 Ohio 49 2.3Other 28 1.3 Total 2,155

8
Present Status of Referral Sources Surveys now collected from 29 states (initially 17) 4,200 children are presently registered August 2007 article release by Dr. Paul J. Rychwalski and Dr. Debra Hatton in the Journal of the American Association for Pediatric Ophthalmology and Strabimus (JAAPOS) Next data analysis is due January/February 2008
 Next data analysis is due January/February")
9
Demographics N = 2,155 Gender Family Status

10
Ethnicity N=2,155 4% 1%

11
Primary Language N=2,155 78% 15% 6%

12
Children’s Ages (Months)
")
13
Mothers’ Characteristics

14
Visual Conditions N = 2,152

15
Amount of Vision N =2,155

16
Multiple Disability Risk Status N = 2,155

17
Visual Conditions: Six Most Prevalent in Sample N =1,943 90.2% of Sample (2,155) 26% 18% 11% 6% 5.5%
 26% 18% 11% 6% 5.5%")
18
Age and Visual Condition Mean Age in Months N = 1,943

20
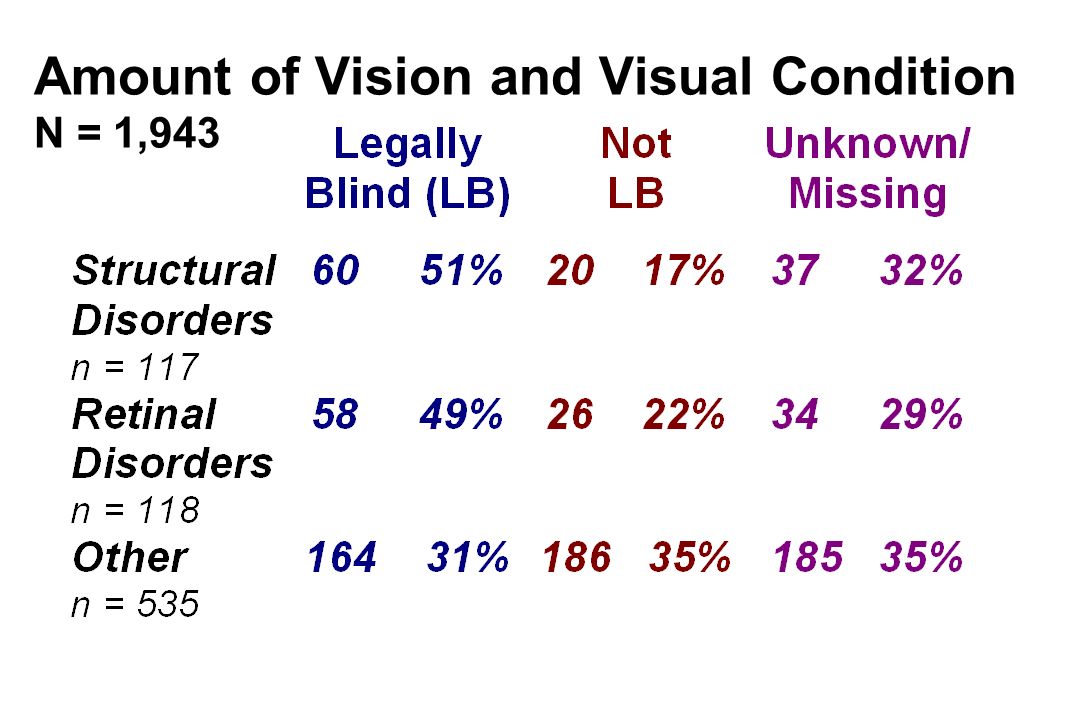
Amount of Vision and Visual Condition N = 1,943

22
“Other” Visual Conditions 30% 19.5% 16% 9.5% 2% 1%

23
Disabling Conditions N = 2,155 50% 20% 16%14%

24
Disabling Conditions and Visual Conditions N =1,943 46%21%

25
Multiple Disability Risk Status and Visual Condition N = 1,943

27
Health Conditions Number of Children 21% 15% 14%

28
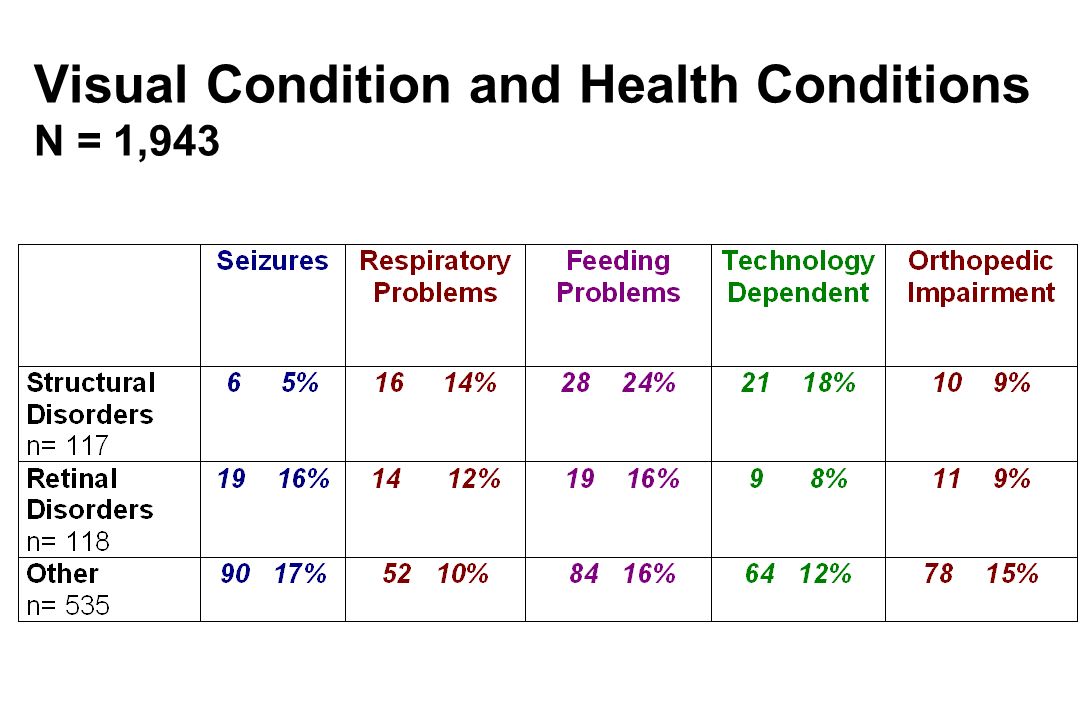
Visual Condition and Health Conditions N = 1,943

30
Amount of Vision N =2,155

31
Determining Visual Acuity

32
Corrective and Prosthetic Devices N = 2,155 Yes No Glasses 437 (20%)1,718 (80%) Contacts44 (2%)2,111 (98%) Prostheses45 (2%)2,110 (98%)
1,718 (80%) Contacts44 (2%)2,111 (98%) Prostheses45 (2%)2,110 (98%)")
33
Prevalent Visual Behaviors 20% 19%17% 25% 44% Number of children 15% 8%

34
Functional Vision: Awareness Proportion who are visually AWARE of

35
Functional Vision: Attention Proportion who visually ATTEND to

36
Functional Vision: Following Proportion who visually FOLLOW

37
Referral Sources N = 2,155 Number of Children

38
Service Description Direct VI Services 1,777 (82%) Consultative VI Services 470 (22%)
 Consultative VI Services 470 (22%)")
39
Service Providers Certified VI Teacher 938 (60%) Orientation/Mobility 153 (10%) Specialist Non-Certified VI Specialist169(11%) Early Interventionist140 (9%) Other 438 (27%)
 Orientation/Mobility 153 (10%) Specialist Non-Certified VI Specialist169(11%) Early Interventionist140 (9%) Other 438 (27%)")
40
Early Intervention: Location of Services N = 2,155 86%

Similar presentations


 Tamara Halle, Nicole Forry, Elizabeth Hair & Kate Perper.>")

 Presentation to 3rd International Conference.>")

 2003 Allyn & Bacon Teaching Exceptional, Diverse and At- Risk Students in the General Education Classroom Third Edition Sharon Vaughn Candace.>")

