Download presentation
Presentation is loading. Please wait.

1
9th Seminar Unit2 Population

2
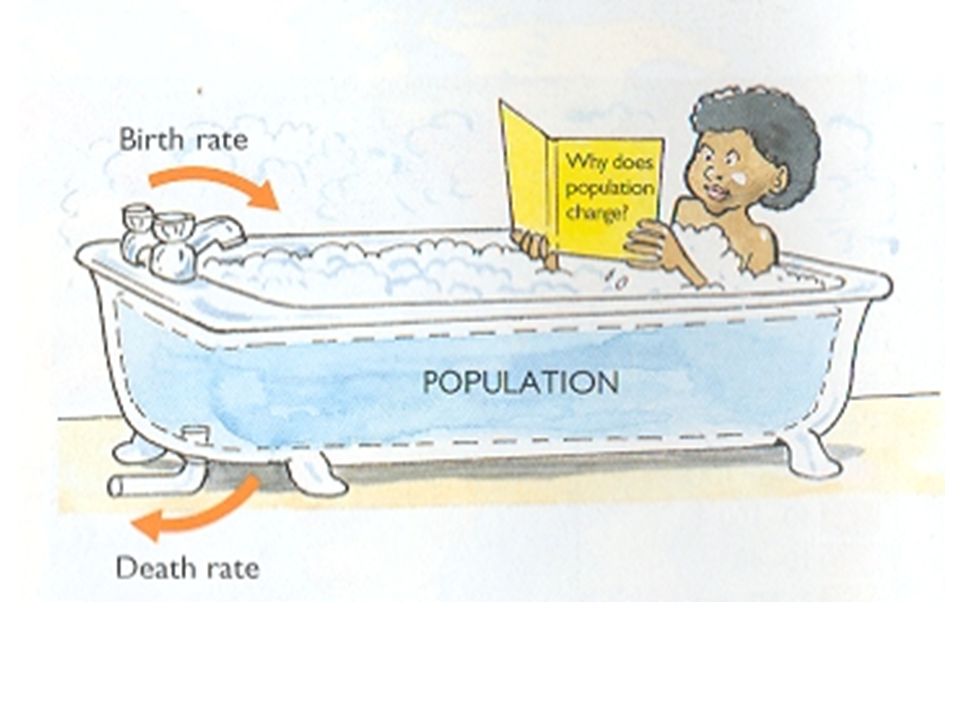
What does population mean?

3
Population Learning Objective To identify what population means and the impact on the World. -All pupils to identify what population means. -Most pupils can state how population can change. -Some pupils can start to identify what might influence population.

4
What 3 questions would you like to answer from the graph.
1. Annotate (label) the graph with description of what has/is happening. 2. Now suggest why you think it has happened. What 3 questions would you like to answer from the graph.
 the graph with description of what has/is happening. 2. Now suggest why you think it has happened. What 3 questions would you like to answer from the graph.")
5
The World Population What is the World’s Population?
Is the World’s population increasing or decreasing? Draw a cartoon to describe the change in the World’s population.

6
What does Population have to do with Geography?

7
What is the population of the US?
Research either on the Internet or through books: What is the population of the US? Bring it in for next lesson Make sure you note when this figure was from & where you got the information from.

8
Population Learning Objective To identify what population means and the impact on the World. -All pupils to identify what population means. -Most pupils can state how population can change. -Some pupils can start to identify what might influence population.

9
How many people live here?

10
Population Change Learning Objective
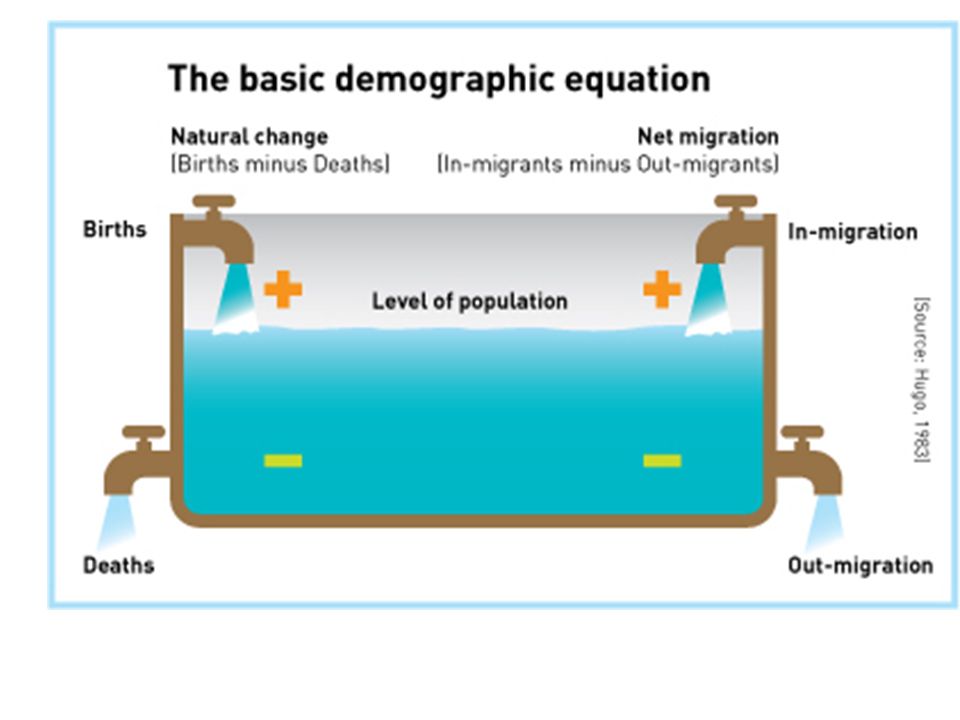
To identify what natural change is and the factors that influence it. All pupils to identify what birth and death rate mean. Most pupils can state a reason why the birth and death rate may increase and decrease.

13
Create your own image to explain the Natural change in Population

14
What influences Population?
Birth Rate Find a Definition Design a symbol to represent Birth Rate Death Rate Find a Definition Design a symbol to represent Death Rate

15
What changes Birth and death rate?
Does it increase or decrease the birth or death rate? Use symbols How does it change it? Better Healthcare A terrible war Clean water is available More women working More healthy food is available Deadly disease spreads Birth control is provided 1. 2.

16
Think about the US’s population........
Do you think the population is increasing or decreasing? (Remember: to gain the higher levels, you need to explain Why, How and use examples!)
")
17
Do you think the population is increasing or decreasing??

18
Population Change Learning Objective
To identify what natural change is and the factors that influence it. All pupils to identify what birth and death rate mean. Most pupils can state a reason why the birth and death rate may increase and decrease.

19
Unscramble the Words E A T H D B R T H I P P L U O A T I O N
H U N A M S

20
Population Density Learning Objective
To learn why some places are densely populated whilst others are sparsely populated. All pupils to define what densely and sparsely populated mean. Most pupils can identify reasons why people do or do not want to live in a place. Some pupils can identify places where there are high or low populations

21
Why are some places really crowded and others not?

22
Population density = Number of people/Area(km2)
What’s the density? Some areas of the world are more populated than others. We use population density as a measure of how many people live in a set area. Population density is measured in people per square kilometre (km2). Population density = Number of people/Area(km2) Photo credit: ©2008 JupiterImages Corporation India has a population of 1,103,371,000 and covers 3,287,263km2. The population density of India is 336.
. Population density = Number of people/Area(km2) Photo credit: ©2008 JupiterImages Corporation. India has a population of 1,103,371,000 and covers 3,287,263km2. The population density of India is 336.")
23
Population density = Number of people / Area(km2)
What is the population density of the U.S What is the population density of England? The population is 52,095,895 England covers kilometres squared.

24
High Density (densely populated)
Low Density (Sparsely populated) Task Create 2 top trump cards for why countries or areas would be densely and sparsely populated.
 Task. Create 2 top trump cards for why countries or areas would be densely and sparsely populated.")
25
Where would you prefer to live : in a densely or sparsely populated place ? Why?

26
Homework Using the website above write down 5 of your favorite facts and tell me why you like each one. For example. I like this fact because it shocks me how much logging occurs in the World as the rainforest is very important to the wildlife and humans.

27
Population Density Learning Objective
To learn why some places are densely populated whilst others are sparsely populated. All pupils to define what densely and sparsely populated mean. Most pupils can identify reasons why people do or do not want to live in a place. Some pupils can identify places where there are high or low populations

28
Do the factors increase or decrease natural change?
Lack of birth control/family planning Famine causing lots of people to die due to lack of food Parents wanting lots of children to help provide an income (such as working on farms) Disease (for example HIV/AIDS) causing lots of people to die. In many rural areas it can be the tradition to have lots of children Many young children die due to poor health care No education about the benefits of a smaller family War/Conflict Government policies which want to strengthen their population Drug use, alcoholism and sexually transmitted diseases (STD’s) is blamed for this change in . Better health care Lack of resources Peaceful conditions within the country Government policies (such as the One Child Policy in ) A culture which means men have a high status for having lots of children Education about the benefits of a smaller family Do the factors increase or decrease natural change?
 Disease (for example HIV/AIDS) causing lots of people to die. In many rural areas it can be the tradition to have lots of children. Many young children die due to poor health care. No education about the benefits of a smaller family. War/Conflict. Government policies which want to strengthen their population. Drug use, alcoholism and sexually transmitted diseases (STD’s) is blamed for this change in . Better health care. Lack of resources. Peaceful conditions within the country. Government policies (such as the One Child Policy in ) A culture which means men have a high status for having lots of children. Education about the benefits of a smaller family. Do the factors increase or decrease natural change")
29
Population Distribution
To investigate the population density of the US. -All pupils can contrast between Population density and distribution. -Most pupils can confidently interpret a choropleth map.

30
Density vs distribution
Density figures only tell us how many people live in an area. To describe the way people are distributed around an area we need to talk about the population distribution. The population can be evenly spread. The population can also be clustered around one specific location. Alternatively, the population can be randomly distributed. Often, distribution of the population is affected by factors of physical and human geography.

31
Describing distribution
When describing population distribution there are guidelines that should be followed. Describe the obvious pattern. Where do most people live? What areas are most populated? Give figures, if available, and locations. Using accurate figures helps support your description. Give any exceptions to the ‘obvious pattern’. Are there areas that do no fit in with the general population distribution? Photo credit: ©2008 A choropleth map is a very accurate tool to use when describing population distribution.

32
Keywords

33
Describe the population distribution of the UK
Use HLGTA H – Highest L – Lowest GT – General Trend A - Anomaly

34
Population density of U.S. - 2011

35
Group Task For the Choropleth map state 3 facts about the pattern of population distribution in the U.S. To reach the higher levels include: Values e.g it is 2.5 – 6.3% Compass Directions Towns and Major cities (use an atlas to help you)
")
36
Odd One Out Notebook file

37
Population Distribution
To investigate the population density of the U.S. -All pupils can contrast between Population density and distribution. -Most pupils can confidently interpret a choropleth map.

38
In the World come up with 3 ...
Densely Populated areas in the World Sparsely Populated areas in the World

39
World Population Density
Learning Objectives -To explore areas in the world where there is a dense and sparse population density. -All pupils can state an area that is sparsely populated in the world. -Most pupils can identify an area in the world that is densely populated and why. -Some pupils can describe the world population density.

40
Reminder Population Density
People are unevenly distributed around the world. The difference in distribution is measured by comparing population density - the number of people per square kilometre (km²) or sq. mile in the U.S.. Population density is determined more by environmental factors which make an area more or less attractive to settlers than by economic development.
 or sq. mile in the U.S.. Population density is determined more by environmental factors which make an area more or less attractive to settlers than by economic development.")
41
Reminder Population Distribution
The way in which people are spread across a given area is known as population distribution. Patterns of population distribution tend to be uneven. For example, in the US there are more people living in the northeast of the U.S. than in the West (eg.Montana).
.")
42
World Population Density

43
World Population Density – by country
Western Europe and Asia are densely populated North America, South America and Africa have a low population density Can be used for discussion purposes to encourage students to identify sparsely and densely populated regions and countries of the world. Links to the next activity – physical and human factors. Alternatively, students can write a description of the distribution of population at a global scale.

44
Out of every 100 persons added to the population in the coming decade, 97 will live in developing countries.

45
World Population Density
Learning Objectives -To explore areas in the world where there is a dense and sparse population density. -All pupils can state an area that is sparsely populated in the world. -Most pupils can identify an area in the world that is densely populated and why. -Some pupils can describe the world population density.

46
What is the question ? From the Northwest to the Southeast Sparsely
Uneven Densely How spread out people are across the Earth’s surface The number of people per km² in a country Answers are given when the left mouse button is pressed, students to give the correct question to each answer. Can refer back to the key questions at this point.

47
Overpopulation Learning Objective
To consider what impacts overpopulation will have on the planet. All pupils to identify what overpopulation means. Most pupils can state two impacts on the Earth from Overpopulation. Some pupils can suggest ways in which the population can be reduced.

49
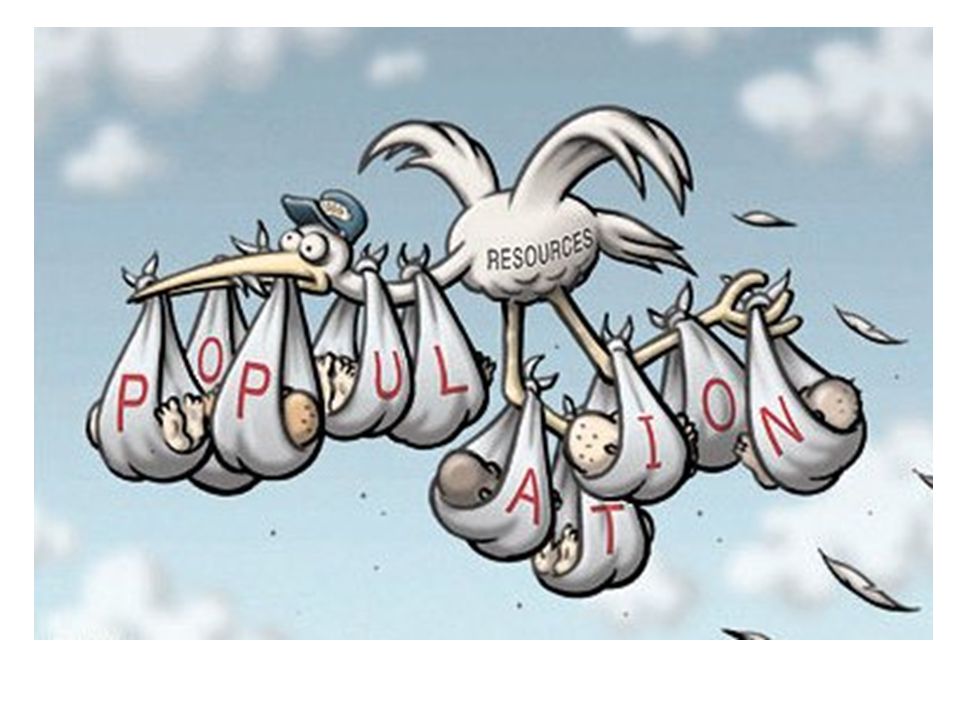
What does ‘Overpopulation’ mean?
Overpopulation means there are too many people living in a certain area, which can create environmental and social problems.

50
Is Overpopulation good or bad for the Planet?

51
Are there any problems in the U.S. due to overpopula-tion?

52
Homework

53
Overpopulation Learning Objective
To consider what impacts overpopulation will have on the planet. All pupils to identify what overpopulation means. Most pupils can state two impacts on the Earth from Overpopulation. Some pupils can suggest ways in which the population can be reduced.

54
Population Management
Learning Objective To identify how one country has managed its population All pupils can state why population needs to be managed. Most pupils will identify how China manages its population. Some pupils can analyse whether they agree or disagree with Chinas Policy.

55
What does ‘Overpopulation’ mean?
Overpopulation means there are too many people living in a certain area, which can create environmental and social problems.

56
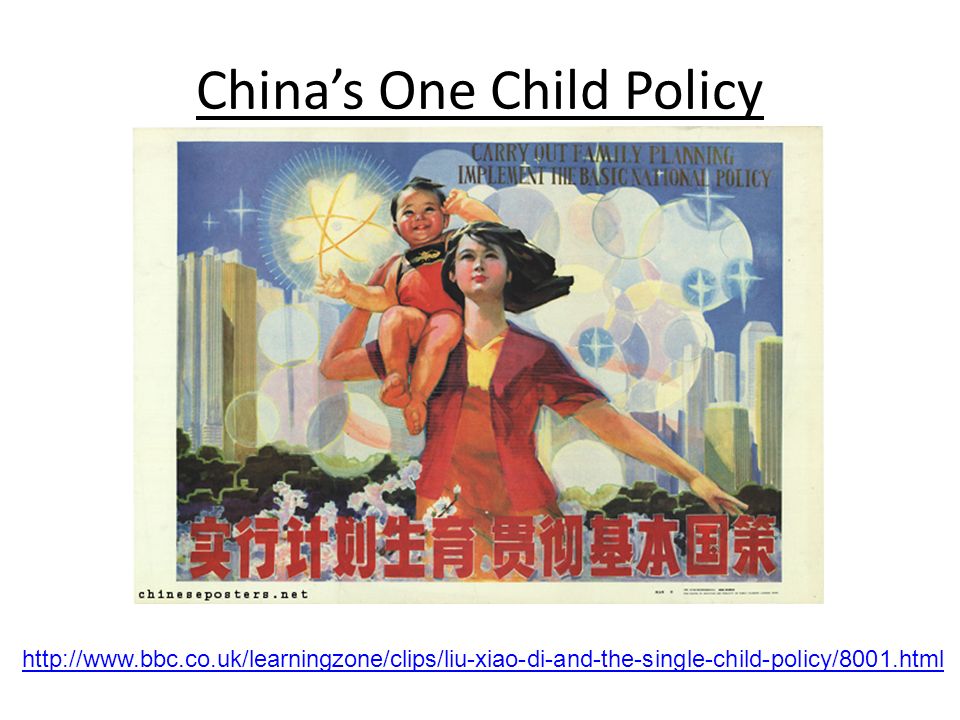
China’s One Child Policy
57
Video
58
Task – Overpopulation Management
Write a news paper article informing other pupils what the One child policy is in China and whether it has been successful (Evaluation) Include facts, map, photos, quotes and your opinion !
 Include facts, map, photos, quotes and your opinion !")
59
5 W’s !!! What is the One Child Policy In China & Why is it in place ?
Remember No more than 140 characters What is the One Child Policy In China & Why is it in place ? 5 W’s !!!

60
Population Management
Learning Objective To identify how one country has managed its population All pupils can state why population needs to be managed. Most pupils will identify how China manages its population. Some pupils can analyse whether they agree or disagree with Chinas Policy.

61
Hu Jintao The President of China
What two questions would you ask the Chinese government about the One Child policy?

62
Hu Jintao The President of China
What two questions would you ask the Chinese government about the One Child policy? Mr Jintao has 2 children !

63
Task – Overpopulation Management
Write a newspaper article informing other pupils what the One child policy is in China and whether it has been successful (Evaluation) Include facts, map, photos, quotes and your opinion !
 Include facts, map, photos, quotes and your opinion !")
64
Your Right or Government’s Right? Would you follow it? Fair or Unfair?

65
Population Management
Learning Objective To identify how one country has managed its population All pupils can state why population needs to be managed. Most pupils will identify how China manages its population. Some pupils can analyse whether they agree or disagree with China’s Policy.

66
Share your solutions with your table.
Do you agree with them? As a group decide the BEST Solution

67
Population Pyramids To explain what Population pyramids show us and how they may differ. -All pupils can explain a population pyramid shows us. -Most pupils can correctly analyse a population pyramid. -Some pupils can compare the differences in pyramids for LEDCs and MEDCs, offering reason.

68
The Birth Rate , Death Rate and Life Expectancy
all affect the population structure of a country.

69
What is this? What does it tell us about the population of a place?

70
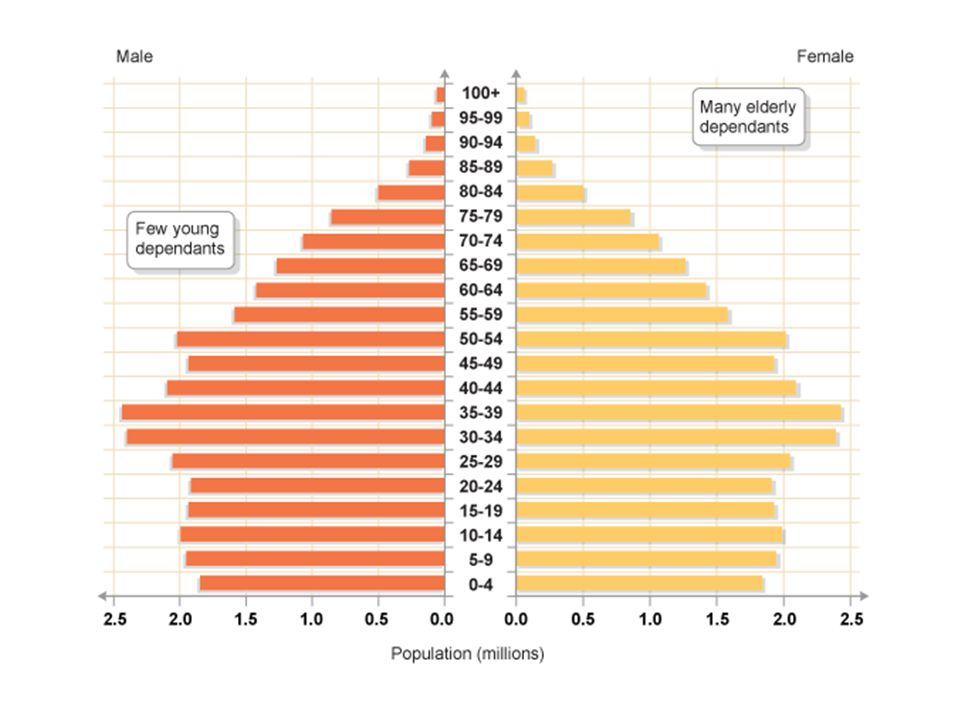
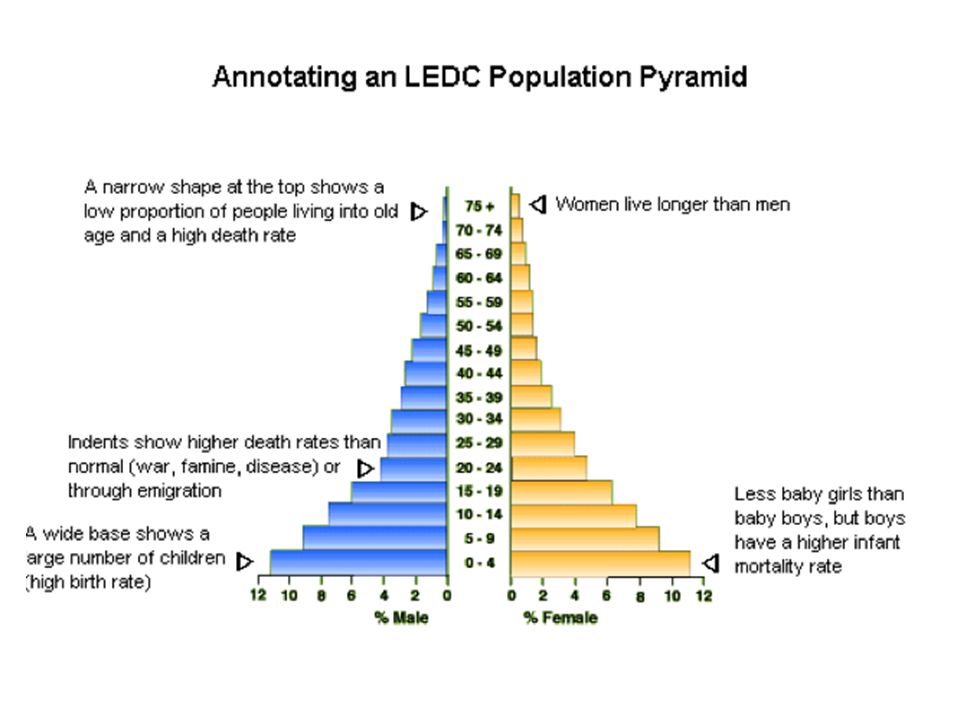
What is a population pyramid?
Population structure can be shown as a population pyramid. Features of a population pyramid. -Population is divided into 5 year age groups. -Population is divided into males and females. -The percentage/Number of each age /sex group is given.

71
What can we find out from PP’s?

73
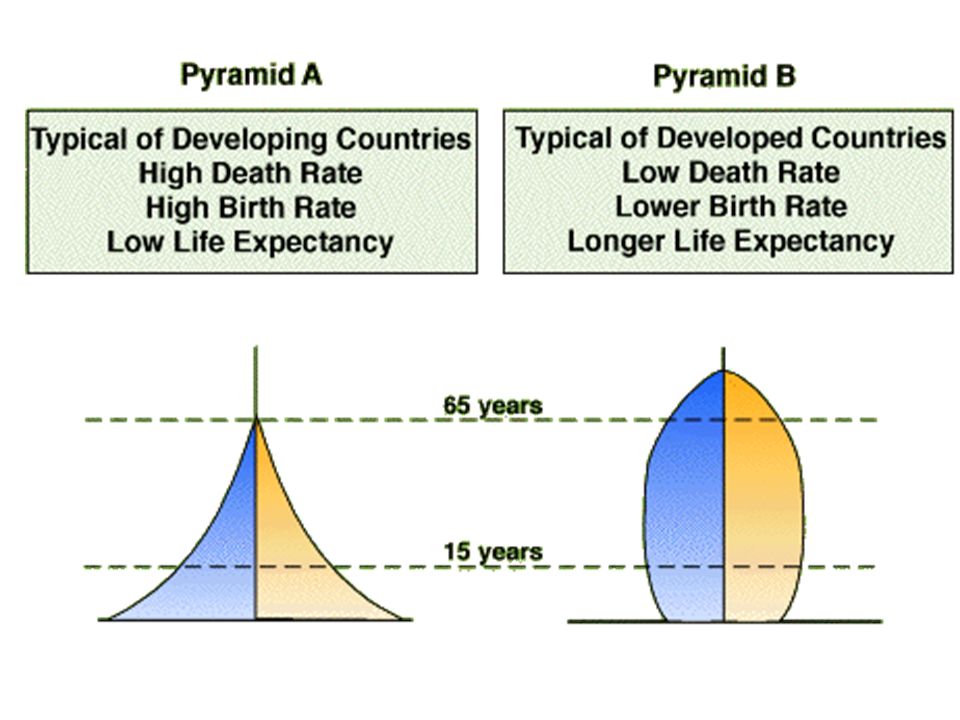
How would the population pyramid look if it was a developing country (LEDC)?
")
76
As a table create 4 questions for another table on what we have learned on population

77
Match the key words with the definitions
Is when there are relatively few people living in one area the balance in population needed with the number of available resources Sparsely populated Under/optimum population overpopulation Population density When the number of people living in an area exceeds the amount of resources needed for them The number of people living within a given area means the way or pattern in which people are spread across the world Population distribution

78
Migration To describe how migration can impact both negatively and
positively on population. -All to define migration and identify its various forms. -Most pupils can describe 2 ways migration can be viewed as a positive in an area. -Some pupils can evaluate the negative aspects on a population from migration and can begin to provide solutions to migration concerns.

79
Migration is the movement of people from one place to another
It can be temporary, permanent, legal, illegal, internal and international

82
Classroom Migration Desert Dense forest Coal is discovered Desk Door
Smart Board Door Desk Desert Dense forest High mountains Coal is discovered

83
Classroom Migration River Desert Dense forest Coal is discovered
Smart Board River Door Desk Desert Dense forest High mountains Coal is discovered Town grows bigger

84
Classroom Migration River Desert Trees cut down for farmland
Smart Board River Door Desk Desert Trees cut down for farmland High mountains Fertile farmland Coal runs out Town grows bigger

85
Machines mean fewer workers are required
Classroom Migration Smart Board River Door Desk Desert Soil erosion due to deforestation High mountains Machines mean fewer workers are required Coal runs out Town grows bigger

86
Classroom Migration River for hydroelectric power scheme
Smart Board River Door Desk Area flooded for hydroelectric power scheme High mountains Oil is discovered in desert Machines mean fewer workers are required More jobs and opportunities in Town Coal runs out

87
Impacts on the Host Country
The host country is the country where the migrant has moved TO. Positives Negatives

88
The departing country is the country where the migrant has moved FROM.
Positives Negatives

89
H O S T Positives Negatives Positives Negatives DEPARTING

90
If you were the President, What would your Immigration policy be?

91
Migration To describe how migration can impact both negatively and
positively on population. -All to define migration and identify its various forms. -Most pupils can describe 2 ways migration can be viewed as a positive in an area. -Some pupils can evaluate the negative aspects on a population from migration and can begin to provide solutions to migration concerns.

92
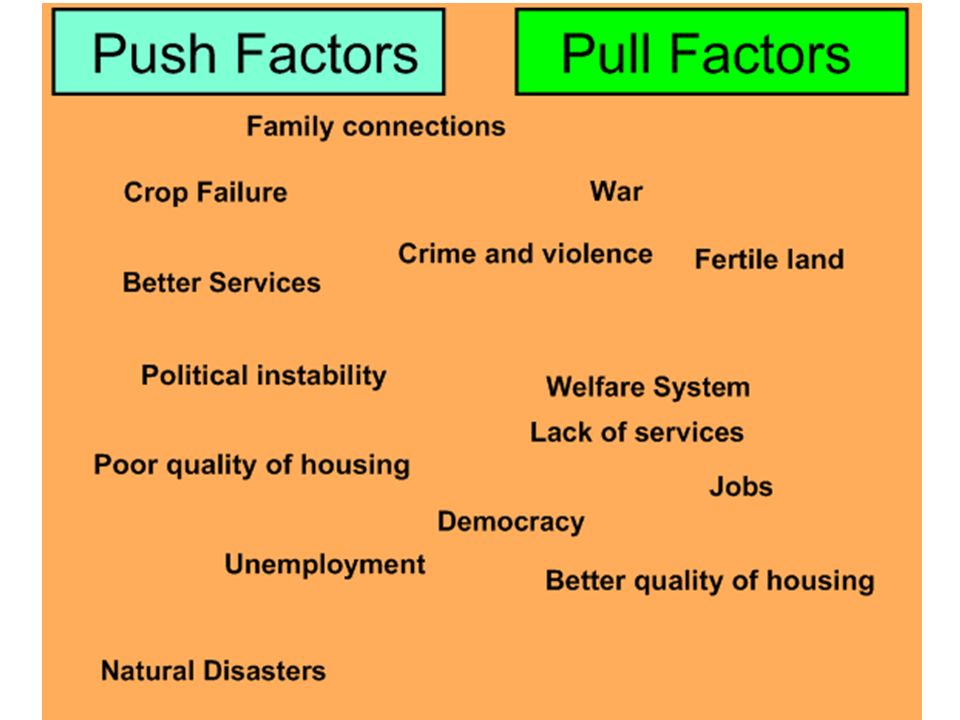
What would be the main push or pull factors in the following situations…?
Migrant from Poland Conflict in Iraq

93
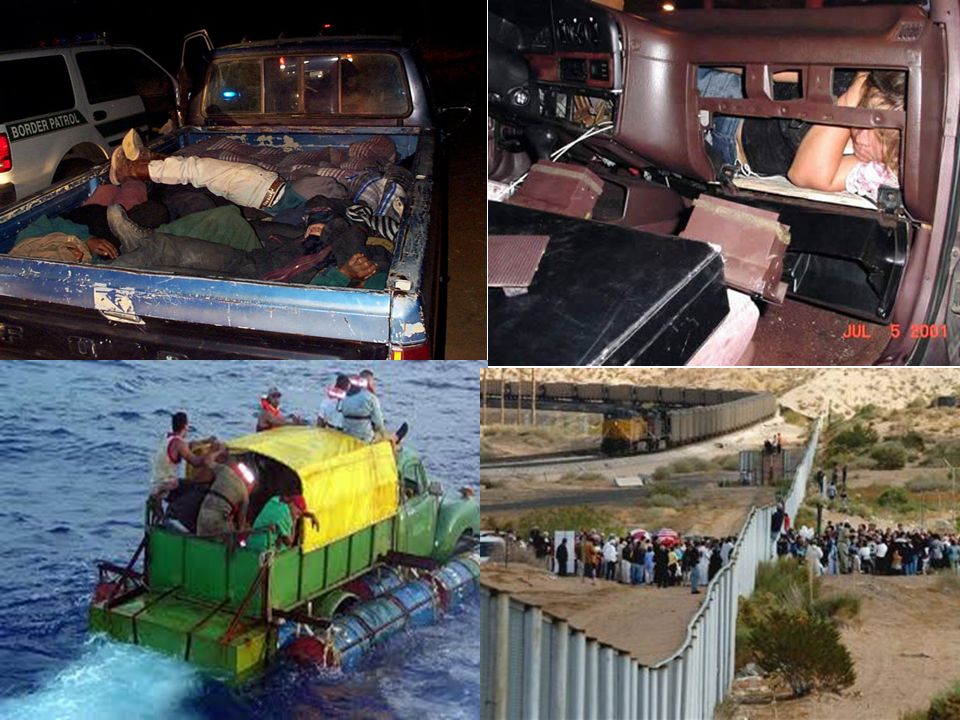
Migration Case Study Mexico to the USA
To investigate a case study of migration to highlight why and how people migrate. -All pupils can state and explain one reason why Mexicans are migrating to the USA. -Most pupils can describe how Mexicans cross the border and the problems they may face. -Some pupils can evaluate the effectiveness of the USA Border patrol.

94
What do you think is happening in this picture?
Discuss in pairs and then write down 5 questions you would like to know about it

95
-The border's total length is 3,169 km (1,969 miles)
-It is the most frequently crossed international border in the world, with approximately three hundred fifty million (350,000,000) crossings per year.
 crossings per year.")
96
Which side is the USA?

97
400 immigrants a year die trying to cross the Mexican border

98
Two Mexicans have been caught and put in a cell…
I wanted to go to the USA because… Two Mexicans have been caught and put in a cell… (include good points about the USA) I wanted to leave Mexico because… (include bad points about Mexico)
 I wanted to leave Mexico because… (include bad points about Mexico)")
99
Who are these men and what are they doing?
Who is this man and what is he doing? What is he carrying? What is he carrying and why? Where is this?

100
Videos
101
The end

Similar presentations