Download presentation
Presentation is loading. Please wait.

1
Demonstration, Contents and Results End User Meeting 30 March 2010

2
Cross Compliance Assessment Tool

3
Expected compliance based on: - Actual implementation - If available: National / regional legislation - Else: EU regulations (2005-2009)
")
4
Cross Compliance Assessment Tool Expected compliance based on: - Actual implementation - If available: National / regional legislation - Else: EU regulations (2005-2009) Baseline Implementation of directives and GAECs 2005 - 2009
 Baseline Implementation of directives and GAECs")
5
Cross Compliance Assessment Tool Expected compliance based on: - Actual implementation - If available: National / regional legislation - Else: EU regulations (2005-2009) Voluntary compliance level (range from 0-100%) + actual implementation Halve way between baseline and 100% compliance + actual implementation 100% compliance level + actual implementation 100% compliance and implementation based on available national / regional legislation specifications only All mandatory SMRs and GAECs are fully implemented according to the EU regulations Hypothetical: also all non mandatory SMRs and GAECs are fully implemented (test).
 Voluntary compliance level (range from 0-100%) + actual implementation Halve way between baseline and 100% compliance + actual implementation 100% compliance level + actual implementation 100% compliance and implementation based on available national / regional legislation specifications only All mandatory SMRs and GAECs are fully implemented according to the EU regulations Hypothetical: also all non mandatory SMRs and GAECs are fully implemented (test).")
6
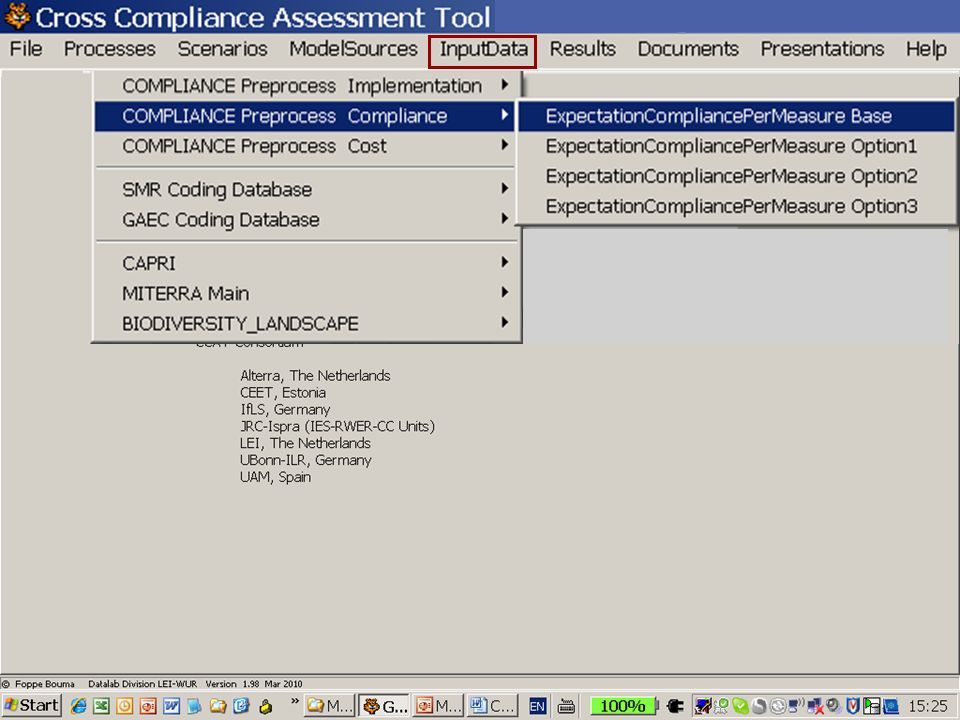
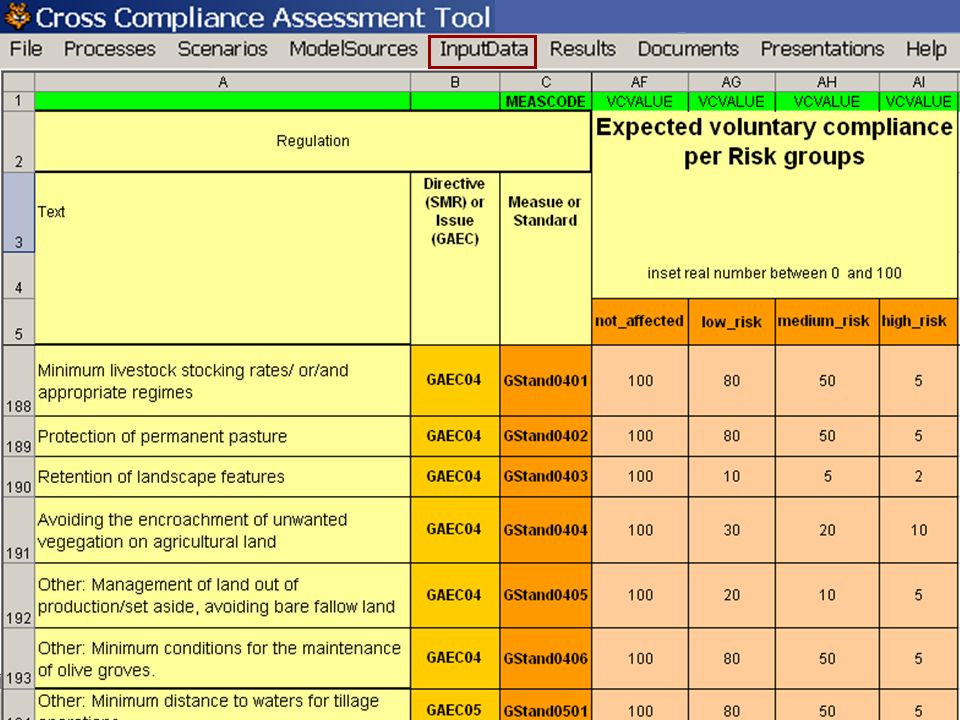
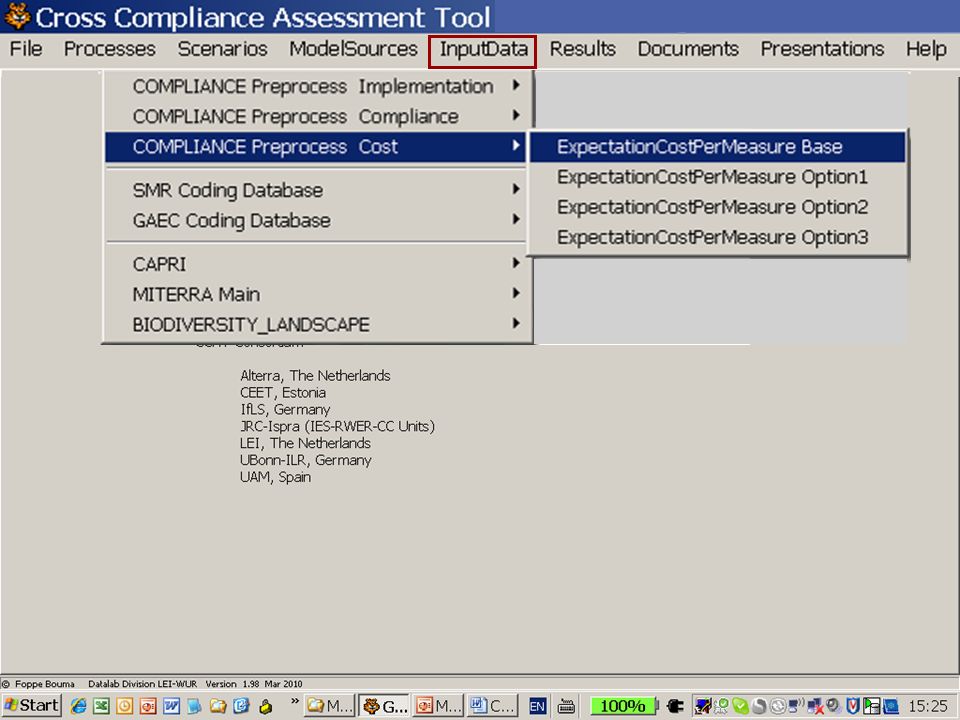
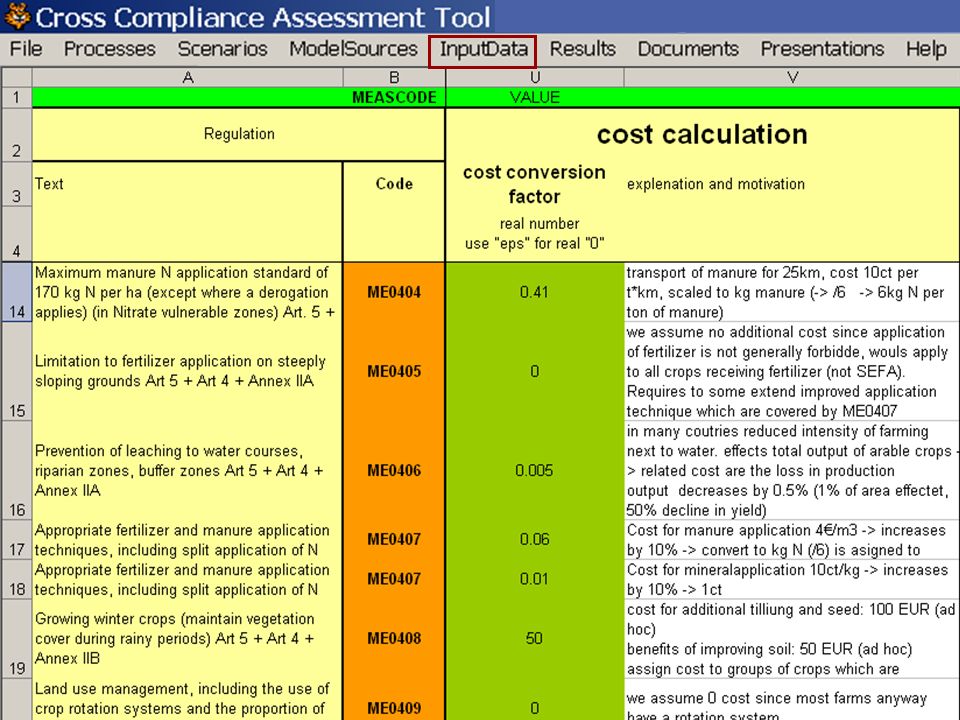
Cross Compliance Assessment Tool Implementation national/regional legislation Characterise the national standards (for assessing potential impacts) Help translate SMRs/GAECs to potential practices and costs (as input for modelling) Represent ‘national diversity’ in EU as a manageable set of categories. Contains: SMRs: 160 measures and 66 specifications GAECs: 35 different standards (relating to 5 issues) A total of 2680 national SMRs and 590 national GAECs
 A total of 2680 national SMRs and 590 national GAECs.")
7
Cross Compliance Assessment Tool Implementation national/regional legislation 1) Characterise the national standards (for assessing potential impacts) 2) Help translate SMRs / GAECs to potential practices and costs (as input for modelling) 3) Represent ‘national diversity’ in EU as a manageable set of categories
 Characterise the national standards (for assessing potential impacts) 2) Help translate SMRs / GAECs to potential practices and costs (as input for modelling) 3) Represent ‘national diversity’ in EU as a manageable set of categories")
8
Cross Compliance Assessment Tool

15
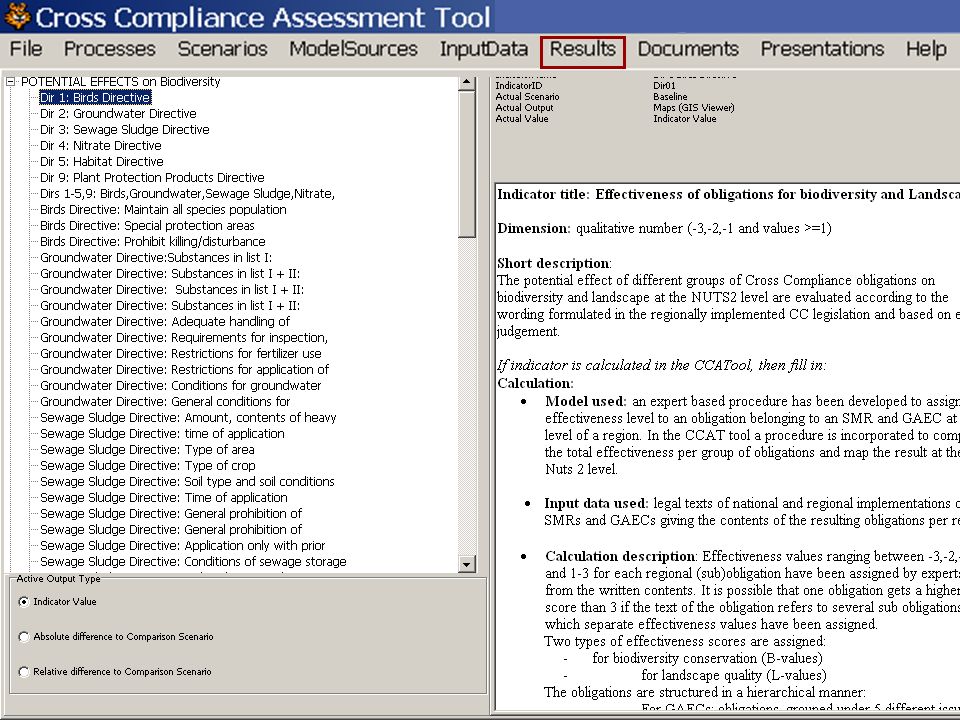
How do we translate the implementation specifications at EU, national and regional level into input for the models?

16
Cross Compliance Assessment Tool indicators Pot. effect Biodiv & Lands National / regional SMR & GAEC obligations EU Regulation On SMR & GAEC To be transposed into national/regional legislation No asses sment Per region + activity (per crop, animal type) Compliance level/scenario Cost level YES NO (data) Imple- mented? YES NO Obliga- tory? CAPRI Miterra Input data Translation of the implementation specifications into indicators
 Compliance level/scenario Cost level YES NO (data) Imple- mented. YES NO Obliga- tory. CAPRI Miterra Input data Translation of the implementation specifications into indicators.")
17
Cross Compliance Assessment Tool Environmental indicators / scenario - Air : NH 3, N 2 O, CH 4, GHG emissions - Water: N leaching, runoff, NO 3 concentration - Soil : C stock, N, P and metal balances Comparison Models in CCAT Per region + activity (per crop, animal type) Compliance level/scenario Cost level Market response / scenario: 1) Changes in cropping shares 2) Change in livestock type/number N leaching, runoff, erosion Barley & Maize EPIC metamodel N leaching, runoff, N 2 O emissions Barley & Maize DNDC metamodel Miterra Biodiversity indicators / scenario: Animal Welfare Index / scenario Economic indicators (Market, Income) / scenario CAPRI
 Compliance level/scenario Cost level Market response / scenario: 1) Changes in cropping shares 2) Change in livestock type/number N leaching, runoff, erosion Barley & Maize EPIC metamodel N leaching, runoff, N 2 O emissions Barley & Maize DNDC metamodel Miterra Biodiversity indicators / scenario: Animal Welfare Index / scenario Economic indicators (Market, Income) / scenario CAPRI")
18
Cross Compliance Assessment Tool

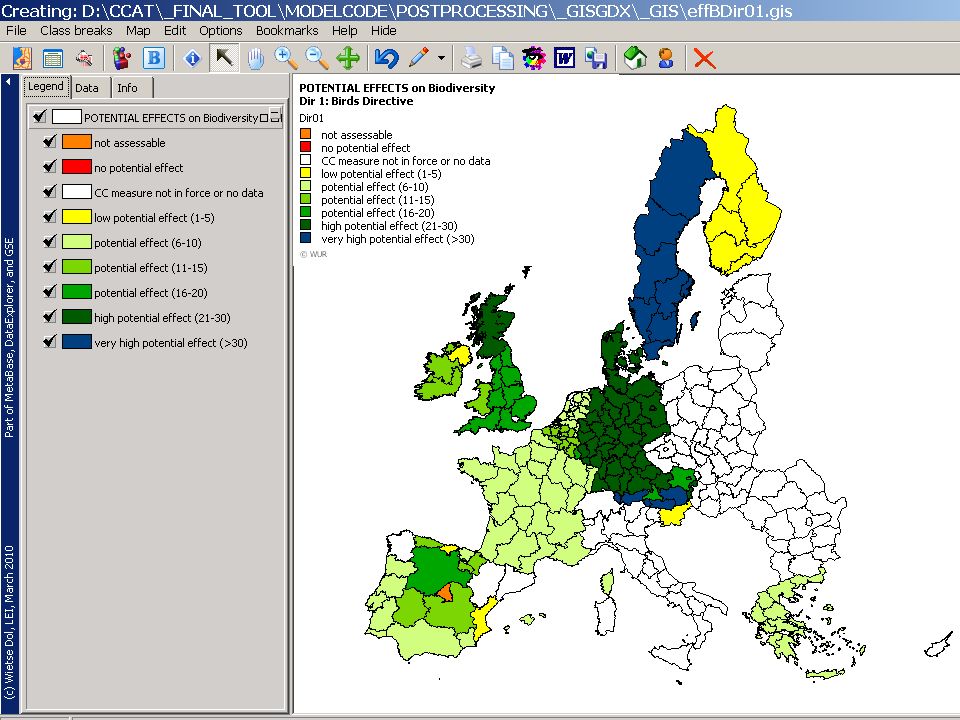
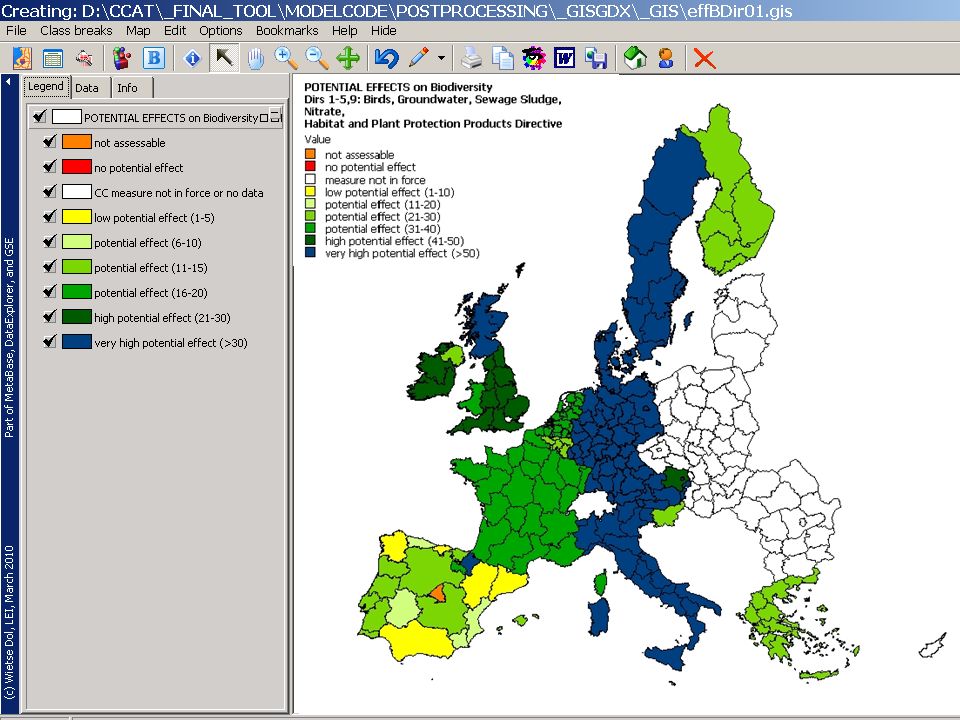
23
Strongly varied among regions. 6 Directives are included: Birds Directive Highest: Sweden, Scotland, Finland, Germany and some Austrian regions. Nitrates Directive Highest: Italy and Western France. Habitat Directive Only important effects in some Austrian regions and Navarra (ES). Groundwater Directive Low potential effect in most regions (only in Germany it has a higher effect) Sewage Sludge Directive Highest in Italy and Germany. Plant Protection Products Directive Low potential effect. Highest contribution from Birds and Nitrate Directives.
. Groundwater Directive Low potential effect in most regions (only in Germany it has a higher effect) Sewage Sludge Directive Highest in Italy and Germany. Plant Protection Products Directive Low potential effect. Highest contribution from Birds and Nitrate Directives..")
24
Cross Compliance Assessment Tool

25
Overall highest effectiveness from minimum level of maintenance and soil erosion issues Soil structure and additional farmer’s obbligations issues lowest overall effectiveness: Only Finland, France, England, Wales, Ireland, Belgium, Spain (except Madrid and Murcia), Portugal and Austria have implemented additional obligations.
, Portugal and Austria have implemented additional obligations.")
26
Cross Compliance Assessment Tool Modelled results

27
Cross Compliance Assessment Tool Cost of compliance

28
Cross Compliance Assessment Tool Cost Implication at EU level

29
Cross Compliance Assessment Tool Regional Cost Implication Total cost per UAA Crop related cost per UAA Animal related cost per LU

30
Cross Compliance Assessment Tool Regional Cost Implication Total cost per UAA Crop related cost per UAA Animal related cost per LU Animal production more affected than crops Dir 4 (crops and animals) and Dir16-18 (only animals) major cost drivers Significant regional difference in cost effects (especially for animals)
 and Dir16-18 (only animals) major cost drivers Significant regional difference in cost effects (especially for animals)")
31
Cross Compliance Assessment Tool Income effect

32
Cross Compliance Assessment Tool Income Effects (EU27)
")
33
Cross Compliance Assessment Tool Regional Income Effects

34
Cross Compliance Assessment Tool Regional Income Effects Agricultural Income decreases compared to a situation without regulation ( ~ -3%) No significant difference in income change between animal and crop sector Minor effect on income of additional compliance (baseline (+90%) to 100% compliance) Output value of animal products goes up with increasing cost (market effects can partially compensate) Output value of crops slightly decreasing (at most stable)
 No significant difference in income change between animal and crop sector Minor effect on income of additional compliance (baseline (+90%) to 100% compliance) Output value of animal products goes up with increasing cost (market effects can partially compensate) Output value of crops slightly decreasing (at most stable)")
35
Cross Compliance Assessment Tool Production effect

36
Cross Compliance Assessment Tool Market effects for selected activities/products

37
Cross Compliance Assessment Tool Market effects for selected activities/products Animals: Overall decrease in herds; Increasing prices almost compensate CC cost (… but not loss of production) Crops: Cereal production increasing (“best alternative”); Cereal prices go down due decreasing (feed) demand and increasing acreage Additional cereal production is processed to bio fuels (at lower prices) “demanding” crops go down (costs can be partially compensated by price effects) Set aside and fallow land decrease (due GAEC enforcing minimum maintenance)
 Crops: Cereal production increasing ( best alternative ); Cereal prices go down due decreasing (feed) demand and increasing acreage Additional cereal production is processed to bio fuels (at lower prices) demanding crops go down (costs can be partially compensated by price effects) Set aside and fallow land decrease (due GAEC enforcing minimum maintenance)")
38
Cross Compliance Assessment Tool Environmental and biodiversity effects

39
Cross Compliance Assessment Tool Intensity effects

40
Cross Compliance Assessment Tool % Change in share of extensive & intensive livestock: Compliance gap 0-100% Cross Compliance Assessment Tool Extensive Intensive -Increases in intensive livestock group mostly in regions in UK, central France, Spain, Southern Italy, Greece, Bulgaria, Romania going together with loss of extensive group.

41
Cross Compliance Assessment Tool ExtensiveMedium Intensive Compliance gap between 0 and 100% Relative differences Share of land use

42
Cross Compliance Assessment Tool ExtensiveMedium Intensive Compliance gap between 0 and 100% Relative differences Share of land use Landuse intensity Extensification in Mediterranean, Scandinavian and Eastern countries vs. Intensification in Central European countries.

43
Cross Compliance Assessment Tool Environmental effects: changes in emissions

44
Cross Compliance Assessment Tool Comparison scenarios

45
Cross Compliance Assessment Tool NO 3 concentration groundwater % diff. baseline vs 0-compl. baseline

46
Cross Compliance Assessment Tool N 2 O emission % diff. baseline vs 0-compl. baseline

47
Cross Compliance Assessment Tool Critical N load exceedance Exceedance CL baseline % diff. baseline vs 0-compl.

48
Cross Compliance Assessment Tool Soil organic carbon stocks baseline abs diff. baseline vs 0-compl.

49
Cross Compliance Assessment Tool Main conclusion on emissions Changes in agricultural emissions due to cross compliance obligations range between 1%-6% (0-100% compliance) Largest decrease in N-leaching Nitrate Directive clearly improved environmental quality Balanced fertilization can significantly reduce N emissions Overall regional effects are positive with some exceptions for certain regions (e.g. Poland, Bulgaria, Romania) and Mediterranean (Alpes-Mediteranee) for different emissions.
 and Mediterranean (Alpes-Mediteranee) for different emissions..")
50
Cross Compliance Assessment Tool Overall initial conclusions and recommendations

51
Cross Compliance Assessment Tool Overall initial conclusions (1) Overall effects of cross compliance obligations are larger in economic than in environmental and biodiversity terms. However, clear regional diversity. Effects of additional compliance (gap-closure between baseline and 100% compliance) are limited as baseline compliance is already high (average at 90%). Potential effectiveness of CC standards on biodiversity and landscape generally very positive but very strong regional variation due to large differences in implementation at national and regional levels (both for SMRs and GAECs)
 are limited as baseline compliance is already high (average at 90%). Potential effectiveness of CC standards on biodiversity and landscape generally very positive but very strong regional variation due to large differences in implementation at national and regional levels (both for SMRs and GAECs).")
52
Cross Compliance Assessment Tool Overall initial conclusions (2) CC Cost are almost not compensated by market effects Divergent effects in crop and animal sectors: –Crops: Production and prices rather constant. –Animals: Production decreases and prices go up –Livestock intensity: In selection of regions increase in intensive livestock group –Land use intensity: Extensification in Mediterranean, Scandinavian and Eastern countries vs. Intensification in Central European countries –In most regions limited but positive changes in agricultural emissions. However, a selection of regions experience negative environmental externalities: Soil C (Poland, Southern Portugal), Ammonia (Poland, Bulgaria, Romania, Alpes-Mediterannée).
, Ammonia (Poland, Bulgaria, Romania, Alpes-Mediterannée)..")
53
Cross Compliance Assessment Tool Recommendations Public service payments might need to be targeted more strongly to livestock sectors (also in the light of important positive and negative externalities to environment by these sectors) More and/or stricter measures (e.g. balanced fertilization) can further enhance GHG and N-leaching mitigation as long as they do not involve significantly higher cost levels. Otherwise contrary effect may be sorted through production increase response. Further studies needed on: –Changes in permanent grassland area and management in wider context then Cross Compliance (Bioenergy targets) –Improved compliance data and compliance costs (tool allows for adjustment in scenario specifications). CCAT tool can easily be adapted to assess: –Climate policy options (climate proof GAEC's) – Public services and their potential effects
 can further enhance GHG and N-leaching mitigation as long as they do not involve significantly higher cost levels. Otherwise contrary effect may be sorted through production increase response. Further studies needed on: –Changes in permanent grassland area and management in wider context then Cross Compliance (Bioenergy targets) –Improved compliance data and compliance costs (tool allows for adjustment in scenario specifications). CCAT tool can easily be adapted to assess: –Climate policy options (climate proof GAEC s) – Public services and their potential effects.")
54
Cross Compliance Assessment Tool END of Plenary presentation

55
Cross Compliance Assessment Tool Follow-up CCAT -Present CCAT tool: is publicly available (May 2010) and enables: -Viewing all stored data + results -Adding new scenarios: editing implementation, compliance levels, costs (some training required) -More complex changes (complex scenarios, model adaptations, new indicators, new applications): -JRC who becomes user of system -Framework contract with DG-AGRI/DG-ENV -New EC tender (direct or via FP7)
 and enables: -Viewing all stored data + results -Adding new scenarios: editing implementation, compliance levels, costs (some training required) -More complex changes (complex scenarios, model adaptations, new indicators, new applications): -JRC who becomes user of system -Framework contract with DG-AGRI/DG-ENV -New EC tender (direct or via FP7)")
Similar presentations


, University of Bonn ImpactsMarket development Policy measures Policy objectives Leading to.>")

 Existing data & generated new data to fill knowledge gaps 1. GIS-based suitability.>")


