Download presentation
Presentation is loading. Please wait.

1
Gwinnett Comprehensive Accountability and Assessment System Georgia’s Changing Landscape April 2014

2
Assessment Update This update pertains to anticipated changes to Georgia’s Student Assessment Program for the future. –As more information and details become available, we will follow-up to keep everyone informed. Please Note: This update does not pertain to assessments administered this school year.

3
Federal Requirements Based on College & Career Ready standards and expectations Assessments in grades 3 – 8 and high school –capable of measuring student growth over the course of the academic year –accessible for all students, including SWD and EL Administer no later than 2014 – 2015

4
A New Assessment System Comprehensive –single program, not series of tests (e.g., CRCT; EOCT; WA) Coherent –consistent expectations and rigor to position Georgia students to compete with peers nationally and internationally –consistent signal about student preparedness for the next level, be it the next grade, course, or college/career –consistent signal about student achievement both within system (across grades and courses) and with external measures (NAEP; PSAT; SAT; ACT) Consolidate –will combine reading, language arts, and writing into a single measure to align to the standards
 Coherent –consistent expectations and rigor to position Georgia students to compete with peers nationally and internationally –consistent signal about student preparedness for the next level, be it the next grade, course, or college/career –consistent signal about student achievement both within system (across grades and courses) and with external measures (NAEP; PSAT; SAT; ACT) Consolidate –will combine reading, language arts, and writing into a single measure to align to the standards")
5
Coherency – Consistency Achievement of Georgia Students in Mathematics 2013 NAEP – Grade 8: 29% at/above proficient CRCT – Grade 8:83% met/exceeded Coordinate Algebra EOCT: 37% met/exceeded SAT – Class of 2013:42% college ready benchmark * ACT – Class of 2013:38% college ready benchmark ** 2012 PSAT – sophomores:37% on track to be CCR *SAT data represent 71% of Class of 2013 **ACT data represent 51% of Class of 2013

6
Coherency – Consistency Achievement of Georgia Students in Reading 2013 NAEP – Grade 8: 32% at/above proficient CRCT – Grade 8:97% met/exceeded 9 th Grade Literature EOCT: 86% met/exceeded American Literature EOCT:91% met/exceeded SAT – Class of 2013:43% college ready benchmark * ACT – Class of 2013:43% college ready benchmark ** 2012 PSAT – sophomores:40% on track to be CCR *SAT data represent 71% of Class of 2013 **ACT data represent 51% of Class of 2013

7
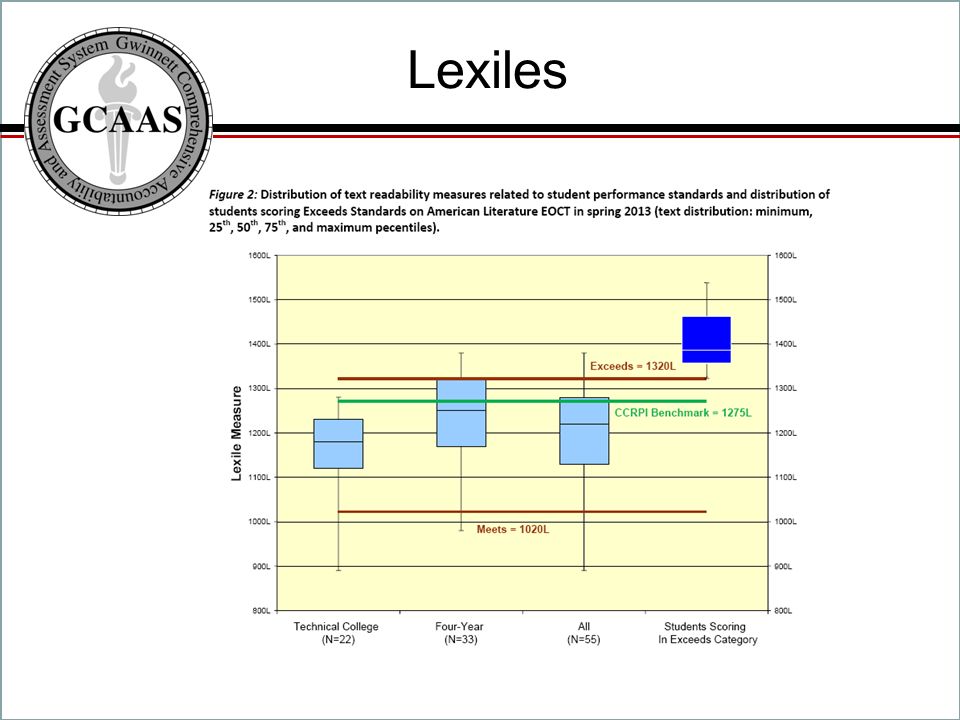
Lexiles

9
Georgia’s New Assessment System As we begin to build a new assessment system, the plan is: to consolidate reading, language arts, and writing into a single measure to align to the standards; to embed norm-referenced items to provide a national comparison; to share items with other states; to align expectations with other external measures to send consistent signal of how Georgia students are doing compared to their peers; and to involve USG and TCSG in the development to ensure the assessments signal college and career readiness.

10
Georgia’s Plan To accomplish this plan, Georgia must: –include a variety of item types – more than just multiple choice; –increase expectations for student learning and achievement; and –continue to – and accelerate – transition to online administration

11
Guiding principles stipulate the new system must: be sufficiently rigorous to ensure Georgia students are well positioned to compete with other students across the United States and internationally; be intentionally designed across grade levels to send a clear signal of student progress/growth and preparedness for the next level, be it the next grade level, course, or college or career; be accessible to all students, including those with disabilities or limited English proficiency, at all achievement levels; support and inform educator effectiveness initiatives, ensuring items and forms are appropriately sensitive to quality instructional practices; and accelerate the transition to online administration, allowing – over time – for the inclusion of innovative technology-enhanced items. Georgia’s New Assessment System

12
Knowns and Partial Knowns Knowns New program ‒ end of grade/end of course ‒ will include language arts, mathematics, science, social studies ‒ will no longer be solely multiple- choice IT requirements – follows PARCC Online transition over time -Year 1 (30% online) -Year 3 (80% online) -Year 5 (100% online) Accommodations CRCT-M discontinued Growth (SGPs) will continue Georgia educators will be involved in design/development Partial Knowns Test blueprint Testing windows Administration protocols Reporting timelines ‒ scores will be delayed in year 1 due to technical work and standard setting ‒ requirement to hand-score some items may impact ability to report as quickly as we have in the past Timing of ancillary material availability (i.e. Study Guides, Content Weights) Impact of the review of content standards Calculator policy specifics
 Impact of the review of content standards Calculator policy specifics.")
13
Resources Even with many of the specifics of the new assessment system unknown at this time, there are many, many resources that will prepare educators and students: –Content standards frameworks, formative lessons, PARCC evidence statements –Sample items: PARCC; SBAC; Georgia OAS; other states (KY, NY); NAEP released items –CRCT Readiness Indicators –Lexiles
; NAEP released items –CRCT Readiness Indicators –Lexiles")
14
CRCT Readiness Indicators: Reading, ELA, Mathematics For instructional planning and decision making: Indicators were designed to send a signal to stakeholders about where students are relative to where they need to be headed Indicators provide feedback about our preparedness for the increase in rigor and expectation for student achievement that is on the horizon Feedback consists of the percent of students who achieved each readiness level – state, district, and school levels

15
For accountability purposes - at the student (promotion/retention), school, district, and state levels (CCRPI) - we will continue to use 800 and 850 for the 2013-2014 school year. It is strongly advised, however, that schools use the scale scores associated with the Readiness Indicators as targets - we need to be working actively to get students to these levels because we believe the new tests will be more in line with those expectations than the 800 / 850. The readiness indicators will be provided during the interim as additional feedback to districts and schools so they have "better" information about where students are in relation to where they need to be in 2014-2015 (with the increased rigor). Bottom line: shooting for 800 isn't going to be sufficient in future years. CRCT Readiness Indicators: Reading, ELA, Mathematics
. Bottom line: shooting for 800 isn t going to be sufficient in future years. CRCT Readiness Indicators: Reading, ELA, Mathematics.")
16
Formative Assessment Initiatives Bringing a Balanced Assessment Focus to the Classroom Assessment Literacy Professional Learning (FIP) Benchmark Assessments Formative Item Bank 1600 new items loaded Statewide launch in summer 2013 Phase I available February 2014; Phase II pilot in winter 2014
 Benchmark Assessments Formative Item Bank 1600 new items loaded Statewide launch in summer 2013 Phase I available February 2014; Phase II pilot in winter 2014")
17
Formative Assessment Pilot GCPS was a participant in Phase 1 and 2 as RT3 district Approximately 40 schools from GCPS participated in each phase Included grades 3 – 8 and high school in all core content areas Both phases were administered primarily online Four item types included: selected response, short answer, constructed response, and performance task

18
Sample Performance Task: ELA Students may be required to examine paired passages to make comparisons and connections Passage 1

19
Sample Performance Task: ELA Passage 2

20
Sample Performance Task: ELA Question based on passages 1 and 2

21
Sample Performance Task: Math

22
ELA Phase I Pilot Summary Data Grade Number and Percent of Students Achieving Each Score Point Total student N/ % 01234 3 4751613713202453048 15.60%52.90%23.40%6.60%1.50%100% 4 3231518814199832937 11.00%51.70%27.70%6.80%2.80%100% 5 36711009015181253011 12.20%36.50%29.90%17.20%4.20%100% 6 1559608114181112455 6.30%39.10%33.00%17.00%4.50%100% 7 218138712756171463643 6.00%38.10%35.00%16.90%4.00%100% 8 26411401029338892860 9.20%39.90%36.00%11.80%3.10%100% 9 - 10 1751016783361812416 7.20%42.10%32.40%14.90%3.40%100% 11 - 12 3761018763196462399 15.70%42.40%31.80%8.20%1.90%100%

23
Grade Number and Percent of Students Achieving Each Score Point Total Student N/ % 01234 3 8121107762174262881 28.18%38.42%26.45%6.04%0.90%100% 4 9061145765168633047 29.73%37.58%25.11%5.51%2.07%100% 5 83994812945371833801 22.07%24.94%34.04%14.13%4.81%100% 6 62614671028408863615 17.32%40.58%28.44%11.29%2.38%100% 7 695100210355151403387 20.52%29.58%30.56%15.21%4.13%100% 8 11161534827391803948 28.27%38.86%20.95%9.90%2.03%100% 9 - 10 1262181655910693752 33.64%48.40%14.90%2.83%0.24%100% 11 - 12 739138911753881313822 19.34%36.34%30.74%10.15%3.43%100% ELA Phase II Pilot Summary Data

24
Mathematics Phase I Pilot Summary Data Grade Number and Percent of Students Achieving Each Score Point Total student N/ % 01234 3 77166737381361928 40.00%34.60%19.30%4.20%1.90%100% 4 79580036087582100 37.90%38.10%17.10%4.10%2.80%100% 5 548513252124441481 37.00%34.60%17.00%8.40%3.00%100% 6 92776826965142043 45.40%37.60%13.20%3.20%0.70%100% 7 89663224362111844 48.60%34.30%13.20%3.40%0.60%100% 8 984791314100512240 43.90%35.30%14.00%4.50%2.30%100% 9-10 79869718645271753 45.50%39.80%10.60%2.60%1.50%100% 11-12 6906021786391542 44.70%39.00%11.50%4.10%0.60%100%

25
Grade Number and Percent of Students Achieving Each Score Point Total Student N / % 01234 3 13781152539121473237 42.57%35.59%16.65%3.74%1.45%100% 4 1323126432583253020 43.81%41.85%10.76%2.75%0.83%100% 5 1351104939164152870 47.07%36.55%13.62%2.23%0.52%100% 6 15791171370135533308 47.73%35.40%11.19%4.08%1.60%100% 7 160285621972362785 57.52%30.74%7.86%2.59%1.29%100% 8 15291049619217883502 43.66%29.95%17.68%6.20%2.51%100% 9 - 12 2570143529959234386 58.60%32.72%6.82%1.35%0.52%100% Mathematics Phase II Pilot Summary Data

26
Key Findings from Pilots: Open-Ended Items Overall performance shortfalls –Students are not familiar with these types of items Many respond “dnk” – as in ‘do not know’ Didn’t know how to approach the items or how to organize (show) their responses/answers –Didn’t seem to understand the need to “show” their work, detail their thoughts, rationales, cite evidence to support their answer or claim Tendency is to cite answer only – as if they were multiple-choice items –Didn’t read carefully and answer all parts of the question –Didn’t answer all parts of questions or label appropriately
 their responses/answers –Didn’t seem to understand the need to show their work, detail their thoughts, rationales, cite evidence to support their answer or claim Tendency is to cite answer only – as if they were multiple-choice items –Didn’t read carefully and answer all parts of the question –Didn’t answer all parts of questions or label appropriately")
27
Where is GCPS Now? Communication through webinars, school visits, cluster meetings, Test Coordinator meetings, weekly updates (C&I and A&A) Instructional Readiness cuts Collaboration with C&I Resources for schools – sample items, anchors, and rubrics Formative Instructional Practices Modules
 Instructional Readiness cuts Collaboration with C&I Resources for schools – sample items, anchors, and rubrics Formative Instructional Practices Modules.")
Similar presentations


, 1:00-3:00 PM September 9, 2014 (Part 2), 1:00-3:00 PM.>")

; formative.>")

; formative assessment tools to complement summative Coherent.>")


 Common Core State Standards and Partnership for.>")
