Download presentation
Presentation is loading. Please wait.

1
Cartography and GIS Understanding the way maps are encoded to be used in GIS requires knowledge of cartography Cartography is the science that deals with the construction, use, and principles behind maps A map is a depiction of all or part of the earth or other geographic phenomenon as a set of symbols and at a scale whose representative fraction is less than one to one

6
Earth to Globe to Map

7
Shape of the Earth We think of the earth as a sphere It is actually a spheroid, slightly larger in radius at the equator than at the poles

8
Models of the Earth The earth can be modeled as a –sphere, –oblate ellipsoid –geoid

9
Geographic Coordinates ( , z) Latitude ( ) and Longitude ( ) defined using an ellipsoid, an ellipse rotated about an axis Elevation (z) defined using geoid, a surface of constant gravitational potential Earth datums define standard values of the ellipsoid and geoid
 Latitude ( ) and Longitude ( ) defined using an ellipsoid, an ellipse rotated about an axis Elevation (z) defined using geoid, a surface of constant gravitational potential Earth datums define standard values of the ellipsoid and geoid")
10
The Spheroid and Ellipsoid The sphere is about 40 million meters in circumference. An ellipsoid is an ellipse rotated in three dimensions about its shorter axis. The earth's ellipsoid is only 1/297 off from a sphere.

11
The Datum An ellipsoid gives the base elevation for mapping, called a datum. Examples are NAD27 and NAD83. The geoid is a figure that adjusts the best ellipsoid and the variation of gravity locally.

12
Representations of the Earth Earth surface Ellipsoid Sea surface Geoid Mean Sea Level is a surface of constant gravitational potential called the Geoid

13
Definition of Elevation Elevation Z P z = z p z = 0 Mean Sea level = Geoid Land Surface Elevation is measured from the Geoid

14
Earth Models and Datums

15
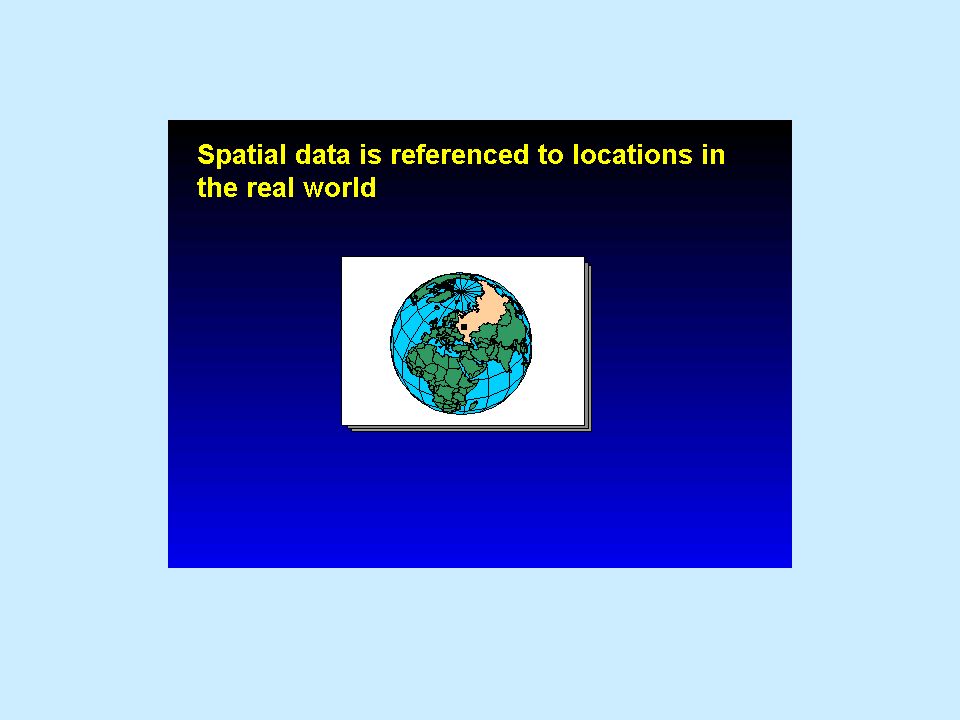
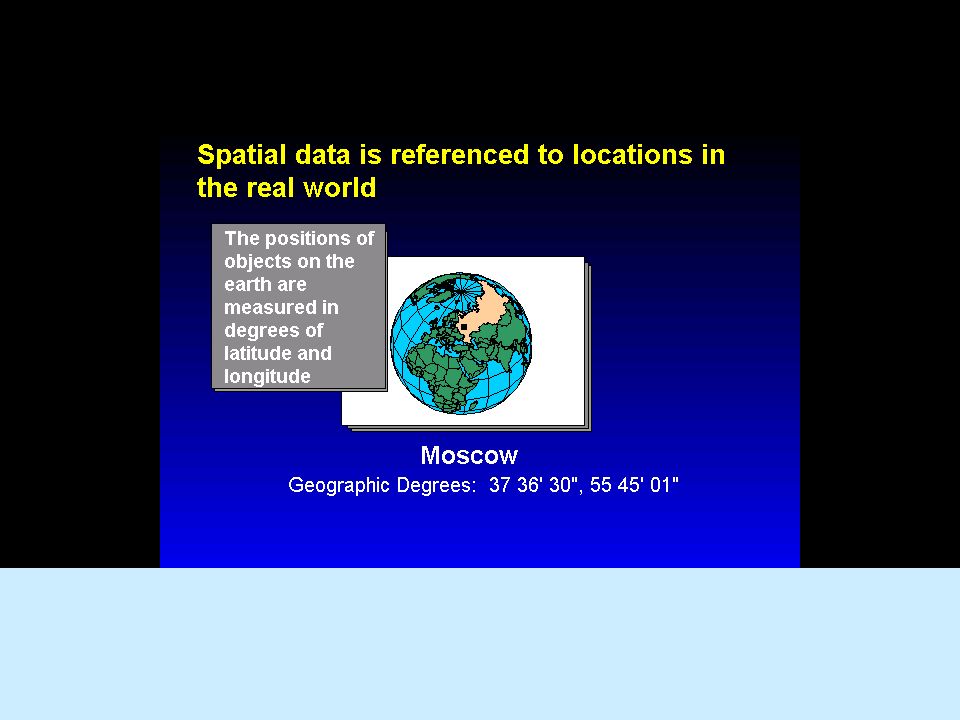
Geographic Coordinates Geographic coordinates are the earth's latitude and longitude system, ranging from 90 degrees south to 90 degrees north in latitude and 180 degrees west to 180 degrees east in longitude. A line with a constant latitude running east to west is called a parallel. A line with constant longitude running from the north pole to the south pole is called a meridian. The zero-longitude meridian is called the prime meridian and passes through Greenwich, England.

16
The most commonly used coordinate system today is the latitude, longitude, and height system. The Prime Meridian and the Equator are the reference planes used to define latitude and longitude. Equator and Prime Meridian

17
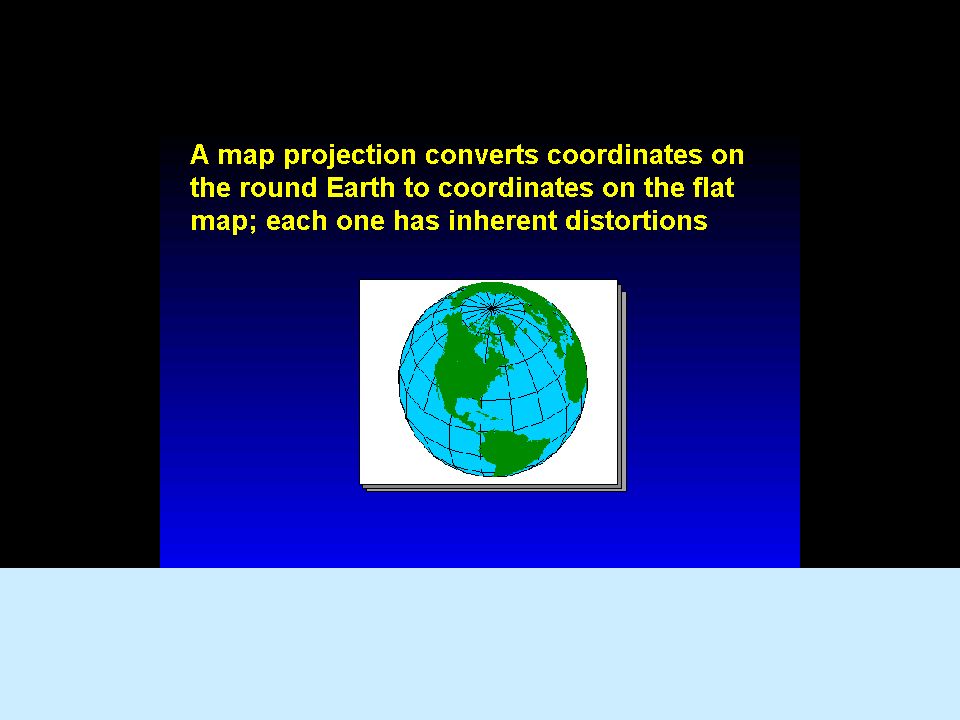
Map Projections A transformation of the spherical or ellipsoidal earth onto a flat map is called a map projection. The map projection can be onto a flat surface or a surface that can be made flat by cutting, such as a cylinder or a cone.

18
Map projections

19
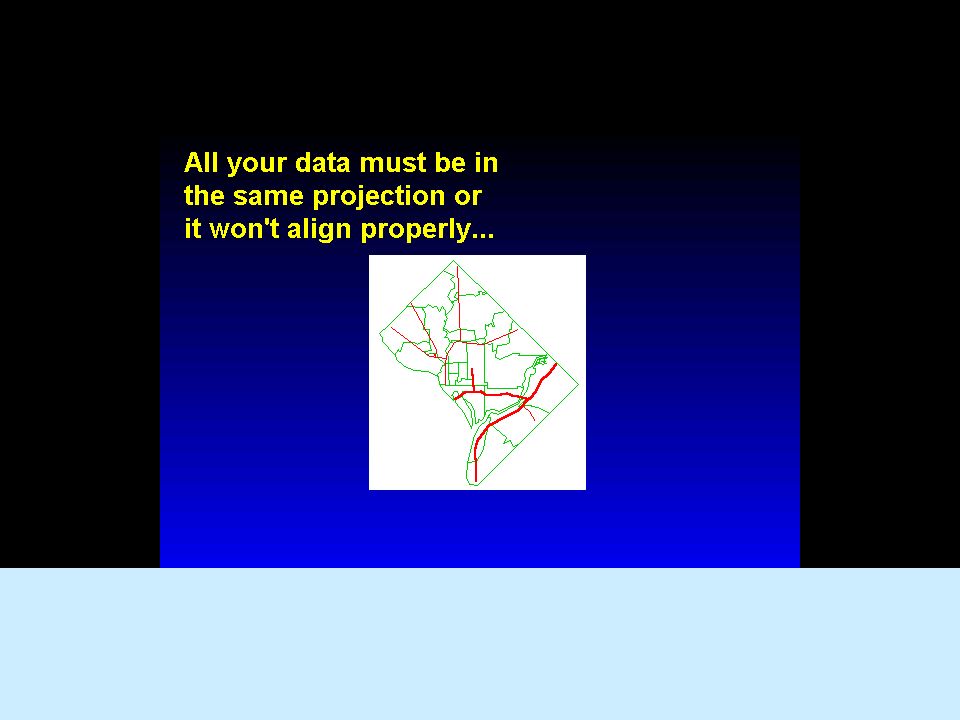
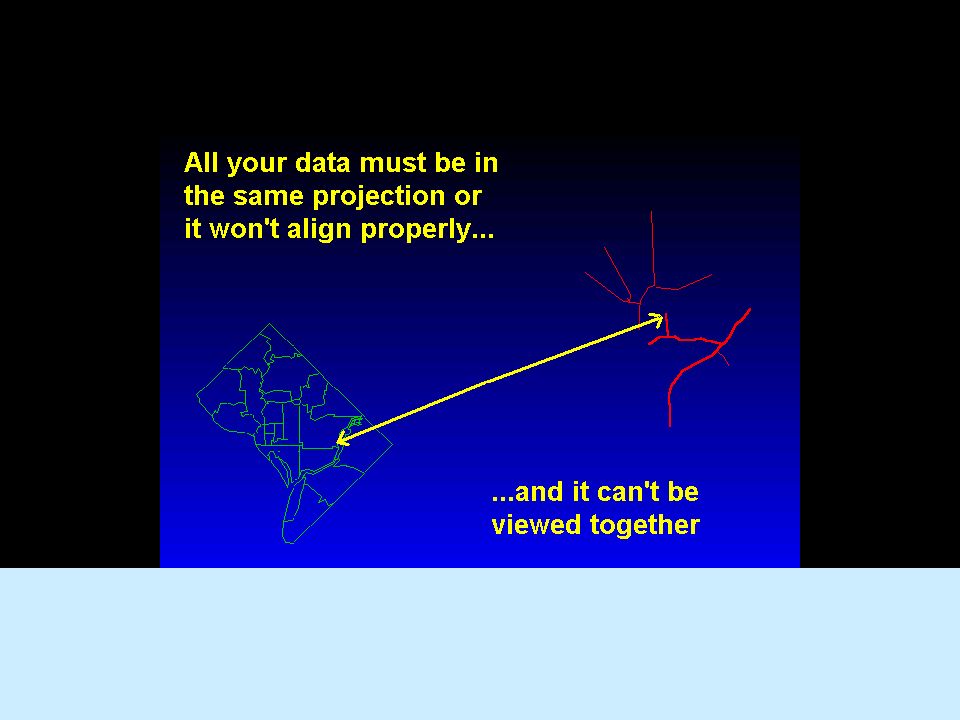
Map Projections (contd) A projection that preserves the shape of features across the map is called conformal. A projection that preserves the area of a feature across the map is called equal area or equivalent. No flat map can be both equivalent and conformal. Most fall between the two as compromises. To compare or edge-match maps in a GIS, both maps MUST be in the same projection.

20
No flat map can be both equivalent and conformal.

21
Coordinate Systems for the US Some standard coordinate systems used in the United States are –geographic coordinates –universal transverse Mercator system –military grid –state plane To compare or edge-match maps in a GIS, both maps MUST be in the same coordinate system.

22
GIS Capability A GIS package should be able to move between –map projections, –coordinate systems, –datums, and –ellipsoids.

23
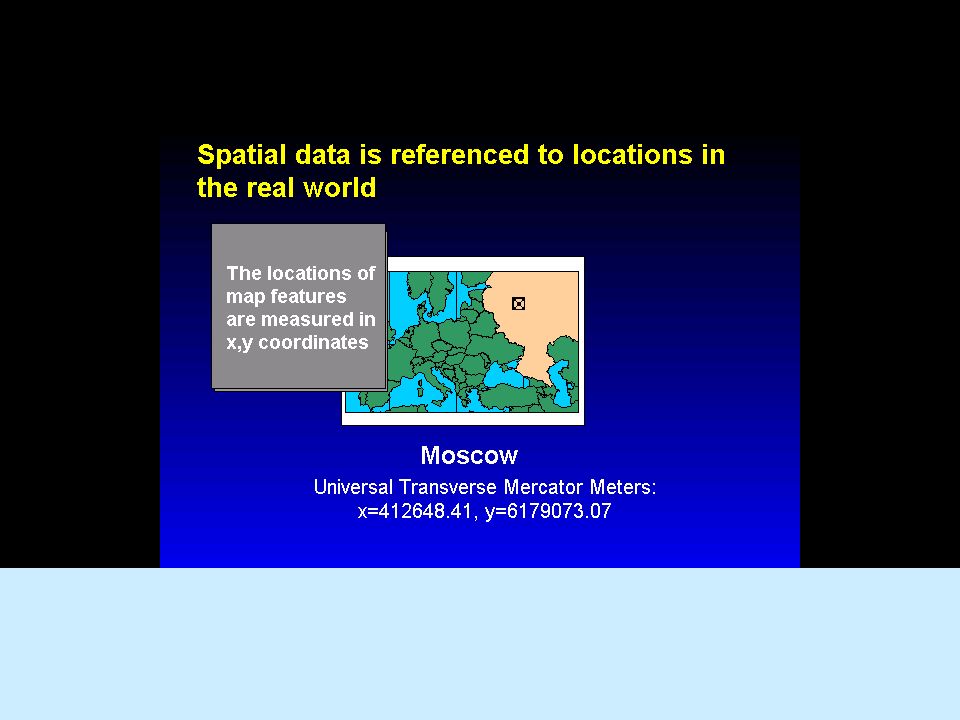
Universal Transverse Mercator (UTM) Universal Transverse Mercator (UTM) coordinates define two dimensional, horizontal, positions. Each UTM zone is identified by a number. UTM zone numbers designate individual 6° wide longitudinal strips extending from 80° South latitude to 84° North latitude. Alabama is in UTM Zone 16

24
Universal Transverse Mercator Projection – UTM Zones for the U.S.

25
“Standard” Projections An infinite number of projections Projections preserve specific geometric properties, over a limited area Governments (and other organizations) define “standard” projections to use Imposes uniformity, facilitates data exchange, provides quality control, establishes limits on geometric distortion.
 define standard projections to use Imposes uniformity, facilitates data exchange, provides quality control, establishes limits on geometric distortion.")
26
State plane systems were developed in order to provide local reference systems that were tied to a national datum. In the United States, the State Plane System 1927 was developed in the 1930s and was based on the North American Datum 1927 (NAD_27). NAD_27 coordinates are in English units (feet). STATE PLANE COORDINATE SYSTEMS
. NAD_27 coordinates are in English units (feet). STATE PLANE COORDINATE SYSTEMS.")
27
State Plane Coordinate System Each state partitioned into zones Each zone may have a different projection specified Distortion in surface measurement less than 1 part in 10,000 within a zone California State Plane Zones

28
State Plane Coordinate Systems Use Lambert conformal conic (LCC) and Transverse Mercator (TM, cylindrical)* LCC when long dimension East-West TM when long dimension N-S May be mixed, as many zones used as needed *The only exception is one State Plane zone in Alaska which uses an Oblique Mercator projection for a thin diagonal area.
 and Transverse Mercator (TM, cylindrical)* LCC when long dimension East-West TM when long dimension N-S May be mixed, as many zones used as needed *The only exception is one State Plane zone in Alaska which uses an Oblique Mercator projection for a thin diagonal area.")
29
Most USGS 7.5 Minute Quadrangles show several coordinate system grids including latitude and longitude, UTM kilometer tic marks, and applicable State Plane coordinates.

30
Map Projections Summary Projections specify a two-dimensional coordinate system from a 3-D globe All projections cause some distortion Errors are controlled by choosing the proper projection type, limiting the area applied There are standard projections Projections differ by datum – know your parameters

34
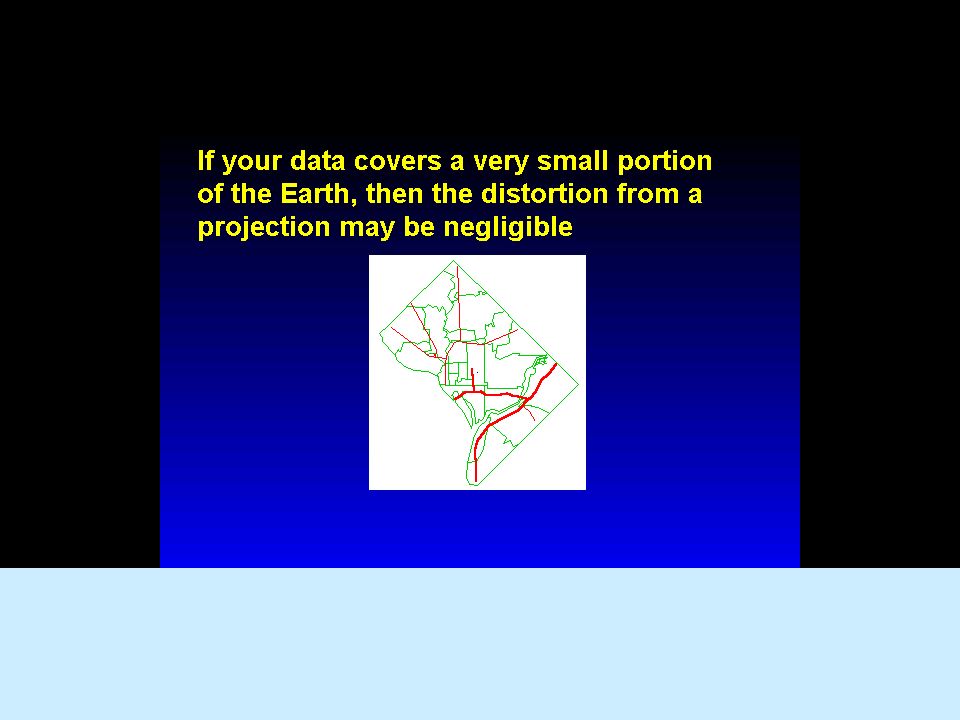
Also realize that using the “appropriate” projection depends on your objectives for displaying and analyzing the map data

35
Undistorted distance measurement is 2451 miles Shapes are distorted, but ArcView computes distance from spherical coordinates of latitude and longitude, taking the earth’s round surface into account No projection

36
Distance = 3,142 miles…691 miles further Changing to the Mercator projection shows shapes and direction accurately, but sacrifices distance and area. Mercator projection

37
Distance = 2,238 … about 213 miles less than actual Peters Equal-Area Cylindrical projection preserves area but sacrifices shape, distance, and direction. Peters Equal-Area Cylindrical projection

38
Equidistant Conic (Coterminous U.S.) Distance = 2,452 (almost the same as original) Projection preserves shape and accurate east-west distances, but sacrifices direction and area
 Distance = 2,452 (almost the same as original) Projection preserves shape and accurate east-west distances, but sacrifices direction and area")
39
Equidistant Conic (Coterminous U.S.) Peters Equal-Area Cylindrical projection Mercator projection No projection Distance = 2,452 (almost the same as original) Projection preserves shape and accurate east-west distances, but sacrifices direction and area Distance = 2,238 … about 213 miles less than actual Peters Equal-Area Cylindrical projection preserves area but sacrifices shape, distance, and direction. Distance = 3,142 miles…691 miles further Changing to the Mercator projection shows shapes and direction accurately, but sacrifices distance and area. Undistorted distance measurement is 2451 miles Shapes are distorted, but ArcView computes distance from spherical coordinates of latitude and longitude, taking the earth’s round surface into account

40
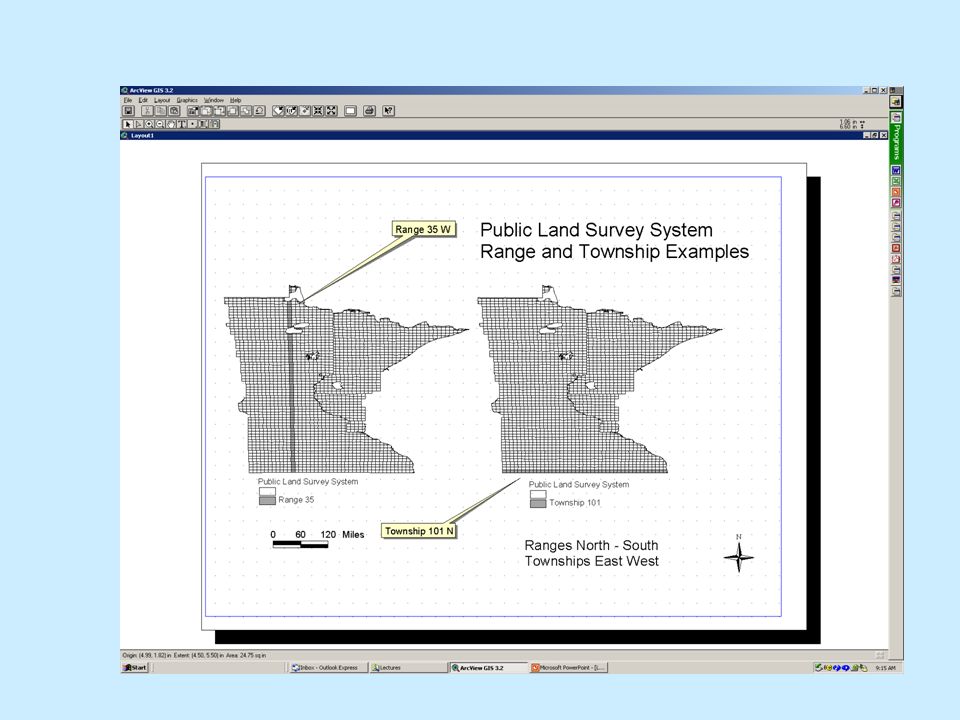
Source:http://www.ca.blm.gov/cadastral/meridian.html The non-Coordinate System: The Public Land Survey System

41
Source:http://www.ca.blm.gov/cadastral/meridian.html PLSS – a method of defining parcels by successive subdivision

43
Source:http://feature.geography.wisc.edu/sco/geodetic/geodetic_graphics/Township_Big.jpg 36 sections in a Township, each approximately a mile square. Note the zig-zag numbering scheme

44
Source:http://feature.geography.wisc.edu/sco/geodetic/geodetic_graphics/Township_Big.jpg Sections may be further subdivided

45
Metes and Bounds Used in many of the Eastern and Southeastern States. Also used for land titles and transactions. Descriptions have: A point of beginning,definite corners, lengths and directions of the property sides, names of adjoining property owners and area. * * Source:http://feature.geography.wisc.edu/sco/geodetic/plss.html

46
Metes and Bounds Example description: That part of the SW 1/4 of the NW 1/4 of Section 28, T 22 N, R 11 E, Town of Little Wolf, Brock County, Wisconsin, described as follows: Commencing at a stone monument at the W 1/4 corner of said Section 28; thence N45d00'E, 400.00 feet along the Southerly R/W line of Lake Street to a 1" iron pipe at the point of beginning of this description, said point also being the point of curvature of a curve to the right having a central angle of 90d00' and radius of 300.00 feet; thence Easterly, 471.24 feet along the arc of the curve, the long chord of which bears East, 424.26 feet, to a 1" iron pipe at the point of tangency thereof, said arc also being the aforesaid Southerly R/W line of Lake Street; thence continuing along the Southerly R/W line of Lake Street, S45d00'E, 150.00 feet to a 1" iron pipe; thence S45d00'W 200.00 feet to a 1" iron pipe located N45d00"E, 20 feet, more or less, from the water's edge of Green Lake, and is the beginning of the meander line along the lake; thence West 141.42 feet along the said meander line to a 1" iron pipe at the end of the meander line; said pipe being located N45d00'W, 20 feet, more or less from the said water's edge; thence N45d00'W, 350.00 feet to a 1" iron pipe at the point of beginning... including all lands lying between the meander line herein described and the Northerly shore of Green Lake, which lie between true extensions of the Southeasterly and Southwesterly boundary lines of the parcel herein described, said parcel containing 2.54 acres, more or less. Bearings are based on astronomic north. Source: Elementary Surveying, Wolf and Brinker, Ninth Edition, 1994 http://feature.geography.wisc.edu/sco/geodetic/plss.html

Similar presentations


 Francisco Olivera, Ph.D., P.E. Center for Research in Water Resources University of Texas at Austin.>")


 Francisco Olivera, Ph.D., P.E. Center for Research in Water Resources University of Texas at Austin.>")


