Download presentation
Presentation is loading. Please wait.

1
Environmental Protection Agency Region III Office of State & Watershed Partnerships Region 3 Non-Point Source Program Evaluation and Performance Metrics May 12, 2009

2
Grant Evaluation Metric Score Card Report % Money Spent Mandated Elements % Increm %Comp./Acc ep % Evaluations* % Status* % Georef AVG DC83.6658796895310070 DE84.0671825653994157 MD72.6986100971009910083 PA70.3285829483729673 VA74.287749483979175 WV70.4383787621998663

5
National Drawdown R316,774,00015,970,15895% DC1,205,9001,857,004154% DE1,384,6001,899,948137% MD2,575,8002,238,08087% PA5,680,0003,888,14768% VA3,800,1003,932,069103% WV2,127,6002,154,910101%

6
Projects Completed and Accepted by EPA Years 2003 to 2008

7
Percent of Incrementally Funded Projects with BMPs (Years 2005 to 2008)
")
8
Projects With Appropriately Dated Evaluations (Evaluations To Dec 31, 2008)
")
9
Projects With Appropriately Dated Status (Status To Dec 31, 2008)
")
10
State % of Projects With Georeference DC100.00 DE40.91 MD100.00 PA95.83 VA91.18 WV86.36 Completed Projects that are Georeferencable 2004 – 2007

11
Spatial Locational Report Percent of Projects with HUC 12s and Stream Reach Codes (SRCs)
")
13
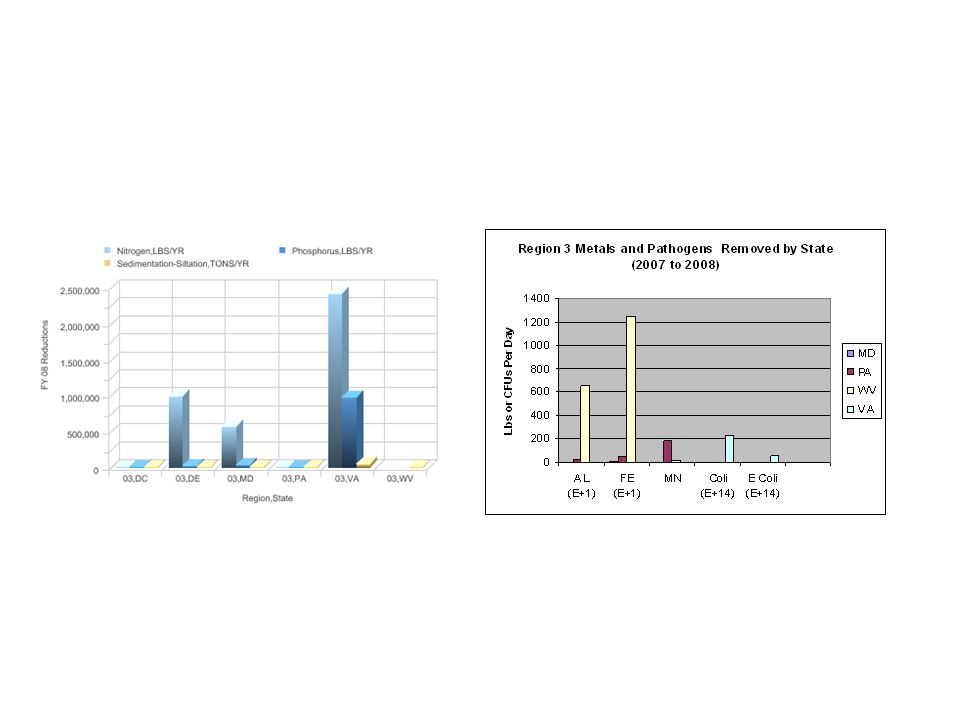
FY 08 Nitrogen Load Reduction by Region Region 3

14
FY 08 Phosphorus Load Reduction by Region Region 3

15
FY 08 Sedimentation Load Reduction by Region

Similar presentations


 – SA2009 - $530,000 + (startup costs) For FY 2011 are under required.>")

 Billing & Collection Working Group (B&C WG) December 13, 2012 Co-Chairs: Tim Decker, Verizon Rosemary Emmer, Sprint.>")
 Relationship to other SF Bay efforts.>")


>")


 1990 1991 1992 1993 1994 1995 1996 1997 1998 1999 2000 2001 2002 2003 2004 2005 2006 2007 2008 2009 2010 2011 Issue date National Student.>")

