Download presentation
Presentation is loading. Please wait.

1
Testing the LibQUAL+ Survey Instrument James Shedlock, AMLS, Dir. Linda Walton, MLS, Assoc. Dir. Galter Health Sciences Library Northwestern University

2
Testing the LibQUAL+ Survey Instrument A presentation for the Midwest Chapter-Medical Library Association Annual Meeting Minneapolis, Minnesota Sept. 27-Oct. 1, 2002

3
Goals To introduce the LibQUAL+ survey as a tool for measuring the quality of library service To demonstrate application of LibQUAL+ in an academic health sciences library To show how LibQUAL+ results can be used

4
Outline Background Participating in LibQUAL+, 2001 and 2002 Results Discussion Conclusion Reference … for further reading

5
Background: LibQUAL+ What is LibQUAL+

6
Background: LibQUAL+ LibQUAL+ is a survey instrument first developed at Texas A&M University Libraries, now supported by Dept. of Education grants in collaboration with the Association of Research Libraries (ARL).
..")
7
Background: LibQUAL+ LibQUAL+ derives from the SERVQUAL instrument, tested in several business industries, and proven to work. SERVQUAL theory: “Only users can determine quality.” Quality measured in gaps, between minimum expectations and perceived service LibQUAL+ has undergone several tests to refine the tool for accuracy. The 2002 test involved 128 U.S. libraries and 78,000 participants.

8
Background: LibQUAL+ LibQUAL+ currently tests for quality in four dimensions (2002 test): access to info, personal control, library as place, affect of service. LibQUAL+ employs three levels of user response: minimum, desired and perceived service levels. LibQUAL+ uses a nine-point scale, measuring low to high.

9
Background: Galter Library Galter Library (GHSL) participated in the 2001 and 2002 tests. GHSL was only stand-alone academic medical library in 2001 test; no true peer group for benchmarks. GHSL among 36 academic medical libraries in the 2002 test (supported by NLM, AAHSL and individual libraries).
..")
10
Background: Galter Library Motivation for participating in LibQUAL+: Evaluating services part of strategic plan Easy way to meet goals, learn more about users Wanted to be on the cutting edge for measuring quality As AAHSL Annual Stats editor, needed to learn how to measure quality Relatively low cost

11
Participating in LibQUAL+ Fully web automated Reliance on email communication Need access to users email addresses; use bulk mail, lists, listservs, etc. Consider all users or a sample At Galter, all users with email known to med school were solicited.

12
Participating in LibQUAL+ Sample questions … Complete run of journals; Comprehensive print collections; Enabling website; Comfortable, inviting location; Willingness to help; Consistently courteous 5 special questions in 2002 for AAHSL libraries “When it comes to … [complete runs of journal titles] … my minimum service level is … my desired service level is … perceived service performance is …
![Participating in LibQUAL+ Sample questions … Complete run of journals; Comprehensive print collections; Enabling website; Comfortable, inviting location; Willingness to help; Consistently courteous 5 special questions in 2002 for AAHSL libraries When it comes to … [complete runs of journal titles] … my minimum service level is … my desired service level is … perceived service performance is …](http://images.slideplayer.com/33/7579315/slides/slide_12.jpg "Participating in LibQUAL+ Sample questions … Complete run of journals; Comprehensive print collections; Enabling website; Comfortable, inviting location; Willingness to help; Consistently courteous 5 special questions in 2002 for AAHSL libraries When it comes to … [complete runs of journal titles] … my minimum service level is … my desired service level is … perceived service performance is …")
13
Results See sample web form: When it comes to…My Minimum Service Level Is low high My Desired Service Level Is low high Perceived Service Performance Is low high N/A 1)Willingness to help users 1 2 3 4 5 6 7 8 9 N/A 2)Space that facilitates quiet study 1 2 3 4 5 6 7 8 9 N/A 3)Complete runs of journal titles 1 2 3 4 5 6 7 8 9 N/A
Willingness to help users N/A 2)Space that facilitates quiet study N/A 3)Complete runs of journal titles N/A")
14
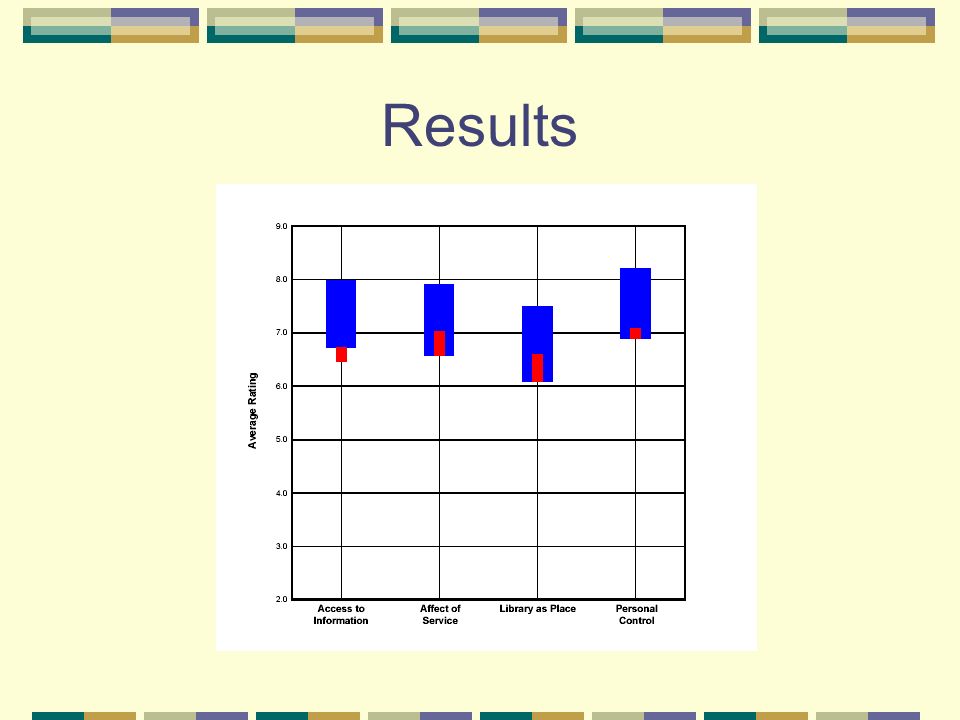
Results Scoring Average scores for each question, for each user group, for each parameter (minimum, desired, perceived) Gap scores = perceived – minimum Graphs Radar graphs – shows total results, by aggregate and group Zone of tolerance – shows dimensions General satisfaction Percentile within normative group
 Gap scores = perceived – minimum Graphs Radar graphs – shows total results, by aggregate and group Zone of tolerance – shows dimensions General satisfaction Percentile within normative group")
15
Results

17
Participation: 2001 3,575 surveys sent 476 responses 13.3% return rate 2002 3,819 surveys sent 457 responses 12% return rate

18
Results Age, gender changed little from 2001 to 2002 results Group participation … Group20012002 Faculty164, 34%99, 24% Staff186, 39%120, 28% Students126, 27%198, 47%

19
Results Aggregate – sample gap scores: 2001 Negative gaps Comprehensive print collections: -0.21 Complete run of journals: -0.31 Convenient business hours: -0.35 Positive gaps Attractive facility: 2.21 Employees who enjoy what they do: 1.41 Library focus on here and now: 1.38

20
Results Sample score: 2001 Comprehensive print collections Minimum score: 6.45 Desired: 7.92 Perceived: 6.25 6.25 – 6.45 = -0.20

21
Results Aggregate – sample gap scores: 2002 Negative gaps Complete run of journals: -0.36 Convenient business hours: -0.68 Making e-resources accessible: -0.09 Positive gaps Comfortable, inviting location: 0.74 [staff] willingness to help users: 0.66 [staff] giving uses individual attention: 0.65
![Results Aggregate – sample gap scores: 2002 Negative gaps Complete run of journals: Convenient business hours: Making e-resources accessible: Positive gaps Comfortable, inviting location: 0.74 [staff] willingness to help users: 0.66 [staff] giving uses individual attention: 0.65](http://images.slideplayer.com/33/7579315/slides/slide_21.jpg "Results Aggregate – sample gap scores: 2002 Negative gaps Complete run of journals: Convenient business hours: Making e-resources accessible: Positive gaps Comfortable, inviting location: 0.74 [staff] willingness to help users: 0.66 [staff] giving uses individual attention: 0.65")
22
Results User group summary for 2002: Faculty Timely document delivery: -0.01 Interdisciplinary needs: -0.05 Comfortable, inviting location: 1.09 Contemplative environment: 0.89 Employees who instill confidence: 0.86

23
Results User group summary for 2002: Staff No negative scores Comfortable, inviting location: 1.64 Convenient access to collections: 1.18 Contemplative environment: 1.10

24
Results User group summary for 2002: Students Convenient business hours: -1.80 Space facilitating quiet study: -0.51 Complete run of journals: -0.32 Place for reflection, creativity: 0.65 Willingness to help users: 0.61 Comfortable, inviting location: 0.50

25
Discussion Learn what to fix! These are the users’ issues with the library – listen to them, even if you disagree. “The customer is always right!” Good insight for very little effort. Do once a year, notice change in scores.

26
Discussion Follow-up: use gap scores in conjunction with other data. Gap scores are but one piece of data for evaluating library services. Study users’ comments (new in 2002). Review AAHSL Annual Stats for quantitative data, benchmarks Consider using focus groups to listen to users; e.g., ask faculty how they interpret LibQUAL+ questions What do your users think about quality?
. Review AAHSL Annual Stats for quantitative data, benchmarks Consider using focus groups to listen to users; e.g., ask faculty how they interpret LibQUAL+ questions What do your users think about quality .")
27
Conclusion Incorporate into strategic plan Easy to do Considering a third survey if we can make change happen Potential to be a powerful tool for the library profession, especially in time of change Future: under consideration at ARL

28
Reference For more information about LibQUAL+, see: www.arl.org/libqual Look closely at About (FAQs) and Publications (bibliography).
 and Publications (bibliography).")
Similar presentations