Download presentation
Presentation is loading. Please wait.

1
4/30-5/1 2 nd period- review the power point – Galapagos questions? 2 nd, 5 th, 7 th = have evodots out Presentations! Review Natural selection Evidence of evolution project (due at end of class) HW: Natural selection WS
 HW: Natural selection WS.")
2
Review Evo-Dots & The “rules” of natural selection. So, what does this simulation show us? Review KEY POINTS

3
Natural Selection Abridged Everyone wants to reproduce They don’t They can’t There is competition Individuals are different*** Differences are hereditary*** The individuals with the best genes win The best genes become more common *** major differences from Lamarck

4
Rule 1. the trait is heritable & passed to offspring

5
Natural Selection Rule 2-Variation must exist (mutations, changes in gene expression, sexual reproduction) Even slight advantages in reproduction cause populations to change So small changes are constantly occurring
 Even slight advantages in reproduction cause populations to change So small changes are constantly occurring")
6
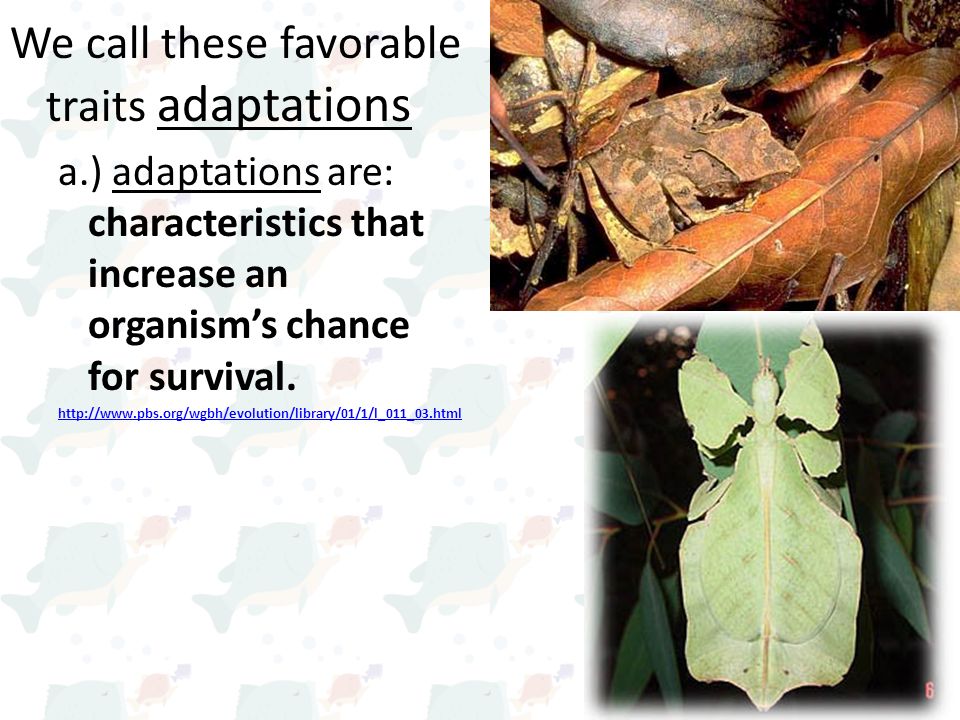
We call these favorable traits adaptations a.) adaptations are: characteristics that increase an organism’s chance for survival. http://www.pbs.org/wgbh/evolution/library/01/1/l_011_03.html
7
Traits that help individuals survive and reproduce become more common Complex traits take a long time A) The ability of an organism to survive and reproduce in its environment is called its fitness.
 The ability of an organism to survive and reproduce in its environment is called its fitness.")
8
a.) “Survival of the Fittest” - individuals that are best suited to their environment will survive and reproduce more often. a.) not “strong” just better adapted.
 not strong just better adapted..")
9
Example

10
What is Advantageous Depends on the Environment (3 rd rule selective) White moths were common in London before industrial evolution After- soot covers most of the city and black moths become common
 White moths were common in London before industrial evolution After- soot covers most of the city and black moths become common")
11
Example

12
How do we know this is plausible? We have created many new species by selecting which ones reproduce

13
Subtlety in Natural Selection Individuals don’t necessarily TRY to survive or reproduce Genes that contribute to success become common, but genes must already be present New traits come from mutations

14
Natural Selection and Spider Reproduction In some spider species the male leaps into the jaws of the female He is killed and eaten but his sperm reaches the female Genes that contribute to this behavior have become common because they get passed on

15
Is Evolution Random? NO! Mutations are random, but which mutations become common are not Like saying the design of Medicines are random.

16
Remember: Natural Selection can only be observed as changes in a population over many generations. http://evolution.berkeley.edu/evolibrary/article/_0/evo_25 Evo/pbs http://www.pbs.org/wgbh/evolution/library/11/2/e_s_4.htmlhttp://www.pbs.org/wgbh/evolution/library/11/2/e_s_4.html

17
The Evidence for Evolution In Class research & presentation creation (~40 minutes) Presentation next class (stay after school if you need to finish. Do not leave the completion to 1 person!) SHARE the power point with me on google drive. (Allow me edits) CONFIRM I received it and it opens. BEFORE YOU LEAVE DO A MURKIE! HW: Natural selection WS
 SHARE the power point with me on google drive. (Allow me edits) CONFIRM I received it and it opens. BEFORE YOU LEAVE DO A MURKIE. HW: Natural selection WS.")
18
5/2-5/5 1- check in HW- –please review your answers with your table mates –Questions on the HW? –PAPERS BACK! (2 nd period) 2- presentations: evidence for evolution –Take notes and ask questions! 3-Begin next section of evolution Please do a murkie today! HW- Quiz: History, natural selection, evidence
 2- presentations: evidence for evolution –Take notes and ask questions. 3-Begin next section of evolution Please do a murkie today. HW- Quiz: History, natural selection, evidence.")
19
Presentations Make sure you are taking notes! If you feel like you don’t understand…ask questions. This information is in he book if you want more information. Email me if you have a question. Finally, there is an optional worksheet on- line about evidence for evolution.

20
DNA and Variation in a POPULATION Recall GENES which are segments of DNA that code for a protein which then becomes a trait. Since variation is the result of different alleles, we can measure this change by measuring changes in allele frequency which in turn cause changes in the frequency of genotypes and thus phenotypes. What would that look like if we could watch it happen???

21
Takin’ a dip in the gene pool! Or…Changes in Allele frequencies and the effects on a population simulation! This scenario will take a minimum of a block. You will start today and will have HW depending on different factors…

22
HW due 5/6(A)-7(B) Part A: –Allele freq –Graph –Questions for part A only
-7(B) Part A: –Allele freq –Graph –Questions for part A only")
23
5/6-7 Quiz After quiz Have out Part A –review with your table –Questions? Today part B - C HW 5/8-9- part B-C

24
PART C: graph –Please use a ruler. –Have axis labeled with unit –Have a title –Bar graph –Have scale out of 1.0 You will be graded on this one for detail. You will turn in AFTER we discuss.

25
5/8-9 Presentations Have Frequency Allele packet on desk for check in (only questions). Have frequency Allele Discussion HW worksheet out for me to check in. Papers back- want to know what it was out of? Check the HW web site Mini Lecture- allele frequencies take notes Class Work: Practice allele frequencies Start the homework: bookwork worksheet due Tuesday 5/14 QUIZ Thursday 5/16

26
Allele Frequencies review I.As we learned in our allele frequency simulation, populations that are not evolving are said to be in equilibrium. A.This means that allele frequencies for traits are not changing from one generation to the next in a population. 1.For this (no change in allele frequencies) to occur in a population, 5 conditions must be met. They are:
 to occur in a population, 5 conditions must be met. They are:.")
27
a)Random Mating: All members of a population have equal opportunity to produce offspring and thus an equal chance of passing on alleles. b)Large Population c)No movement in or out of a population: Individuals bring new alleles into the gene pool. d)No mutation: Can introduce new alleles and change the relative frequency. e)No natural selection: All of the genotypes must have an equal probability of survival, thus no phenotype can have an advantage. 2.) If any of these are not met: allele frequencies change and the population is EVOLVING.
Large Population c)No movement in or out of a population: Individuals bring new alleles into the gene pool. d)No mutation: Can introduce new alleles and change the relative frequency. e)No natural selection: All of the genotypes must have an equal probability of survival, thus no phenotype can have an advantage. 2.) If any of these are not met: allele frequencies change and the population is EVOLVING..")
28
Sickle cell http://www.pbs.org/wgbh/evolution/library/ 01/2/l_012_02.htmlhttp://www.pbs.org/wgbh/evolution/library/ 01/2/l_012_02.html

29
B.) In addition to the idea of equilibrium that Hardy and Weinberg proposed, they also came up with an equation that allows us to not only calculate allele frequencies but also predict frequencies!
 In addition to the idea of equilibrium that Hardy and Weinberg proposed, they also came up with an equation that allows us to not only calculate allele frequencies but also predict frequencies!")
30
1.) The Hardy-Weinberg Equation: p = dominant allele frequency q = recessive allele frequency p + q = 1 1 – q = p1 – p = q p 2 + 2pq + q 2 = 1 Godfrey Hardy (1877-1947) English Mathematician Wilhelm Weinberg (1862-1937) German Physician http://anthro.palomar.edu/synthetic/synth_2.htm
 The Hardy-Weinberg Equation: p = dominant allele frequency q = recessive allele frequency p + q = 1 1 – q = p1 – p = q p 2 + 2pq + q 2 = 1 Godfrey Hardy ( ) English Mathematician Wilhelm Weinberg ( ) German Physician")
31
Answer to Question 2.) 30% (or 0.30) of the population is homozygous recessive. q 2 = 0.3 Sq Root of 0.3 = 0.55 The frequency of the recessive allele is 0.55 To find p? 1 - q = p 0.55 – 1 = 0.45 The frequency of dominant allele is 0.45

32
3.) Notice that the Hardy-Weinberg Equation allows us to figure out genotype and allele frequencies. With this information, we can look at the change in allele frequencies over time in a population and gather numerical data on EVOLUTIONARY CHANGE! H-W frequency allele practice - complete in class. You may ask your table for help and me

33
How does genetics redefine evolution? 1. In genetic terms: any change in the relative frequencies of alleles in a population’s gene pool over successive generations. a. If allele frequencies change, then genotype frequencies change and we should SEE a change in phenotype in a population.

34
Start the homework: bookwork worksheet due Tuesday 5/14

36
5/14 Have book work out Review 1 st ½ of block: Lecture/video clips 2 nd ½ block: species! What does it REALLY mean???

37
REVIEW! Where are we in Evolution and how did we get here??? 1. Misconceptions of Evolution 2. Brief history of theory development. 3. Natural Selection & how it works. 4. Evidence for Evolution –Fossils, biochemistry, comparative anatomy, artificial selection 5. Population Genetics –Allele frequency, genetic equilibrium & H-W equations

38
What’s Next? Factors that Affect a gene pool: –Variation: Mutations, sexual recombination + crossing over –Population size: bigger is better! –Genetic drift Bottle neck & Founders effect –Gene flow –Sexual selection MicroEvolution: –Types of Natural Selection –Speciation!!!

39
I.) Sources of Variation in Populations’ Gene Pools A.) mutation - any change in organisms’ DNA. Some can change an organism’s phenotype and this can affect its fitness (positively OR negatively).
..")
40
B.) Gene “Shuffling” during Meiosis 1.) independent assortment: Chromosomes line up independently of each other. a.) This can result in different phenotypes as alleles are put in different combinations in different gametes. 2.) Crossing over - exchange of genes between homologous chromosomes. a.) Again, this results in many different allele combinations and possibly different phenotypes.
 This can result in different phenotypes as alleles are put in different combinations in different gametes. 2.) Crossing over - exchange of genes between homologous chromosomes. a.) Again, this results in many different allele combinations and possibly different phenotypes..")
41
C.) Be Aware! Sexual reproduction does not change the frequency of alleles in a gene pool, it just mixes them around and this can produce new phenotypes. (This is just like shuffling a deck of cards!)
.")
42
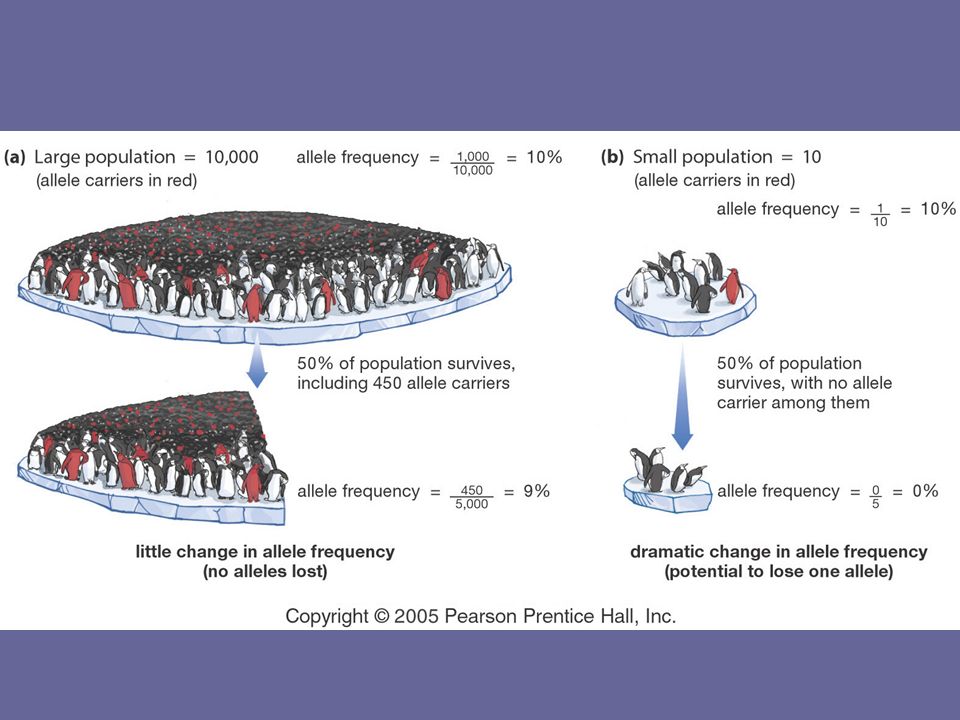
Large population: –A larger population has more variation. –It is better able to cope with lose of individuals especially on a large scale. Lose ½ of 10,000 vs lose ½ of 1000.

44
A.) Genetic Drift - random changes in allele frequency in small populations. 1.) Individuals that carry a particular allele may leave more offspring by chance. Think probability: over time, this can cause an allele to become more common in a population.
 Individuals that carry a particular allele may leave more offspring by chance. Think probability: over time, this can cause an allele to become more common in a population..")
45
2.) This can occur due to: a.) Founders effect: when a small group of organisms founds a new population, they many have different relative frequencies of alleles than the larger population they came from. i.) If so, the population they start can be quite different from their original population.
 If so, the population they start can be quite different from their original population..")
46
Sample of Original Population Founding Population A Founding Population B Descendants Section 16-2

47
b.) Bottleneck effect: occurs when a small population is left behind after a disaster/disturbance and has different relative frequencies than original population.
 Bottleneck effect: occurs when a small population is left behind after a disaster/disturbance and has different relative frequencies than original population.")
49
C.) Gene flow: the movement of alleles from one population to another – due to immigration/emigration.
 Gene flow: the movement of alleles from one population to another – due to immigration/emigration.")
50
B.) Nonrandom mating which can be termed sexual selection. 1.) Individuals in population choose mates based on certain traits. http://www.pbs.org /wgbh/evolution/l ibrary/01/6/l_016 _09.html
 Individuals in population choose mates based on certain traits. /wgbh/evolution/l ibrary/01/6/l_016 _09.html.")
51
D.) Review: a change in genes (allele freq) that produces a phenotype that is favorable (increases fitness) in a particular environment leads to natural selection (survive or not in that env) and thus Evolution!
 Review: a change in genes (allele freq) that produces a phenotype that is favorable (increases fitness) in a particular environment leads to natural selection (survive or not in that env) and thus Evolution!")
52
Before we move onto the next topic take a 5 minute break.

53
Types of Natural Selection A.) Most traits are polygenic: controlled by many genes. 1.) These traits therefore have a normal distribution and a characteristic shape when phenotypes are graphed.
 These traits therefore have a normal distribution and a characteristic shape when phenotypes are graphed..")
54
Ex: Height in Humans

55
WS Inferring information from Data –On your own with JUST YOUR BRAIN (so everything off your desk & no discussion) complete the 3 scenarios. When you are done flip your paper over. –Compare answers & discuss

56
B.) Natural Selection can change this normal distribution in 3 ways: 1.) Directional Selection: individuals at one end of the curve have higher fitness than individuals at the middle or other end.
 Natural Selection can change this normal distribution in 3 ways: 1.) Directional Selection: individuals at one end of the curve have higher fitness than individuals at the middle or other end.")
57
Directional Selection Food becomes scarce. Key Low mortality, high fitness High mortality, low fitness Ex: Beak Size of finches

58
2.) Stabilizing Selection: individuals at the center of the curve have higher fitness.
 Stabilizing Selection: individuals at the center of the curve have higher fitness.")
59
Key Percentage of Population Birth Weight Selection against both extremes keep curve narrow and in same place. Ex: Normal weight human babies vs. high or low birth weight. Section 16-2 Low mortality, high fitness High mortality, low fitness Stabilizing Selection

60
3.) Disruptive Selection: individuals at both ends of the curve have higher fitness than individuals in the middle.
 Disruptive Selection: individuals at both ends of the curve have higher fitness than individuals in the middle.")
61
Disruptive Selection Largest and smallest seeds become more common. Number of Birds in Population Beak Size Population splits into two subgroups specializing in different seeds. Beak Size Ex: Food goes from medium size seeds to large and small seeds. Birds with small & large beaks are now favored. Number of Birds in Population Key Low mortality, high fitness High mortality, low fitness

62
http://wps.prenhall.com/wps/media/objects /1110/1136802/17_3.htmlhttp://wps.prenhall.com/wps/media/objects /1110/1136802/17_3.html

63
In broader terms, these changes from generation to generation can result in speciation: the formation of new species. a. This can be thought of as descent with modification. b. Through change from generation to generation, one species may separate into two. c. This idea implies that ALL life originated from a common ancestor with speciation occurring over and over again!

64
Today you will complete a web quest on Speciation. You have class time to complete it & then we’ll review. HW: for Thursday –Quiz: evidence for evolution (the packet from class), wp #3 14.4, wp #4 15.1 & wp #5 book work guided questions & allele frequency
, wp #3 14.4, wp # & wp #5 book work guided questions & allele frequency.")
Similar presentations


 How many phenotypes are.>")


