Download presentation
Presentation is loading. Please wait.

1
An EMS Medley August 8, 2008

2
Agenda Background Case Studies Key Findings

3
EMS Projects 2001-2008 Edmonton Single Start Station – Simulation Station Location – St Albert Performance Improvement – Calgary Flexing/SSM/Redeployment – Edmonton/Calgary Regionalization – Calgary & Edmonton Regions Call Forecasting – Seattle

4
Sources of Reduced Performance Structural –Road congestion –Call growth –Suburban sprawl –Hospital Locations StrategicOperational –Station location –Long hospital waits –Insufficient units –Insufficient station capacity –Insufficient stations –Insufficient crews –Poor scheduling –Long setup times –Long patient times –Redeployment gaps –Improper call evaluation –Poor dispatch policies –Poor redeployment policies

5
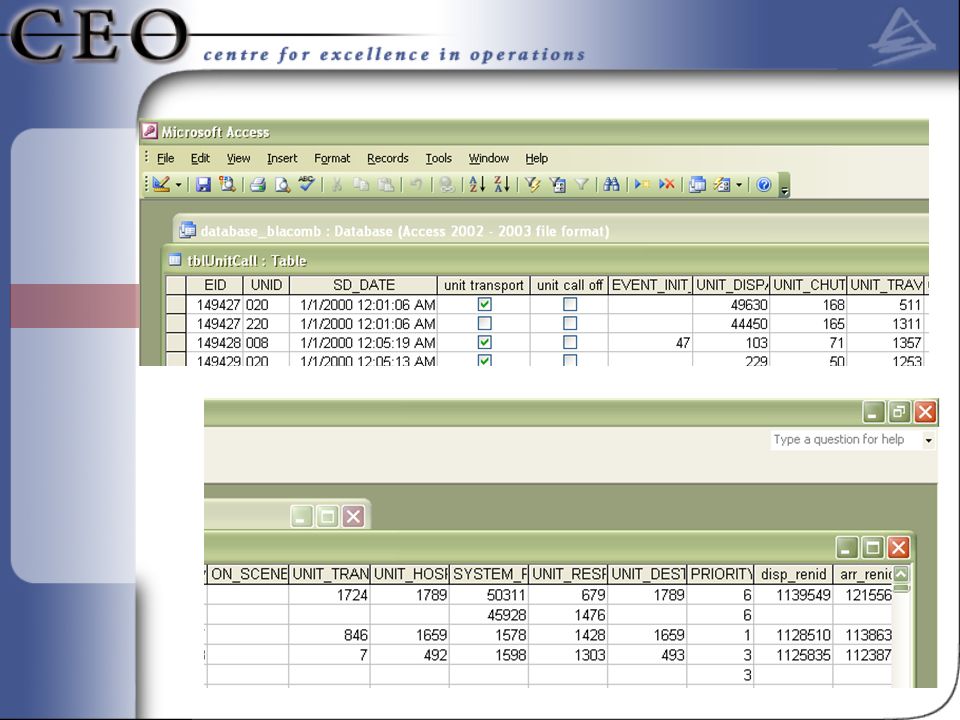
Data Available Call records (time stamps, priority, locations) Event records (shift starts and ends, moves) Scheduled units AVL (10 second location and state data) Messy…
 Event records (shift starts and ends, moves) Scheduled units AVL (10 second location and state data) Messy…")
6
459,501

8
Calgary Project – Performance Improvement Calgary EMS – How Can we Improve? 2005 Population – ~950K (2.4% growth) 24 current stations 721 km 2 geographic area Up to 42 ambulances at peak time ~15,000 P1 calls - ~95,000 total calls in last year
 24 current stations 721 km 2 geographic area Up to 42 ambulances at peak time ~15,000 P1 calls - ~95,000 total calls in last year.")
9
Overall Performance % Response < 8min Performance

10
Call growth Weekly Call Volumes 2000200120022003 Calls Calls have been growing at a 9.8% compound annual rate since 2000. Population (000s) – 1.6% CAGR EMS Calls – 9.8% CAGR
 – 1.6% CAGR EMS Calls – 9.8% CAGR.")
11
Call patterns – Geographic Call growth has been concentrated in the periphery. 20002001200220032004 Downtown Periphery Priority 1 calls from all years. Growth 8.5% 5.8% EMS Call Growth Call Forecasting Response Times The Ambulator

12
Call growth Monthly Calls by Priority 2000 2001 2002 2003 2004 2005 PriorityCAGR 1 2 3 4 5-7 10% 3% 10% 6% Growth is continuing at around 10% per year. Calls

13
Priority one calls CAGR 5% 0% 1% 6% 20% The largest categories within priority one are growing more slowly

14
Call forecasting Average Hourly Calls An average of ~180 calls arrive in one day.

15
Call forecasting But daily totals vary due to other effects (weather, etc.) Distribution of Daily Calls Number of Calls Frequency
 Distribution of Daily Calls Number of Calls Frequency")
16
Call Forecasting Calls arrive in distinct patterns SunMonTuesWedThursFriSat Weekly Call Pattern JanAprJulOct Yearly Call Pattern (Detrended)
")
17
Geo-coding Call LocationsDispatch Locations

18
Where Are Calls Overgoal Station Zones 2004

19
250 180 90 30 Legend: Late Calls Year 2000 200020012002200320042005

20
250 180 90 30 Legend: Late Calls Year 2001 200020012002200320042005

21
250 180 90 30 Legend: Late Calls Year 2002 200020012002200320042005

22
250 180 90 30 Legend: Late Calls Year 2003 200020012002200320042005

23
250 180 90 30 Legend: Late Calls Year 2004 200020012002200320042005

24
250 180 90 30 Legend: Late Calls Year 2005 200020012002200320042005

25
Why Calls are Overgoal Evaluate each call to see why it was overgoal: 1.Chute problem 2.Dispatch problem 3.Call Evaluation problem 4.Hospital problem 5.Travel distance (from nearest two stations) 6.Stations busy (nearest two) 7.Driving problem (other travel factors) 8.Multiple problems (combinations of the above)
 6.Stations busy (nearest two) 7.Driving problem (other travel factors) 8.Multiple problems (combinations of the above)")
26
Why Calls are Overgoal Total Late Calls by Year (Responses > 8 Minutes) Late Calls
 Late Calls")
27
Hospital time Time spent waiting at the hospital nearly tripled from 2000- 2005 Hours/Month Data from 2000-2005 – all calls.

28
So what did they do? Lobby the Health Authority Put paramedics in the hallway Created drop-off protocol “Full Capacity Protocol” Divert drop-offs to less busy hospitals UNSUCCESSFUL MIXED ???

29
St. Albert Station Location St. Albert Fire – Where do we put new stations through 2015? 2003 Population - ~50,000 2 station Combined fire/EMS ~2500 calls per year

30
Stochastic Model – Travel Times Speed Calculations We derived a ‘most-likely route’ We calculated distances using this routing scheme Using actual travels times, we calculated average speeds for 3 types of roads: Secondar y Primary Residentia l 50 km/h40 km/h32 km/h 1.5 km 2 km 0.5 km 1.5 km

31
Stochastic model – travel times Although covered on average – this node is not reached 2% of the time in 9 minutes Actual Travel Times for 34 Mission Ave (361 Incidents)
")
32
Stochastic model – travel time distributions Modeled Travel Time (mean = 3 min.) Actual Travel Times for 34 Mission Ave (361 Incidents)
 Actual Travel Times for 34 Mission Ave (361 Incidents)")
33
Coverage analysis – probabilistic coverage Total Time (Dispatch Time + Activation Time + Travel Time) Nine minute target response 98% of the instances are to the left of 9 min
 Nine minute target response 98% of the instances are to the left of 9 min")
34
Coverage analysis – probabilistic coverage Total Time (Dispatch Time + Activation Time + Travel Time) Nine minute target response 69% of the instances are left of 9 minutes
 Nine minute target response 69% of the instances are left of 9 minutes")
35
Stochastic model Station Illustrative Covered in 9 min 95% of the time Covered in 9 min 80% of the time Covered in 9 min 60% of the time X X X 120 calls 130 calls 40 calls = = Total Calls: 290 = 114 calls 104 calls 24 calls Total Covered: 242 Coverage Rate = 83%

36
Current (2002) Primary Secondary Residential
 Primary Secondary Residential")
37
2005 Primary Secondary Residential

38
2010 Primary Secondary Residential

39
2015 Primary Secondary Residential

40
Station Recommendations 200220052010(2015) 200520102015 Calls92.9%91.2%91.8% EMS93.1%91.5%92.0% FIRE92.0%90.3%90.8% VALUE91.8%89.9%90.4%
 Calls92.9%91.2%91.8% EMS93.1%91.5%92.0% FIRE92.0%90.3%90.8% VALUE91.8%89.9%90.4%")
41
Expected Performance % Calls Covered in 9 Minutes Year Coverage Through Time in St. Albert (projected calls) North station added West station added Calgary
 North station added West station added Calgary.")
42
Results Mayor: “This is all well and good – percent improvements here and there – but what does this mean in terms of lives saved?

43
Response Times vs. Heart Attack Mortality

44
Adding Stations – Heart Attacks Number of Heart Attack Fatalities Year Expected Heart Attack Fatalities West station added East station added On average, we save an additional life every year.

45
Models Covering (1974) (1983) (1987) Uncertain ambulance availability Uncertain response time Budge, Ingolfsson, Erkut (2005)
 (1983) (1987) Uncertain ambulance availability Uncertain response time Budge, Ingolfsson, Erkut (2005)")
46
Month of Year by Region (GC) Hour of Day Index ASSIG PROB
 Hour of Day Index ASSIG PROB")
47
The Ambulator Model Forecast Engine Input Date/Time Output Call Demand Busy Time Response Time Calculation Engine Input Forecast outputs Unit Deployment Output Coverage Deployment Engine Input Available units Output “Optimal” deployment Scheduling Engine Input Optimization output Available shifts Output Optimal schedule Forecastor Calculator Tabu SolverSchedulator 15 minutes to Calculate 4,000 hours to calculate 2 minutes to calculate

48
Hospital Time Improvement Total Improvement of 2.3% Performance (Average total daily performance)
")
49
(July – 2005) ~1% drop per 1000 Calls
 ~1% drop per 1000 Calls")
50
Schedule & Fleet Size Note – schedule and performance based on 2004. Old vs. Optimal Schedule - 2005 Performance 76.8% 78.2% Total Total Improvement of 1.4%

51
Shift Flexibility How does performance change when we adjust shift flexibility? Performance Unlimited fleet size

52
Fleet Size How does performance change when we adjust fleet size? Fleet Size Performance 1hr shifts

53
Unit Hours An additional 24hr unit is 0.8% improvement at 780 unit hours Unit Hours Performance

54
Station Expansion +1 +2 Total Improvement of ~1%

55
Additional Discoveries From the Model Adding the next best station – 1% improvement Adding additional unit to the best station – 0.8% improvement Cutting patient time (scene, transport, or hospital) by 4 minutes – 1% From the Data Cutting response time (call eval, dispatch, chute, or travel) by 6 seconds yields 1% Own-zone performance shows if stations are necessary…or perhaps call eval/dispatch/chute improvements
 by 4 minutes – 1% From the Data Cutting response time (call eval, dispatch, chute, or travel) by 6 seconds yields 1% Own-zone performance shows if stations are necessary…or perhaps call eval/dispatch/chute improvements")
56
Where are we going? Performance Improvement Cost Improved Dispatch Additional Crews Additional Stations Expanded Stations

57
Things learned Pretty counts Quick is as important as accurate Data analysis is often more beneficial than modeling Rules of thumb

Similar presentations


 Be able to.>")


