Download presentation
Presentation is loading. Please wait.

1
Chapter 16 Population Genetics and Speciation

2
Variation of Traits In nature many quantitative traits in a population tend to follow a bell curve pattern In nature many quantitative traits in a population tend to follow a bell curve pattern Average (ex height and weight) Average (ex height and weight)
 Average (ex height and weight)")
4
The report, Mean Body Weight, Height, and Body Mass Index (BMI) 1960-2002: United States, shows that the average height of a man aged 20- 74 years increased from just over 5'8" in 1960 to 5'9½" in 2002, while the average height of a woman the same age increased from slightly over 5'3" 1960 to 5'4" in 2002. The report, Mean Body Weight, Height, and Body Mass Index (BMI) 1960-2002: United States, shows that the average height of a man aged 20- 74 years increased from just over 5'8" in 1960 to 5'9½" in 2002, while the average height of a woman the same age increased from slightly over 5'3" 1960 to 5'4" in 2002.Mean Body Weight, Height, and Body Mass Index (BMI) 1960-2002: United StatesMean Body Weight, Height, and Body Mass Index (BMI) 1960-2002: United States Meanwhile, the average weight for men aged 20- 74 years rose dramatically from 166.3 pounds in 1960 to 191 pounds in 2002, while the average weight for women the same age increased from 140.2 pounds in 1960 to 164.3 pounds in 2002. Meanwhile, the average weight for men aged 20- 74 years rose dramatically from 166.3 pounds in 1960 to 191 pounds in 2002, while the average weight for women the same age increased from 140.2 pounds in 1960 to 164.3 pounds in 2002.
 : United States, shows that the average height of a man aged years increased from just over 5 8 in 1960 to 5 9½ in 2002, while the average height of a woman the same age increased from slightly over to 5 4 in 2002.Mean Body Weight, Height, and Body Mass Index (BMI) : United StatesMean Body Weight, Height, and Body Mass Index (BMI) : United States Meanwhile, the average weight for men aged years rose dramatically from pounds in 1960 to 191 pounds in 2002, while the average weight for women the same age increased from pounds in 1960 to pounds in Meanwhile, the average weight for men aged years rose dramatically from pounds in 1960 to 191 pounds in 2002, while the average weight for women the same age increased from pounds in 1960 to pounds in")
10
Causes of Variation Environment Environment heredity heredity MutationMutation Recombination of genesRecombination of genes Random pairing of gametesRandom pairing of gametes

11
Theoretically…how many genetically unique, brothers and sisters could your parents produce? For humans, the number of different gametes is 223 * 223, or 8,388,6082, giving 70,368,744,177,664 (70 trillion) possible combinations. For humans, the number of different gametes is 223 * 223, or 8,388,6082, giving 70,368,744,177,664 (70 trillion) possible combinations.
 possible combinations. For humans, the number of different gametes is 223 * 223, or 8,388,6082, giving 70,368,744,177,664 (70 trillion) possible combinations..")
12
The Gene Pool Total genetic information available in a population Total genetic information available in a population Ex. In a homogeneous population like in South Korea….the dark skin alleles are just not in that gene pool. Ex. In a homogeneous population like in South Korea….the dark skin alleles are just not in that gene pool.

13
Calculate Allele frequency ? Calculate Allele frequency ? Divide number of certain allele by the total number of alleles Divide number of certain allele by the total number of alleles

14
Phenotype frequency- number of individuals with a particular phenotype divided by the total number of individuals in the population Phenotype frequency- number of individuals with a particular phenotype divided by the total number of individuals in the population Frequency of a pair? Multiply the individual frequency numbers…. Frequency of a pair? Multiply the individual frequency numbers….

15
Hardy & Weinberg Genotype frequencies tend to remain the same in a population unless acted on upon outside forces. (genetic equilibrium) Genotype frequencies tend to remain the same in a population unless acted on upon outside forces. (genetic equilibrium) 5 things must happen for this to occur… 5 things must happen for this to occur…
 Genotype frequencies tend to remain the same in a population unless acted on upon outside forces. (genetic equilibrium) 5 things must happen for this to occur… 5 things must happen for this to occur….")
16
1. No Mutations 2. No individuals enter of leave 3. Population is large 4. Mating is random 5. Natural Selection does not occur *** Where on Earth does this happen?

17
Hardy Weinberg Equation Calculate frequencies of alleles in population Calculate frequencies of alleles in population P dominant allele P dominant allele Q recessive allele Q recessive allele Problems 1, 2, 3 – go over together Problems 1, 2, 3 – go over together

19
Disrupting Genetic Equilibrium Mutation: Mutation: Can increase with mutagens Can increase with mutagens Spontaneous mutations Spontaneous mutations Usually remain fairly low in numberUsually remain fairly low in number Introduce new alleles into pop.Introduce new alleles into pop. Many are harmful, some are beneficial some are neitherMany are harmful, some are beneficial some are neither

20
Polydactyly--mutation

21
Mutations Provide new alleles in gene pool Provide new alleles in gene pool Adaptations Adaptations

22
Gene Flow Emigration- out Emigration- out Immigration- in Immigration- in This maintains gene flow This maintains gene flow Ex.- Male lions chase away maturing cubs, they must go find another group… (This way we can be sure that the will not mate with their sister cubs…) Ex.- Male lions chase away maturing cubs, they must go find another group… (This way we can be sure that the will not mate with their sister cubs…) Gene flow…. Gene flow….

24
Genetic Drift Allele frequencies change as a result of random events… Allele frequencies change as a result of random events… This is more applicable to a smaller population than to a larger one. This is more applicable to a smaller population than to a larger one.

25
Causes of Evolution Genetic Drift: change due to chance Genetic Drift: change due to chance Bottleneck effect (fire, earthquake, flood)…Bottleneck effect (fire, earthquake, flood)…
…Bottleneck effect (fire, earthquake, flood)…")
26
An example of a bottleneck: Northern elephant seals have reduced genetic variation probably because of a population bottleneck humans inflicted on them in the 1890s. Hunting reduced their population size to as few as 20 individuals at the end of the 19th century. Their population has since rebounded to over 30,000—but their genes still carry the marks of this bottleneck: they have much less genetic variation than a population of southern elephant seals that was not so intensely hunted. An example of a bottleneck: Northern elephant seals have reduced genetic variation probably because of a population bottleneck humans inflicted on them in the 1890s. Hunting reduced their population size to as few as 20 individuals at the end of the 19th century. Their population has since rebounded to over 30,000—but their genes still carry the marks of this bottleneck: they have much less genetic variation than a population of southern elephant seals that was not so intensely hunted.

27
Another bottleneck ex. Ashkenazi Jews population reduced due to Genocide (perhaps) and high incidence of Tay Sachs Disease now…. Ashkenazi Jews population reduced due to Genocide (perhaps) and high incidence of Tay Sachs Disease now….
 and high incidence of Tay Sachs Disease now…. Ashkenazi Jews population reduced due to Genocide (perhaps) and high incidence of Tay Sachs Disease now…..")
28
Non random mating Not good Not good Geographic proximity Geographic proximity Amplify certain traits Amplify certain traits Some select mates based on similarities, this is assortative mating… Some select mates based on similarities, this is assortative mating…

29
Founder effect Founder effect

30
Small population breaks away from a larger one. Rarer alleles are over represented….. Small population breaks away from a larger one. Rarer alleles are over represented….. Amish 1770’s German population, extreme isolation, and intermarriage… Amish 1770’s German population, extreme isolation, and intermarriage…

31
As a result… many Amish have polydactyly

32
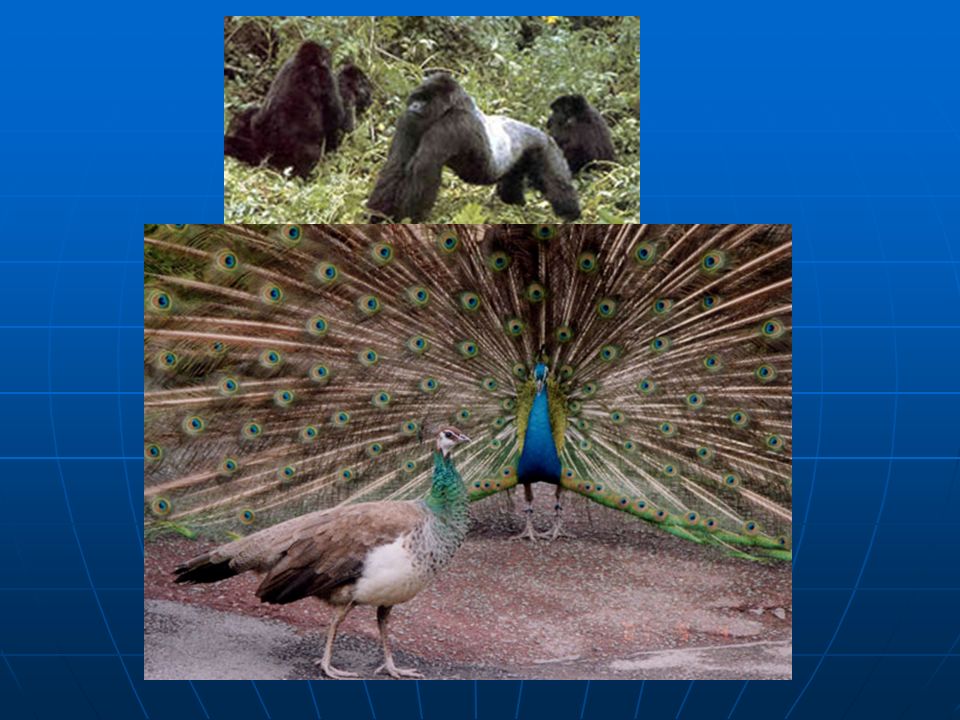
Sexual Selection Females choose males, based on certain traits Females choose males, based on certain traits Peacock: Male is brightly colored (may attract predators, but gets the girls to notice him ….) Peacock: Male is brightly colored (may attract predators, but gets the girls to notice him ….)
 Peacock: Male is brightly colored (may attract predators, but gets the girls to notice him ….)")
36
Sexual Selection sexual dimorphism: Differences between the females and males sexual dimorphism: Differences between the females and males “It bestows upon the females a large, pink, pillowy buttocks “ “It bestows upon the females a large, pink, pillowy buttocks “

37
Natural Selection Some members are more likely to survive and reproduce- thus their genes will be passed on to the next generation Some members are more likely to survive and reproduce- thus their genes will be passed on to the next generation When Natural Selection is at work, distribution of properties may change over time When Natural Selection is at work, distribution of properties may change over time

38
Stabilizing Selection It’s Best to have the average traits It’s Best to have the average traits The ones that survive are let’s say, “not the biggest, or the smallest” The ones that survive are let’s say, “not the biggest, or the smallest”

39
Types of Selection Stabilizing Stabilizing

40
Disruptive Selection Being one extreme or another is better than being average Being one extreme or another is better than being average

41
Directional Selection One extreme form of a trait is better for survival One extreme form of a trait is better for survival

42
The story of the peppered moth in England during the Industrial Revolution…What type of selection is demonstrated here? The story of the peppered moth in England during the Industrial Revolution…What type of selection is demonstrated here?

43
Formation of Species Is called speciation Is called speciation Over time animals can change a lot, or a little, from ancient ancestors Over time animals can change a lot, or a little, from ancient ancestors

45
Morphological Concept of Species Says…species are animals that look alike Says…species are animals that look alike Over time, we found that dissimilar animals bred and interacted in nature so we had to change that.. Over time, we found that dissimilar animals bred and interacted in nature so we had to change that..

47
Biological Concept of Species Species are members that can interbreed… Species are members that can interbreed…

49
Modern Concept of Species? Look alike Look alike And, can interbreed And, can interbreed

50
There will always be exceptions to that rule though….

51
How can new species arise? Geographic Isolation Geographic Isolation Allopatric Speciation Allopatric Speciation Reproductive Isolation Reproductive Isolation Sympatric Speciation Sympatric Speciation

52
Geographic Isolation Physical Isolation Physical Isolation Gene flow between them stops Gene flow between them stops Genetic drift Genetic drift Mating cannot occur Mating cannot occur

54
Allopatric Speciation 2 different species due to geographic isolation 2 different species due to geographic isolation

55
Reproductive Isolation Successful mating is prevented Successful mating is prevented Prezygotic- before fertilization Prezygotic- before fertilization Post-zygotic- after fertilization Post-zygotic- after fertilization

56
Reproductive Isolation Anatomical incompatibility Anatomical incompatibility Small male dog and large female dog cannot mate Small male dog and large female dog cannot mate Prezygotic barriers- prevent mating Prezygotic barriers- prevent mating Post-zygotic barriers- mating occurs but offspring is infertile Post-zygotic barriers- mating occurs but offspring is infertile

57
Pre-zygotic barriers- Hmmmm…just think about it… Hmmmm…just think about it…

58
Post-zygotic barriers- mating occurs but offspring is infertile Post-zygotic barriers- mating occurs but offspring is infertile

59
Sympatric Speciation 2 sub populations become reproductively isolated within the same geographic area. 2 sub populations become reproductively isolated within the same geographic area.

61
Rates of Speciation Sometimes millions of years, sometimes a lot less (thousand) Sometimes millions of years, sometimes a lot less (thousand) Theory – millions of years “gradualism” Theory – millions of years “gradualism” Theory- no changes for a very long time then a sudden burst- “punctuated equibrium” Theory- no changes for a very long time then a sudden burst- “punctuated equibrium”
 Sometimes millions of years, sometimes a lot less (thousand) Theory – millions of years gradualism Theory – millions of years gradualism Theory- no changes for a very long time then a sudden burst- punctuated equibrium Theory- no changes for a very long time then a sudden burst- punctuated equibrium")
62
Which side, is which?

Similar presentations


 Population Genetics Study of evolution from a genetic point of view Population: individuals of the same species that.>")

 – Winner survives or thrives more “Best.>")
