Download presentation
Presentation is loading. Please wait.

1
GAS QUALITY: HOW IT IMPACTS QUESTAR GAS Docket 04-057-09 October 13, 2004

2
NATURAL GAS AIR HEAT + H 2 0 + CO 2 + CO + Other Stuff Try to keep as high as possible Try to keep as low as possible Orifice size adjusted for specific installation conditions: -Altitude -Gas Composition COMBUSTION THEORY 101 Efficient and safe combustion requires the correct ratio of oxygen and fuel The ability of an appliance to properly combust a fuel different than what it was adjusted for depends on the heating value and specific gravity of the fuel Specific Gravity Heating Value WobbeNumber =

3
1060 Btu/CF &.61 S.G. (Wobbe # 1357) AIR Appliance Properly Adjusted for Altitude and 1088 Btu/CF &.62 Specific Gravity (Wobbe # 1382) IMPACT OF GAS QUALITY CHANGE ON APPLIANCE PERFORMANCE Case 1: Ideal Conditions Proper flame characteristics Appliance will perform as rated Low carbon monoxide emissions NATURAL GAS
 AIR Appliance Properly Adjusted for Altitude and 1088 Btu/CF &.62 Specific Gravity (Wobbe # 1382) IMPACT OF GAS QUALITY CHANGE ON APPLIANCE PERFORMANCE Case 1: Ideal Conditions Proper flame characteristics Appliance will perform as rated Low carbon monoxide emissions NATURAL GAS.")
4
985 Btu/CF &.575 S.G. (Wobbe # 1299) AIR Appliance Properly Adjusted for Altitude and 1088 Btu/CF &.62 S pecific Gravity Gas (Wobbe # 1382) IMPACT OF GAS QUALITY CHANGE ON APPLIANCE PERFORMANCE Case 2: Introduction of Coal Seam Gas Flame instability (liftoff and possible blow-off) Appliance will produce less heat than rated Increase in carbon monoxide emissions NATURAL GAS
 AIR Appliance Properly Adjusted for Altitude and 1088 Btu/CF &.62 S pecific Gravity Gas (Wobbe # 1382) IMPACT OF GAS QUALITY CHANGE ON APPLIANCE PERFORMANCE Case 2: Introduction of Coal Seam Gas Flame instability (liftoff and possible blow-off) Appliance will produce less heat than rated Increase in carbon monoxide emissions NATURAL GAS.")
5
985 Btu/CF &.575 S.G. (Wobbe #1329) AIR Appliance Properly Adjusted for Altitude and 1003 Btu/CF &.56 Specific Gravity Gas (Wobbe #1340) IMPACT OF GAS QUALITY CHANGE ON APPLIANCE PERFORMANCE Case 3: Re-Orifice Appliance Southern System Set-Point Proper flame characteristics Appliance will perform as rated Low carbon monoxide emissions NATURAL GAS Change orifice out with larger diameter orifice
 AIR Appliance Properly Adjusted for Altitude and 1003 Btu/CF &.56 Specific Gravity Gas (Wobbe #1340) IMPACT OF GAS QUALITY CHANGE ON APPLIANCE PERFORMANCE Case 3: Re-Orifice Appliance Southern System Set-Point Proper flame characteristics Appliance will perform as rated Low carbon monoxide emissions NATURAL GAS Change orifice out with larger diameter orifice.")
10
PIPELINE BTU SPECIFICATIONS (September, 2004) PIPELINE COMPANYMINIMUM BTUMAXIMUM BTU ANR9671200 CIG9681235 Columbia Gulf978None El Paso Natural Gas967None Florida Gas Transmission1000None NGPL950None Northern Border967None Northwest Pipeline985None Panhandle Energy9501200 Sonat950None Kern River970None Tennessee9671100 Texas Eastern967None Trailblazer950None Transco9801100 TransWestern970None Trunkline9501200 Questar9501150
 PIPELINE COMPANYMINIMUM BTUMAXIMUM BTU ANR CIG Columbia Gulf978None El Paso Natural Gas967None Florida Gas Transmission1000None NGPL950None Northern Border967None Northwest Pipeline985None Panhandle Energy Sonat950None Kern River970None Tennessee Texas Eastern967None Trailblazer950None Transco TransWestern970None Trunkline Questar")
11
Questar Pipeline – Downstream Btu Delivery Specs. KRGT (Goshen) Min. – 970 Btu/CF Max.– No Limit Btu/CF QGC (Payson) Min. - 950 Btu/Cf Max. – 1150 Btu/CF KRGT (Roberson Creek) Min. - 970 Btu/CF Max.– No Limit Btu/CF TransColorado Min.- 967 Btu/Cf Max.- No Limit Btu/CF Southern Star Btu Delivery Requirements Min.– 970 Max.– No Limit NPC (XO-16) Min. - 985 Btu/CF Max. – No Limit QGC (Northern Wasatch Front) Min. - 950 Btu/CF Max.– 1150 Btu/CF NPC (Clay Basin) Min. - 985 Btu/CF Max. – No Limit Kanda FidlarPrice ML 40/41 ML 104 ML 40 ML 68 ML’s 1/13/15 ML 80 ML58/101 ML 22 Greasewood Legend: Oak Spring Eakin Davis Plant - 3rd Party JL 47 Overthrust Pipeline Compressor Station Delivery Point CO2 Plant CIG Min.– 968 Btu/CF Max.– 1235 Btu/CF WIC Min.– 950 Btu/CF Max. –No Limit Natural Gas Producers Questar Pipeline Tariff Min.- 950 Btu/CF Max.- 1150 Btu/CF
 Min Btu/Cf Max. – 1150 Btu/CF KRGT (Roberson Creek) Min Btu/CF Max.– No Limit Btu/CF TransColorado Min Btu/Cf Max.- No Limit Btu/CF Southern Star Btu Delivery Requirements Min.– 970 Max.– No Limit NPC (XO-16) Min Btu/CF Max. – No Limit QGC (Northern Wasatch Front) Min Btu/CF Max.– 1150 Btu/CF NPC (Clay Basin) Min Btu/CF Max. – No Limit Kanda FidlarPrice ML 40/41 ML 104 ML 40 ML 68 ML’s 1/13/15 ML 80 ML58/101 ML 22 Greasewood Legend: Oak Spring Eakin Davis Plant - 3rd Party JL 47 Overthrust Pipeline Compressor Station Delivery Point CO2 Plant CIG Min.– 968 Btu/CF Max.– 1235 Btu/CF WIC Min.– 950 Btu/CF Max. –No Limit Natural Gas Producers Questar Pipeline Tariff Min Btu/CF Max Btu/CF.")
12
Basin Map C M M TCGT FIDLAR M CIG NATURAL BUTTES C RMNG RIFLE RED WASH M.L.80 S CLAY BASIN CRAIG C DRIPPING ROCK STATE LINE M SKULL CREEK C SIMON M HAYSTACK WGPC C NIGHTINGALE M.L.58 NPC C M M M OT M MUDDY CREEK WHITNEY CANYON OT J.. L 36 KRGT S LEROY EAKIN M.L. 1,13,15 CIG WIC M.L.40 C OAK SPRING M M M M M M M INDIANOLA QG C NEPHI CITY PAYSON GATE S CHALK CREEK S COALVILLE LITTLE MOUNTAIN PORTERS LANE SUNSET GATE HYRUM GATE QGC KRGT IDAHO WYOMING UTAH COLORADO NPC SOUTH LAKE M C KANDA/COLEMAN PRICE M M DRAGON TRAIL NPC XO-16 C CO2 PLT C M ELBERTA M Piceance Basin Uinta Basin Ferron East Fields Green River Basin Overthrust

13
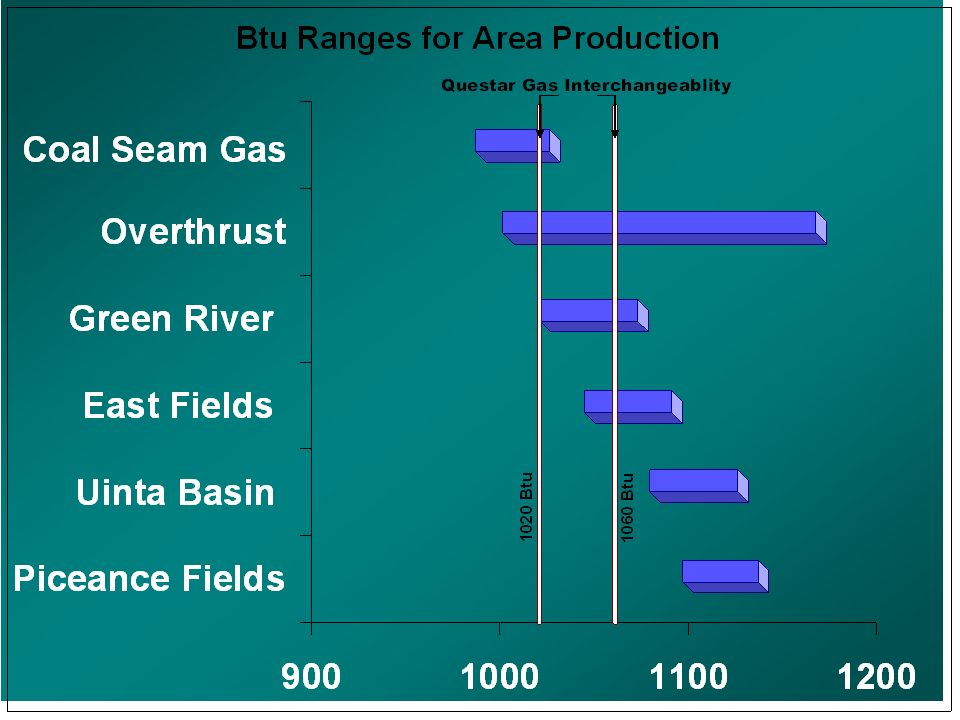
Questar Pipeline – Gas Quality Distribution KRGT (Goshen) Min. – 970 Btu/CF Max.– No Limit Btu/CF QGC (Payson) Min. - 950 Btu/Cf Max. – 1150 Btu/CF KRGT (Roberson Creek) TransColorado Southern Star QGC (Northern Wasatch Front) Min. - 950 Btu/CF Max.– 1150 Btu/CF NPC (Clay Basin) Kanda FidlarPrice ML 40/41 ML 104 ML 40 ML 68 ML’s 1/13/15 ML 80 ML58/101 ML 22 Greasewood Oak Spring Eakin Davis Plant - 3rd Party JL 47 Overthrust Pipeline CO2 Plant CIG WIC East Fields Max. Btu-1150 Min. Btu-950 Green River Basin Max. Btu-1176 Min. Btu-1025 Overthrust Max. Btu-1170 Min. Btu-1000 Ferron Max. Btu-1060 Min. Btu-984 Uinta Basin Max. Btu-1150 Min. Btu-1020 Piceance Basin Max. Btu-1200 Min. Btu-1020
 Min Btu/Cf Max. – 1150 Btu/CF KRGT (Roberson Creek) TransColorado Southern Star QGC (Northern Wasatch Front) Min Btu/CF Max.– 1150 Btu/CF NPC (Clay Basin) Kanda FidlarPrice ML 40/41 ML 104 ML 40 ML 68 ML’s 1/13/15 ML 80 ML58/101 ML 22 Greasewood Oak Spring Eakin Davis Plant - 3rd Party JL 47 Overthrust Pipeline CO2 Plant CIG WIC East Fields Max. Btu-1150 Min. Btu-950 Green River Basin Max. Btu-1176 Min. Btu-1025 Overthrust Max. Btu-1170 Min. Btu-1000 Ferron Max. Btu-1060 Min. Btu-984 Uinta Basin Max. Btu-1150 Min. Btu-1020 Piceance Basin Max. Btu-1200 Min. Btu")
17
TYPES OF NATURAL GAS Traditional Supplies 970 – 1250 Associated Gas Dry Gas Sour Gas Current/Future Supplies Coal Seam Gas 970 - 1030 LNG 1040 - 1200 Manufactured Gas 500 – 1000 Coal Gasification Landfill/Biomass Supply SourceBtu Range

18
WOBBE - INDEX Its Importance to Gas Interchangeability Wobbe Number – Relationship between the heating Value and Specific Gravity, defined as Wobbe Number is a good first-order predictor of appliance performance relative to a base or adjustment gas Wobbe Number is used throughout the world as the most common interchangeability metric Gas is generally considered interchangeable when the Wobbe number lies within a +/- 5% tolerance band around a set-point Specific Gravity Heating Value WobbeNumber =

19
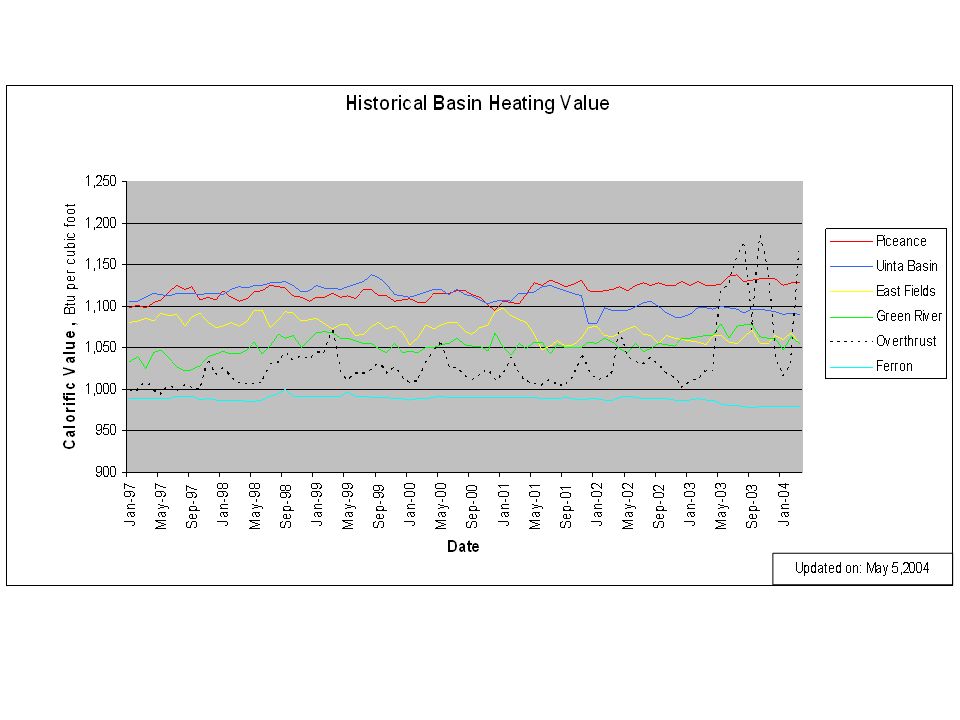
Gas Composition Coal Seam Gas 984 0.588 96.4% 0.27% 0.0543% 0.0139% 0.0018% 2.5% -110.5° 0.18% 1283 Uinta Basin Gas 1115 0.632 90.7% 5.06% 1.95% 0.863% 0.5923% 0.629% 70.4° 0.24% 1402 Representative Btu Specific Gravity Percent Methane(1010 Btu/Scf) Percent Ethane(1789 Btu/Scf) Percent Propane(2516 Btu/Scf) Percent Butane(3250 Btu/Scf) Percent C5+(5500+ Btu/Scf) Percent Inerts(CO 2, etc.) Hydrocarbon Dewpoint Percent Nitrogen Wobbe (W = HV/ G) Northern Gates Gas 1070 0.616 92.0% 4.35% 1.20% 0.491% 0.315% 0.629% 40.9° 0.48% 1363
 Percent Ethane(1789 Btu/Scf) Percent Propane(2516 Btu/Scf) Percent Butane(3250 Btu/Scf) Percent C5+(5500+ Btu/Scf) Percent Inerts(CO 2, etc.) Hydrocarbon Dewpoint Percent Nitrogen Wobbe (W = HV/ G) Northern Gates Gas % 4.35% 1.20% 0.491% 0.315% 0.629% 40.9° 0.48% 1363")
23
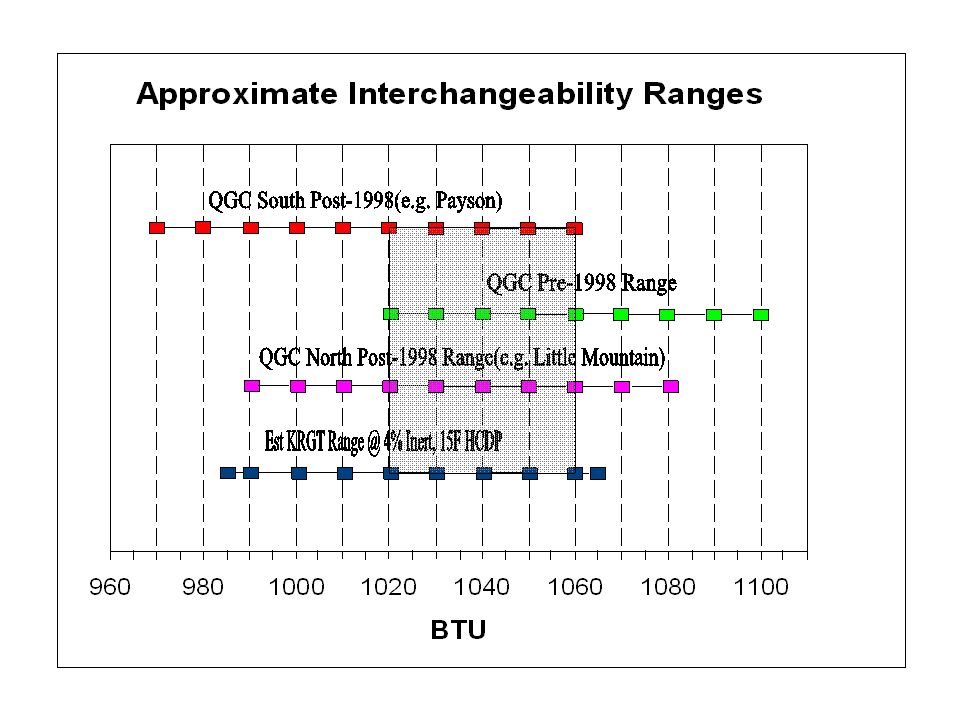
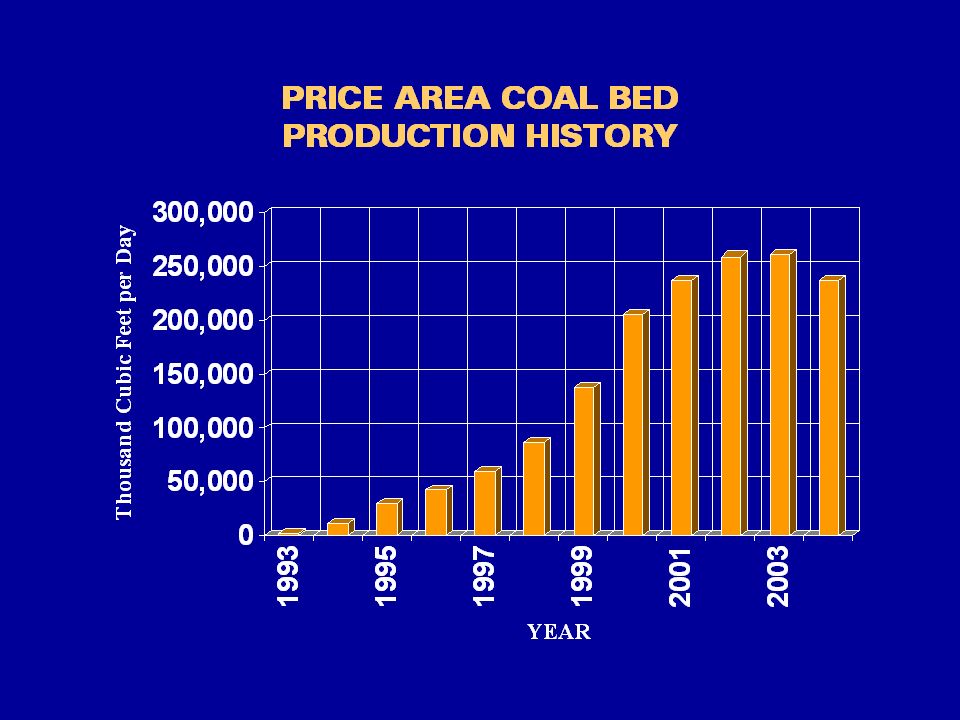
Questar Gas Btu Delivery Ranges (1995 – Present)
")
25
1000 1100 1050 Btu/SCF 1003 QGC SOUTH POST-1998 1088 Pre-1998 Base Gas 1048 1006 1023 QGC NORTH POST 1998 QGC BTU SET-POINTS RELATIVE TO BTU OF GAS DELIVERED TO 26 MAJOR URBAN AREAS 1/ National LDC Btu Range Encompasses 90% of Data 1/”Variability of Natural Gas Composition in Select Major Metropolitan Areas of the United States,” prepared by the American Gas Association Laboratories for Gas Research Institute, GRI-92/0123, March 1992

26
Questar Gas Position Points 1.An improperly adjusted appliance creates a safety hazard. 2.QGC and QPC constantly manage heat content and other gas quality criteria for safe, reliable use. 3.Post FERC regulations, Rocky Mountain pipelines have adopted national interstate grid gas quality specifications. 4.QGC’s gas sources (QPC & Kern River), as part of the interstate pipeline grid, supply volumes whose gas quality is aligned to the national market. 5.Markets, beyond the Rocky Mountains, have a major influence on gas quality and the physical flows of Rocky Mountain production.
, as part of the interstate pipeline grid, supply volumes whose gas quality is aligned to the national market. 5.Markets, beyond the Rocky Mountains, have a major influence on gas quality and the physical flows of Rocky Mountain production..")
Similar presentations


 Source: Energy Information Administration, Annual Energy Outlook 2009-2030.>")

