Download presentation
Presentation is loading. Please wait.

1
A guide to help you prepare your enzyme lab report. An outline is presented to help you prepare your lab report. Your discussion of your lab report must be typed. The graphs can be done “by hand” or by computer. DUE: March 22 nd, 2011

2
Results First graph your standard curve Convert absorbance values to concentration Graph concentration of p-nitroanaline versus time for different substrate concentrations; different temperatures and different pH’s. Details of these three steps are provided on the next slides.

3
Draw your standard curve Draw your standard Curve using the data collected in “part-A” of the laboratory. Use graph paper. Free graph paper is provided on-line (a link is on my homepage) or excel A simplified example is given below. You will need to include units on your axis as well. concentration Abs.
 or excel A simplified example is given below. You will need to include units on your axis as well. concentration Abs..")
4
(independent variable) (dependent variable) Absorbance (410 nm) P-nitroanaline (X10 -5 M) 0.2.4.6.8 1.0 2.03.04.05.0 0 X Simulated Standard Curve
 (dependent variable) Absorbance (410 nm) P-nitroanaline (X10 -5 M) X Simulated Standard Curve")
5
Purpose of your standard curve. You will now use your standard curve to convert the average absorbance values to concentration

6
How to use your standard curve Convert all average absorbances that are HIGHLIGHTED IN YELLOW on your class xcel spreadsheet to concentration using your standard curve and include these concentrations onto the spreadsheet provided. The concentration values should be entered into the BLUE column. This conversion can be done using the equation of the line (y = mx + b) if you are comfortable using Excel to graph your data (or if not you can do so “manually”). Excel provides the value for “ b” which is equal to the “y-intercept”, “m” is the given value for the slope of the line, and “y=absorbance value”. Thus you can use this equation to calculate for “x” or concentration. Bingo! Manually: you can identify the average absorbance on your “y” axis of your standard curve, then “draw over to where you meet the line of your standard curve and “drop” down to the concentration. Bingo! You now have the concentration of your absorbance! Abs. Concentration
 if you are comfortable using Excel to graph your data (or if not you can do so manually ). Excel provides the value for b which is equal to the y-intercept , m is the given value for the slope of the line, and y=absorbance value . Thus you can use this equation to calculate for x or concentration. Bingo. Manually: you can identify the average absorbance on your y axis of your standard curve, then draw over to where you meet the line of your standard curve and drop down to the concentration. Bingo. You now have the concentration of your absorbance. Abs. Concentration.")
7
Absorbance (280nm) DNA (ug/ml) 0.2.4.6.8 1.0.2.2.4.4.6.8.81.0 0 Unknown Absorbance Values DNA Abs. 0.77 DNA Abs. 0.40 X X X This is ONLY an EXAMPLE of how to manually use your standard curve to determine an unknown concentration. This example uses different units than your data. However, if you use Excel you will have the curve and equation of the line that can be used to calculate the concentration values. X= 0.70 ug/ml DNA X= 0.38 ug/ml DNA Answer

8
Now you are ready to graph the affect of: substrate on p-nitroanaline formation over time temperature on p-nitroanaline formation over time pH on p-nitroanaline formation over time

9
P-nitroanaline (x 10 -5 M) Time (minutes) 0.2.4.6.8 1.0 2468100 X Example of 2-substrate concentration on product formation (you will have a line for each substrate concentration on the same graph) = 1.0 X10 -3 M P-nitroanaline = 0.8 x 10⁻³M
 Time (minutes) X Example of 2-substrate concentration on product formation (you will have a line for each substrate concentration on the same graph) = 1.0 X10 -3 M P-nitroanaline = 0.8 x 10⁻³M")
10
P-nitroanaline (x 10 -5 M) Time (minutes) 0.2.4.6.8 1.0 2468100 X Example of 2-Temp. concentration on product formation (you will have a line for each temperature on the same graph) = 22C P-nitroanaline = 37C
 = 22C P-nitroanaline = 37C.")
11
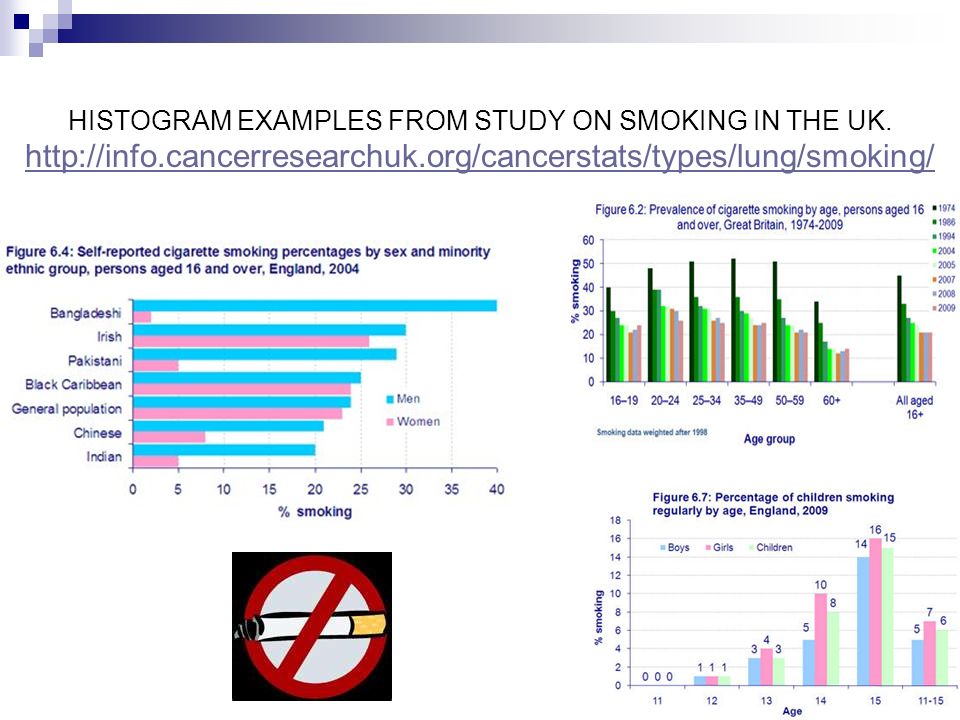
You can try your hand at graphing the affect of pH on p-nitroanaline. You might want to try a “histogram”. Histogram Example on next slides taken from statistics on smoking in the UK. http://info.cancerresearchuk.org/cancerstats/types/lung/smoking/. http://info.cancerresearchuk.org/cancerstats/types/lung/smoking/

12
HISTOGRAM EXAMPLES FROM STUDY ON SMOKING IN THE UK. http://info.cancerresearchuk.org/cancerstats/types/lung/smoking/ http://info.cancerresearchuk.org/cancerstats/types/lung/smoking/
13
Your results will therefore include: Your results will include one table: The excel table with the concentrations of p-nitroanaline determined from the averages. Please add these concentrations to the excel spreadsheet provided on ecompanion. Your results section will also include 4 graphs Standard curve Affect of temperature Affect of pH Affect of substrate concentration

14
Discussion No more than 2-3 pages First graph your data then discuss it. The discussion should attempt to discuss and analyze what each graph is telling you. Your discussion should NOT be a presentation of how you did the experiment. This report is essentially Results and discussion only. I would like to know what you think the data mean, what does it tell you about temperature, substrate, pH and enzyme activity? Essentially you will be a storyteller and explain in your own words what the data suggest or tells us. This should be done independently and not as a group.

15
Hope this helps! Please work on your lab report so that we discuss any questions you may have at before the due date of March 22 nd, 2011. Note: I will not “pre-read” your discussion or report but I will address questions on how to present the data. The discussion must be typed but the graphs can be done on Excel or “by-hand” i.e. using graph paper. All graphs must have labels on the x and y axis, legend “under” the graph, and be sure to identify the multiple lines on the graph in some manner so it is clear what each line represents.

Similar presentations


 Significant.>")


Relate the solution to the.>")


