Download presentation
Presentation is loading. Please wait.

1
Stream Networks and Riparian Zones Landscape Ecology (EEES 4760/6760) Basic terminology Stream Network · Structure · Function · Management Reading: Gregory, S.V., F.J. Swanson, W.A. McKee, and K.W. Cummins. 1991. An ecosystem perspective of riparian zones. Bioscience 41(8): 540-551.
:")
4
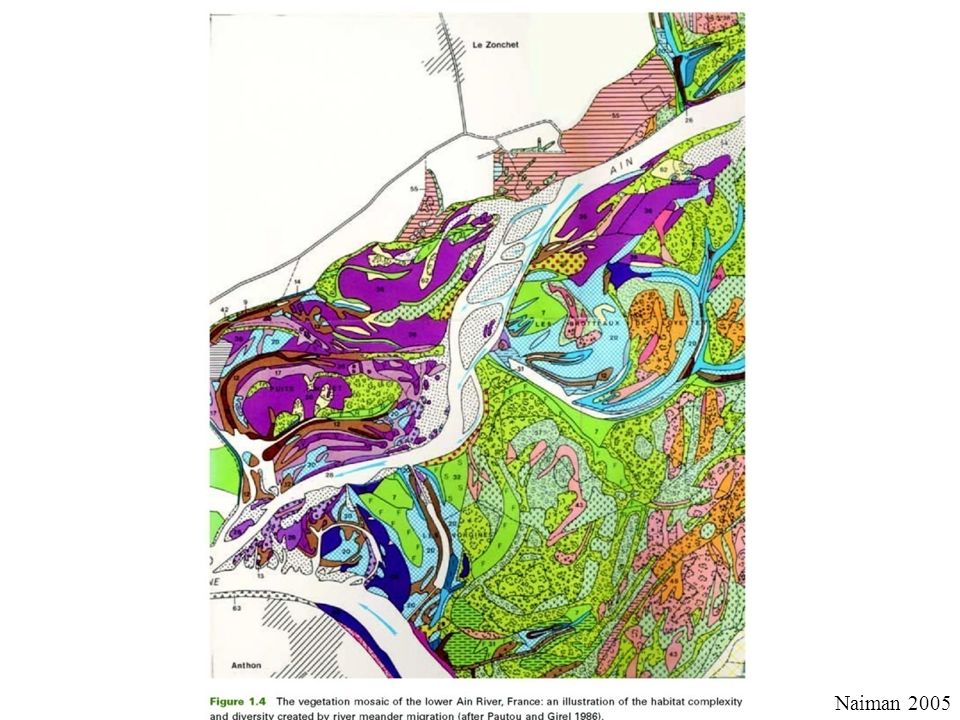
Away from the river, there forms a clear successional gradient resulted from different disturbances (i.e., flooding).
.")
5
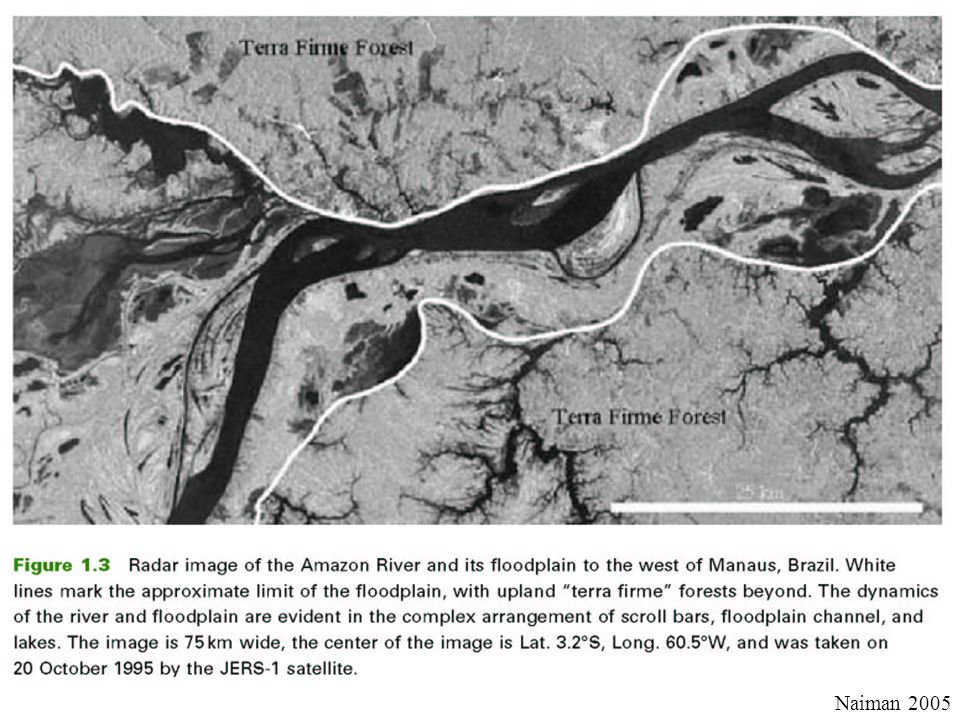
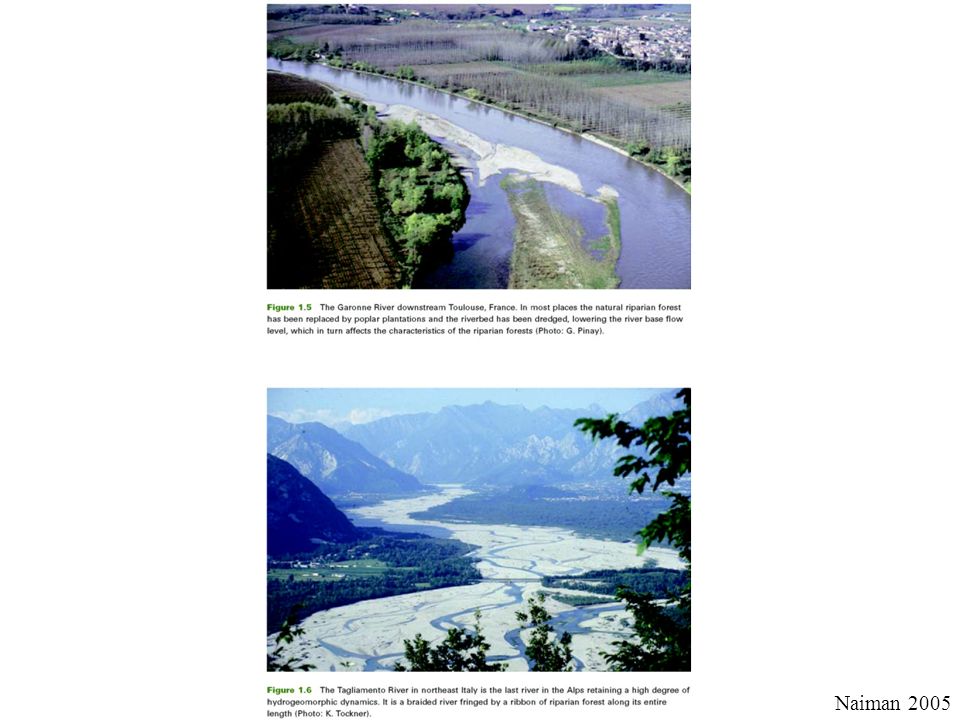
Naiman 2005

11
Jiquan Chen 1, Kimberley D. Brosofske 2, Robert Naiman 5, and Jerry F. Franklin 6 1.Environmental Science, University of Toledo, OH, jiquan.chen@utoledo.edujiquan.chen@utoledo.edu 2.Dept. of Natural Resources Science, University of Rhode Island, Kingston, RI 3.SFWP, Michigan Technological University, Houghton, MI 4.Forestry Science Lab, USDA Forest Service, Grand Rapids, MN 5.School of Aquatic & Fishery Sciences, University of Washington, Seattle, WA 6.College of Forest Resources, University of Washington, Seattle, WA

12
Riparian zones are known for their rich biota, unique biophysical conditions and dynamics, and highly complex vegetation structure. Riparian zones are known for their rich biota, unique biophysical conditions and dynamics, and highly complex vegetation structure. Numerous authors have reported high species diversity related to riparian buffers (Naiman & Bilby 1998). Numerous authors have reported high species diversity related to riparian buffers (Naiman & Bilby 1998). One study (Hibbs & Bower 2001) of plant distribution associated with managed riparian buffers concluded that “edge effects appeared unfounded in this region for the plant community”. One study (Hibbs & Bower 2001) of plant distribution associated with managed riparian buffers concluded that “edge effects appeared unfounded in this region for the plant community”.
. Numerous authors have reported high species diversity related to riparian buffers (Naiman & Bilby 1998). One study (Hibbs & Bower 2001) of plant distribution associated with managed riparian buffers concluded that edge effects appeared unfounded in this region for the plant community . One study (Hibbs & Bower 2001) of plant distribution associated with managed riparian buffers concluded that edge effects appeared unfounded in this region for the plant community ..")
13
OBJECTIVES To examine plant species distribution across small streams (1 st – 3 rd order streams) in two managed landscapes: Western Washington and Northern Wisconsin; To quantify the contribution of small streams to the plant species pool of a managed landscape in Northern Wisconsin; To discuss the underlying mechanisms for species distribution within riparian zones; OBJECTIVES To examine plant species distribution across small streams (1 st – 3 rd order streams) in two managed landscapes: Western Washington and Northern Wisconsin; To quantify the contribution of small streams to the plant species pool of a managed landscape in Northern Wisconsin; To discuss the underlying mechanisms for species distribution within riparian zones;
 in two managed landscapes: Western Washington and Northern Wisconsin; To quantify the contribution of small streams to the plant species pool of a managed landscape in Northern Wisconsin; To discuss the underlying mechanisms for species distribution within riparian zones; OBJECTIVES To examine plant species distribution across small streams (1 st – 3 rd order streams) in two managed landscapes: Western Washington and Northern Wisconsin; To quantify the contribution of small streams to the plant species pool of a managed landscape in Northern Wisconsin; To discuss the underlying mechanisms for species distribution within riparian zones;")
14
HYPOTHESIS The unique biophysical environment associated with small streams will result in a different community composition within riparian zones; however, the difference may not be significant immediately after disturbance (e.g., harvesting) because of the time lag necessary for demographic processes (reproduction, mortality, immigration, emigration) to result in compositional change.
 because of the time lag necessary for demographic processes (reproduction, mortality, immigration, emigration) to result in compositional change.")
15
Site Locations Washington Weather Station buffer edge (B 1 ) stream (S 0 ) buffer edge (B 2 ) B 2 +15 B 2 +30 B 2 +60 forest (F int ) clearcut (C int ) Five streams in three locations in W. Washington State were selected for pre- and post-harvest analysis of microclimate and vegetation.

16
One of the five streams used in W. Washington. Overstory is dominated by Douglas-fir, western hemlock, red alder, western red cedar, and grand fir.

17
Study Site: Chequamegon National Forest Northern Subsection Near Ashland, WI

18
A Northern Hardwood Landscape Upper Great Lakes Region

19
180 m

20
Data Source

21
Data Analysis 1)Explore changes in percent cover from stream to the upland by species (frequency and abundance); 2)Identify statistical and functional groups; and examine changes from the stream to upland (PC-Ord); 3)Compare species list with the species list of the landscape;
Explore changes in percent cover from stream to the upland by species (frequency and abundance); 2)Identify statistical and functional groups; and examine changes from the stream to upland (PC-Ord); 3)Compare species list with the species list of the landscape;")
22
Results Changes in mean (STD) woody debris and bare ground cover (%) from small streams to the upland in W. Washington.

23
Results Changes in mean (STD) grass and shrub cover (%) from small streams to the upland in W. Washington.

24
Results Changes in mean (STD) cover (%) of total vegetation and mosses from small streams to the upland in W. Washington.

25
Results Changes in mean (STD) cover (%) of selected plant species from small streams to the upland in W. Washington.

26
Conclusion: W. Washington Plant communities of managed riparian zones in Western Washington exhibited clear differences from upland forest. These differences, however, varied greatly among species and other measurements of community composition and structure. Specific conclusions thus can only be drawn when the measurement is specified.

27
Northern hardwood landscape and the riparian corridors in N. Wisconsin.

28
Results: A total of 92 plant species were recorded along 3 transects in N. Wisconsin, compared with 98 species along 7 transects in W. Washington. In W. Washington, 34 species were identified as riparian species, but >50 species appeared to be riparian species in N. Wisconsin.

29
Distance from Stream (m) Cover (%) Changes in species cover (%) from streams to upland in a northern hardwood landscape, WI
 Cover (%) Changes in species cover (%) from streams to upland in a northern hardwood landscape, WI")
30
Results Changes in mean (STD) cover (%) of selected plant species from small streams to the upland in N. Wisconsin.

31
Results: More riparian species than upland species were detected in this unmanaged ecosystem. RiparianUpland Abies balsameaAmelanchier sp. Aster ciliolatusAralia nudicaulis Athyrium felix-femina Bromus altissimus Calamagrosis canadensis Calamagrosis stricta Caltha palustris Carex bromides Carex disperma

32
Question: How much do riparian zones contribute to the cumulative richness and abundance of plant species at the landscape-level?

33
168- 50m 2 Plots Sampled 10% of Plots Within Each Patch Type Left Out For Model Validation 9 Interior Types 1 Edge Zone 2 Road Zones Current Vegetation and Locations of Sampling Plots

34
Summary Total number of species:333 Common to all patches:98 (29.4%) Unique species:0 Restricted to the eight patches:32 No. of exotic species:14

35
Conclusion: N. Wisconsin Riparian communities in N. Wisconsin clearly play different roles in the landscape from those in W. Washington. Not only did these undisturbed riparian zones host more unique species, our preliminary analysis indicated that they also contributed significantly to the landscape level species pool.

36
Wed. (3/25): Riparia Flood Pulse Concept (FPC) Case studies of Whooping Crane in NE Water spill over in SE USA Salmon and N in Alaska Summary of Riparia functions (Naiman et al. 2005 – Chapter 6) Dam management and removal
: Riparia Flood Pulse Concept (FPC) Case studies of Whooping Crane in NE Water spill over in SE USA Salmon and N in Alaska Summary of Riparia functions (Naiman et al – Chapter 6) Dam management and removal.")
Similar presentations


 Karl M. Polivka, Pacific Northwest Research Station, USDA Forest Service.>")


 for the Lakewood and Laona Districts of the Nicolet National Forest Jeanette Jaskula, Monica Hauck- Whealton,>")