Download presentation
Presentation is loading. Please wait.

1
July 22, 2015 ESRI User Conference San Diego, CA National Hydrography Dataset Plus News

2
2 Concepts Data Tools Applications Resources

3
3 Question: Explain one of the processes by which water can be made safe to drink. Answer: “Flirtation make water safe to drink because it removes larger pollutants like grit, sand, dead sheep and canoeists.” Question: How is dew formed? Answer: “The sun shines down on the leaves and make them perspire.” Question: What causes the tides in the oceans? Answer: “The tides are a fight between the earth and the moon. All water tends to flow towards the moon, because there is no water on the moon, and nature hates a vacuum. I forget where the sun joins in this fight.” Question: Where is the water at any point in time? Answer: “We’re still working on that … here’s what we have so far.”

4
4 NHDPlus Team Tommy Dewald / EPA Office of Water Cindy McKay / Horizon Systems Corporation Tim Bondelid / Consultant Al Rea / USGS National Geospatial Program Craig Johnston, Rich Moore / USGS Water (Greg Schwarz, Kernell Ries, Dave Wolock / USGS Water)
")
5
Tommy Cindy Al Rich Craig (Dwane) (Ricardo) Tim
 (Ricardo) Tim")
6
The National Hydrography Dataset is the Foundation The NHD is comprised of the surface water features found on topographic maps combined to form a stream network with addresses.

7
National Hydrography Dataset (NHD) Watershed Boundary Dataset (WBD) National Elevation Dataset (NED) 7 NHDPlus – integrates the …
 Watershed Boundary Dataset (WBD) National Elevation Dataset (NED) 7 NHDPlus – integrates the …")
8
8 NHDPlus NHDPlus (National Hydrography Dataset Plus) Primary ingredient datasets National Hydrography Dataset National Elevation Dataset Watershed Boundary Dataset Additional stream attributes include stream order flow volume and velocity Catchments and attributes precipitation temperature land cover large user-developed collection Flow direction and accumulation grids Developed by USEPA and USGS-Water to provide flow volume and velocity estimates for pollution dilution modeling on the NHD network Catchments tie the landscape to the stream network forming a ‘surface water geofabric’
 Primary ingredient datasets National Hydrography Dataset National Elevation Dataset Watershed Boundary Dataset Additional stream attributes include stream order flow volume and velocity Catchments and attributes precipitation temperature land cover large user-developed collection Flow direction and accumulation grids Developed by USEPA and USGS-Water to provide flow volume and velocity estimates for pollution dilution modeling on the NHD network Catchments tie the landscape to the stream network forming a ‘surface water geofabric’")
9
Integrated 19822012 5-10 yrs? 10-15 yrs? Geofabric RF1 Med Res High Res LiDAR NHDPlusV2 NHDPlus NHDPlus Base Layers Network (NHD) 500k 100k 24k or better* Elevation 100m 30m 10m 3m Hydrologic Units (WBD) 24k or better* (*24k or better = patchwork quilt that includes LiDAR-based data) An Evolving Surface Water Geofabric 9 EPA/USGS-W EPA/USGS-W USGS-M USGS-M
 500k 100k 24k or better* Elevation 100m 30m 10m 3m Hydrologic Units (WBD) 24k or better* (*24k or better = patchwork quilt that includes LiDAR-based data) An Evolving Surface Water Geofabric 9 EPA/USGS-W EPA/USGS-W USGS-M USGS-M.")
10
10 Completed – HI, USVI, Puerto Rico Under development Pacific Trust Territories (Guam, American Samoa, Northern Mariannas) Time of travel estimates Denormalized Vector National Seamless FGDB pilot Assessing feasibility – Alaska for Matsu, Kenai and other areas with water quality impairments
 Time of travel estimates Denormalized Vector National Seamless FGDB pilot Assessing feasibility – Alaska for Matsu, Kenai and other areas with water quality impairments")
11
11 … Streamflow Estimates Completed 30Yr mean annual flow and velocity 30Yr mean monthly flow and velocity Under development 7Q10 flows (evaluating different regionalized estimation techniques in FY15-16) Mean daily flows (planned by USGS Water Census) Forecasting future flows (substituting forecasted streamflow estimation model inputs) Open Water Data Initiative – National Flood Interoperability Experiment pilot Open for discussion How can we improve our stream characteristics?
 Mean daily flows (planned by USGS Water Census) Forecasting future flows (substituting forecasted streamflow estimation model inputs) Open Water Data Initiative – National Flood Interoperability Experiment pilot Open for discussion How can we improve our stream characteristics")
12
12 Script that confirms available updates to your local NHDPlus holdings Desktop tools – data prep script, navigation, watershed delineation, and catchment attribute allocation and accumulation (CA3T) Web Services EPA – ESRI mapping and analytical services including navigation, watershed delineation and report Open Water Data Initiative pilot ESRI and open source mapping services with flow direction and network/non-network flowline breakout for denormalized vector seamless FGDB Analytical services are up next
 Web Services EPA – ESRI mapping and analytical services including navigation, watershed delineation and report Open Water Data Initiative pilot ESRI and open source mapping services with flow direction and network/non-network flowline breakout for denormalized vector seamless FGDB Analytical services are up next")
15
15 Who’s Using NHDPlus? Email poll (4/17/2013) Please send us a simple one line description for each of your NHDPlus applications. Within a week, we received 50 responses from the following organizations describing over 100 applications. EPA – HQ (6), regions (6), labs (4) USGS – HQ & Water Science Centers (6) Other feds – COE, NOAA, USFS, NPS, States (6) NGO - Nature Conservancy (4 offices), Conservation Fund Institute ESRI Technical support requests (5/2013 - 9/2014) domain # organizations gov6 com23 edu27 us (state)10 org11 mil2 net2 total81
 Please send us a simple one line description for each of your NHDPlus applications. Within a week, we received 50 responses from the following organizations describing over 100 applications. EPA – HQ (6), regions (6), labs (4) USGS – HQ & Water Science Centers (6) Other feds – COE, NOAA, USFS, NPS, States (6) NGO - Nature Conservancy (4 offices), Conservation Fund Institute ESRI Technical support requests (5/ /2014) domain # organizations gov6 com23 edu27 us (state)10 org11 mil2 net2 total81.")
16
Google It! Text search for 'nhdplus' found 'About 15,400 results’ Images search for ’nhdplus’ found a rich collection …

17
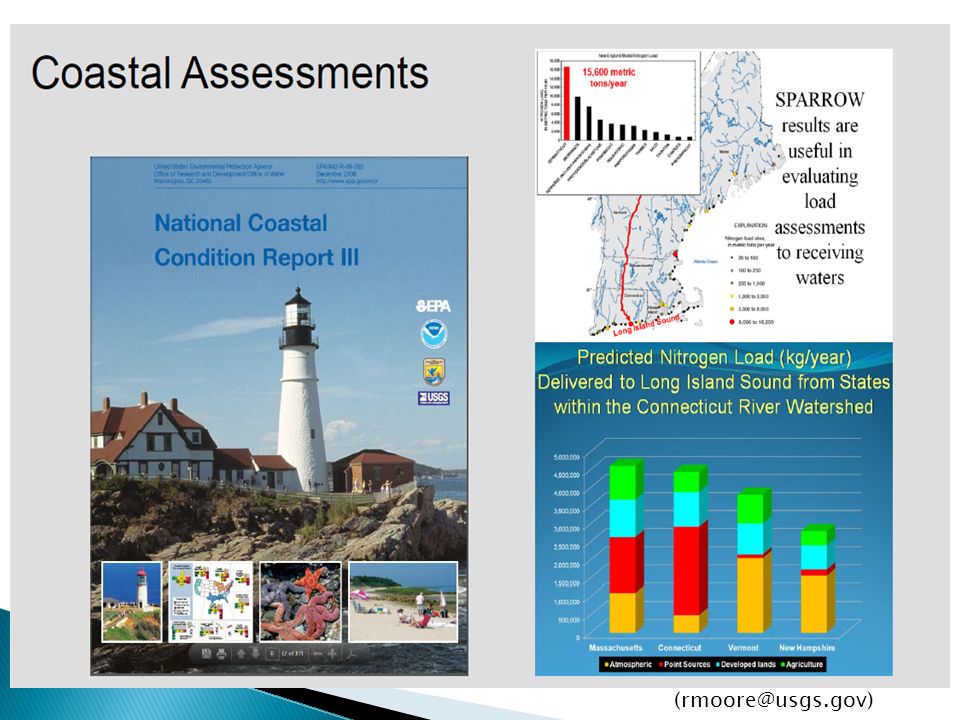
17 How is NHDPlus Being Used? Classic applications EPA National Aquatic Resource Surveys EPA Reporting on water quality EPA Pesticide risk assessments USGS SPARROW water quality modeling DTRA ICWater spill response Others Open Water Data Initiative South Carolina Stream Assessment Idaho Lake Monitoring Plan

18
18 << NHDPlus is also used to support data analysis, such as delineating drainage areas and associated attributes for sampled sites. (epa.gov/type/watersheds/monitoring/aquaticsurvey_index.cfm) Drainage Area = 114.24 km 2 NLCD 2001 Land Cover : - Residential = 7.86 km 2 - Forest = 86.42 km 2 - Agriculture = 12.64 km 2 - Wetlands = 7.32 km 2 NHDPlus serves as the basis for establishing the NRSA and NLA survey sample frames – from which a representative set of sample sites are randomly selected. >>
 Drainage Area = km 2 NLCD 2001 Land Cover : - Residential = 7.86 km 2 - Forest = km 2 - Agriculture = km 2 - Wetlands = 7.32 km 2 NHDPlus serves as the basis for establishing the NRSA and NLA survey sample frames – from which a representative set of sample sites are randomly selected. >>.")
19
How much surface water have we assessed in the continental United States? Coastal: >35,000 square miles Lakes: >110,000 lakes Rivers/streams: >1.9 million miles Wetlands: >62,000,000 acres 2015

20
(rmoore@usgs.gov)
21
Clean Water Act Section 303(d) Performance Measures
 Performance Measures")
22
Modeling Possible Effects on Endangered Species from Pesticide Use Chemical X Input (any stream with use) Chemical X Downstream (exceeds threshold) Chemical X (thawley.michelle@epa.gov)
 Chemical X Downstream (exceeds threshold) Chemical X")
23
Model velocity Measured velocity Spill site Intake West Virginia Chemical Spill Response (william.b.samuels@leidos.com)

24
Subcommittee on Spatial Water Data 24 Open Water Data Initiative - Use Cases - Chemical Spill – Charleston, WVFlood - Jefferson City, MODrought - Texas Water SupplyWater Quality

25
South Carolina Stream Assessment Conservation Planning Tool Downstream Cumulative Effects (Spatial View) (scottm@sc.dnr.gov)
")
26
Developing a Strategic Lake Monitoring Plan Idaho Department of Environmental Quality (jim.szpara@deq.idaho.gov)

27
27 Web site (on the move to EPA Drupal environment) User Guide Exercises Web-based training (under development) Data and metadata Core tools and web services Applications directory with contacts (share your work!) Presentations Technical support and application consultation On the Web – Google … ‘nhdplus’ for data, tools, documentation ‘epa waters’ for EPA applications, web services
 User Guide Exercises Web-based training (under development) Data and metadata Core tools and web services Applications directory with contacts (share your work!) Presentations Technical support and application consultation On the Web – Google … ‘nhdplus’ for data, tools, documentation ‘epa waters’ for EPA applications, web services")
28
28 NHDPlus – Other News New USGS-EPA Memorandum of Understanding formalizes shared maintenance of NHD, NHDPlus & WBD Leveraging partner contributions EPA Office of R&D catchment attributes USGS-Water network updates USGS-NGP production tool improvements Medium and High Resolution NHDPlus Same core production team Improvements to existing production tools (including data model) for high res NHDPlus will benefit any future medium res production Planning for same data model
 for high res NHDPlus will benefit any future medium res production Planning for same data model")
29
29 JAWRA Issue on Open Water Data Initiative Fall 2015 National Water Quality Monitoring Conference May 2016 – Tampa, FL EPA Total Maximum Daily Load Workshop Jun 2016 – Shephardstown, WV ESRI User Conference Jun-Jul 2016 – San Diego, CA AWRA Specialty Conference on GIS and Water Resources Jul 2016 – Sacramento, CA

30
Tommy Dewald EPA Office of Water dewald.tommy@epa.gov Questions? (On the Web - Google ‘nhdplus’) (We welcome your ideas and feedback) Ruth Patrick (1908-2013) was a pioneer in studying the health of freshwater streams and rivers who laid the scientific groundwork for modern pollution control efforts. She thought that, ultimately, the reason for studying all this was to help to improve human life and the life of the natural world.
 (We welcome your ideas and feedback) Ruth Patrick ( ) was a pioneer in studying the health of freshwater streams and rivers who laid the scientific groundwork for modern pollution control efforts. She thought that, ultimately, the reason for studying all this was to help to improve human life and the life of the natural world..")
Similar presentations


 HIS Symposium March 8 Prepared & Presented by Horizon Systems Corporation Sponsored by US Environmental Protection Agency.>")


 EPA Office of Water May 12, 2014 AWRA Specialty Conference on GIS and Water Resources.>")
>")


