Download presentation
Presentation is loading. Please wait.

1
Rebooting finance in public higher education Jane Wellman AASCU Annual Meeting Charleston, SC November 22, 2010

3
GroupDefinition of ProblemSolution PublicCaught between growing importance and decreasing access Protect access at all costs! State Financial Officers (and legislators) Need more college graduates Increase productivity and retention! FacultyDeteriorating quality of students and declining standards Raise standards, improve K-12, stop talking about productivity! College PresidentsCaught in iron triangleReinvest in higher education! Outside inside: the fractured dialogue about college costs and the road ahead Source: John Immewahr, Villanova University, based on research for Public Agenda.
 Need more college graduates Increase productivity and retention. FacultyDeteriorating quality of students and declining standards Raise standards, improve K-12, stop talking about productivity. College PresidentsCaught in iron triangleReinvest in higher education. Outside inside: the fractured dialogue about college costs and the road ahead Source: John Immewahr, Villanova University, based on research for Public Agenda..")
4
The problem of multiple –and sometimes conflicting – truths 4

5
American higher education is the richest in the world = we have the money, we just need to spend it better True: According to OECD, US spending per capita $19,746/student – compared to OECD average of $8,415 Not so true: OECD countries exclude benefits, and US figures include private colleges. 5 OECD, Education at a Glance 2009, Table B.1., annual expenditure per student For core educational services only (excludes research and organized activities).
..")
6
Source: Delta Cost Project IPEDS Database, 1987-2008; 10-year matched set. Economic stratification in US postsecondary education WHERE THE MONEY GOES, WHERE THE STUDENTS ARE ENROLLED 6

7
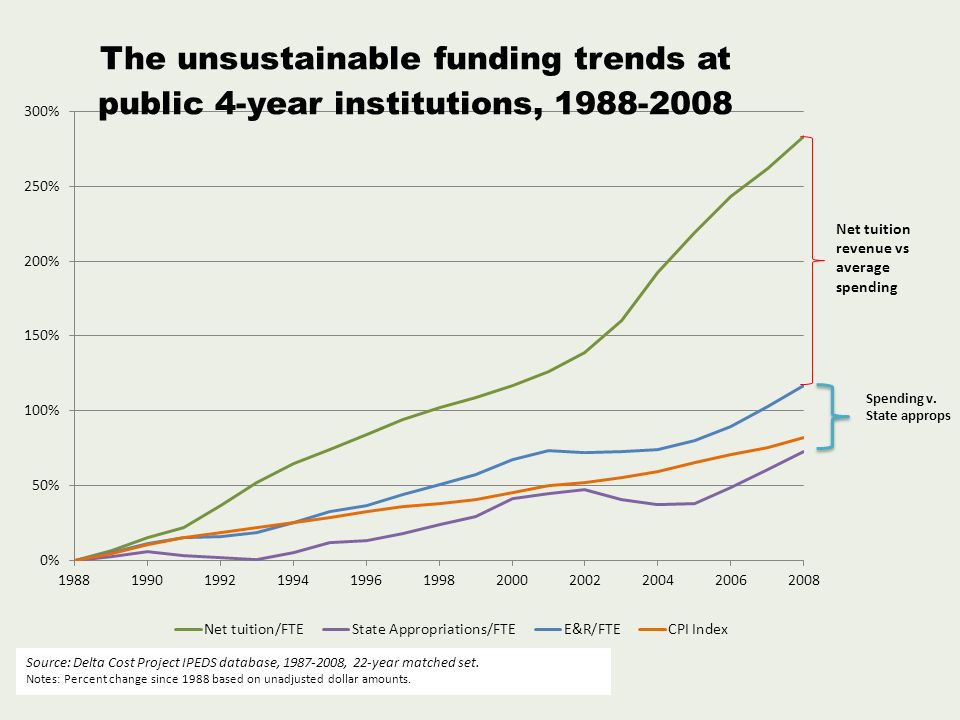
Tuitions are going up because of out of control spending True: tuitions are increasing faster than almost any other commodity And before the recession spending per student did go up 3% year over inflation/enrollment in private research universities But actual spending per student didn’t increase much at all in public institutions – barely above 1% in research universities and flat or declining in masters’ institutions and community colleges 7

8
Sources: College Board, “Trends in College Pricing, 2008”; Bureau of Labor Statistics, 2009, www.bls.gov ; U.S. Census, Current Population Study-ASEC, 2008.www.bls.gov

9
… where the money goes by major functional area

10
Changes in subsidy share of costs Source: Delta Cost Project IPEDS Database, 1987-2008; 10-year matched set.

11
The primary driver of costs is faculty salaries – which can’t be reduced because of tenure True: spending on faculty is the largest single spending area False: faculty are not the majority of employees Spending on faculty is declining relative to other areas And most increases in compensation are going to benefits 11

12
In 2009, 46% of all employees in public and private non-profit institutions have faculty status –Compared to 23% in for-profit institutions Of these, the percent with tenure or on track: –Public four-year: 70% –Private four-year: 61% –For profit: 0.4% % of instructional titles with part-time status: –52% 12

13
% Changes in faculty compensation, 1979 – 2008 (in 2009 constant dollars ) 13 SalaryBenefits Public Research26%78% Private Research41%98% Public Masters11%59% Private Masters23%83% Public two-year8%65%
 13 SalaryBenefits Public Research26%78% Private Research41%98% Public Masters11%59% Private Masters23%83% Public two-year8%65%")
14
National averages, spending per FTE student in 2008-9 Public research universities Public masters institutions Public community colleges Instructional salaries exclusive of benefits 677139231918 Student services spending 384122081417 Employee benefits576231531913 14

15
States can save money by shifting students to community colleges True: cost per student in the community colleges on average is 14% less than in public masters’, and 34% less than public research costs BUT the state share of costs is higher – in many states subsidy costs are higher than in masters’ institutions AND cost per degree is actually higher in CCs 15

16
Spending and subsidies per Student – national averages Public researchPublic mastersPublic CCs E&R spending per student $15,619$12,185$10,396 State and local subsidy per student $8,055$6,578$7,404 16

17
Spending per Degree and Completion, AY1998-2008 (in 2008 $) Source: Delta Cost Project IPEDS Database, 1987-2008, 11-year matched set. Education and Related (E&R) Spending per Degree Education and Related (E&R) Spending per Completion (Award) 19982003200720081998200320072008 Public Research $59,225$61,521$62,617$64,009$58,350$60,576$61,436$62,654 Public Master's $50,481$53,477$53,600$55,292$49,922$52,507$52,532$54,252 Community Colleges $87,617$76,309$72,830$73,709$47,798$47,634$45,732$45,949
 Spending per Degree Education and Related (E&R) Spending per Completion (Award) Public Research $59,225$61,521$62,617$64,009$58,350$60,576$61,436$62,654 Public Master s $50,481$53,477$53,600$55,292$49,922$52,507$52,532$54,252 Community Colleges $87,617$76,309$72,830$73,709$47,798$47,634$45,732$45,949.")
18
Spending is going up because of under- prepared students… and the costs of remediation 18 True: Underprepared students are less likely to succeed, and we DON’T have a good track record with success in remedial/developmental Education BUT: we don’t know what we spend on remediation – on a per student basis Remedial education is cheap – as is most ld/ug education – in public institutions, likely a net revenue-producer

19
The reality of cross-subsidies Level of instructionSCH generated as a percentage of total SCH Instructional spending as a percentage of all instructional spending Lower division35%21% Upper Division45% Graduate20%34% 19 Data from 2002-2007 for Ohio, Florida and Illinois public four-year institutions; and 1995 – 2004 for SUNY. Report available at http://www.sheeo.org/finance/SHEEO_Cost%20Study%20Report_2010.pdf

20
For more information, go to: Delta Cost Project http://www.deltacostproject.org http://tcson-line.org 20

Similar presentations

 Interrelated surveys conducted annually by the National Center for Education Statistics (NCES)>")


 101 North Front.>")


 WICHE (Western Interstate.>")
, 2003-04 to.>")

