Download presentation
Presentation is loading. Please wait.

1
Michael Notaro U.W. Madison Center for Climatic Research mnotaro@wisc.edu OCT2004OCT2004

2
- Later continue study to predict future changes in vegetation and climate - Study the impact of rising levels of equivalent carbon dioxide on global vegetation and climate - Evaluate FOAM-LPJ model - Focus on higher latitudes - Compare findings with satellite data and tree ring data

3
DATASETS - Global Potential Vegetation (Ramankutty and Foley, 1999) - Global Continuous Fields of Vegetation Cover for 1992-1993 (DeFries et al., 1999; 2000) - Pathfinder V3 AVHRR FPAR (1981-2001) (Myneni et al., 1997) - HYDE Global Historical Land Cover for 1900 and 1990 (Goldewijk, 2001; Goldewijk and Battjes, 1997) - International Tree-Ring Data Bank’s Tree Ring Width (212 sites) (1800-1999) (45ºN-75ºN) (<500m) (standardized) - NCEP-NCAR Reanalysis (Kalnay et al., 1996) - NASA GISS Land-Ocean Surface Air Temperature Anomalies (1900- 1999) (Hansen et al., 1999; Reynolds and Smith, 1994; Smith et al.,1996) - Climatic Research Unit’s CRUTEM2 Monthly Land Air Temperature Anomalies (1851-2003) (Jones and Moberg, 2003) - NOAA Extended Reconstruction SST (ERSST) (1900-1999) (Smith and Reynolds, 2003) - Xie-Arkin CPC Merged Analysis of Precipitation (1979-2001) (Xie and Arkin, 1996; 1997) - CRU TS2.0 Land Surface Precipitation (1901-2000) - Willmott-Matsuura V1.01 Temperature and Precipitation (1950-1996) (Willmott and Matsuura, 2000)
 - Global Continuous Fields of Vegetation Cover for (DeFries et al., 1999; 2000) - Pathfinder V3 AVHRR FPAR ( ) (Myneni et al., 1997) - HYDE Global Historical Land Cover for 1900 and 1990 (Goldewijk, 2001; Goldewijk and Battjes, 1997) - International Tree-Ring Data Bank’s Tree Ring Width (212 sites) ( ) (45ºN-75ºN) (<500m) (standardized) - NCEP-NCAR Reanalysis (Kalnay et al., 1996) - NASA GISS Land-Ocean Surface Air Temperature Anomalies ( ) (Hansen et al., 1999; Reynolds and Smith, 1994; Smith et al.,1996) - Climatic Research Unit’s CRUTEM2 Monthly Land Air Temperature Anomalies ( ) (Jones and Moberg, 2003) - NOAA Extended Reconstruction SST (ERSST) ( ) (Smith and Reynolds, 2003) - Xie-Arkin CPC Merged Analysis of Precipitation ( ) (Xie and Arkin, 1996; 1997) - CRU TS2.0 Land Surface Precipitation ( ) - Willmott-Matsuura V1.01 Temperature and Precipitation ( ) (Willmott and Matsuura, 2000)")
4
Fraction of Photosynthetically Active Radiation MEAN TREND

5
April-October 1982-2000 FPAR Anomalies

6
FOAM = Fast Ocean Atmosphere Model (Jacob, 1997) - R15 (PCCM3+OM3) LPJ = Lund-Potsdam-Jena dynamic vegetation model (Sitch, 2000) - 1.4°x2.8° FOAM-LPJ = fully coupled global atmosphere-ocean-land model with dynamic vegetation
 - R15 (PCCM3+OM3) LPJ = Lund-Potsdam-Jena dynamic vegetation model (Sitch, 2000) - 1.4°x2.8° FOAM-LPJ = fully coupled global atmosphere-ocean-land model with dynamic vegetation")
10
Percent difference (Model-Obs) in Annual Average Land Precipitation (Obs = Xie Arkin 1979-2001) Contours: 20, 50, 100, and 300% W W W W W D D
 in Annual Average Land Precipitation (Obs = Xie Arkin ) Contours: 20, 50, 100, and 300% W W W W W D D")
11
January and July FPAR JANJUL OBSOBS MODELMODEL

12
Model Obs 19001990 FCDiff Comparison of Simulated and Satellite-Based % Tree Cover

13
1950-1996 Surface Air T Change (Willmott-Matsuura) ANNUALANNUAL DJFDJF
 ANNUALANNUAL DJFDJF")
14
Change in Simulated Surface Air T Shading: <0.10

15
Change in Simulated Surface Air T (DJF) Shading: <0.10
 Shading: <0.10")
16
Trend in Simulated Precipitation RP P R

18
Global Annual T DJF T (Land 38-60N, 120W-140E Global Annual SST Global Tree Cover 40-75N Boreal Summerg Tree Cover MJJAS FPAR

19
TREE COVERVEGETATION COVER

20
Trend In % Forest Cover RP R P

21
Change in FPAR RP AVHRR R P Remote

22
Percent Change in Evapotranspiration (Run P)
")
23
Decomposition of Simulated FPAR For the 9 pft’s, f = vegetation cover fraction d = seasonal leaf cover fraction Mean FPAR with no trend Change in leaf cover or length of growing season (GDD) Change in fractional vegetation cover Interactions or feedbacks between f and d (small)
 Change in fractional vegetation cover Interactions or feedbacks between f and d (small)")
24
Trend

27
DECIDUOUSEVERGREEN

28
Tree Ring Width Apr-Oct T Ring Width RP P R

29
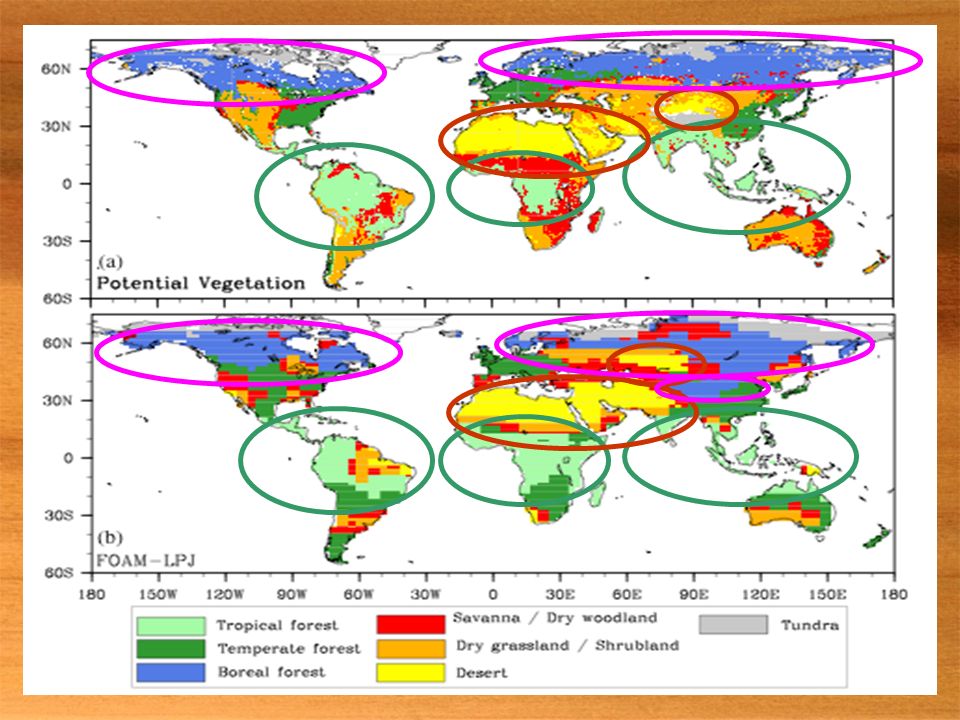
CONCLUSIONS - Both satellite data and FOAM-LPJ reveal a global greening trend and poleward expansion of the northern boreal forest - The radiative forcing is responsible for most of the warming trend, although the physiological forcing contributes some additional local warming. - While the physiological forcing dominates the global greening trend, both forcings play a role in the boreal expansion. - FOAM-LPJ captures the major global biomes but overproduces tree cover due to FOAM’s wet bias and LPJ’s woody bias.

Similar presentations


 By: J. Shukla et. all Combined Climate and Carbon-Cycle.>")


Smith et al. 2015 Spurious ocean data? CERES ERBS/reconReanalysis/recon.>")
>")
![The last century of warming…. GISS SAT England et al. [2014] Nature Climate Change.](/18/5677964/big_thumb.jpg "The last century of warming…. GISS SAT England et al. [2014] Nature Climate Change.>")


