Download presentation
Presentation is loading. Please wait.

1
Item 7. SAMPLING AND LMOs DETECTION 7.3. IDENTIFICATION OF LMOs

2
Detection is required when:
By law in the country is required identification and/or labelling Mixtures between GMOs + non-GMOs Need to export to a country with strict legislation Need to verify non-GMOs shipments For environmental risk verifications

3
In the international market
Important focus differences between commercial blocks: USA does not require identification and GM crops are easily set free into the environment EU requires labelling with 0.9% treshold

5
“Historical” cans of GM tomato puree with long shelf life
First GM-food authorized 1994 They were labelled… and people bought them!!! The variety lost sensory characteristics and was retired from the market

6
Extraction of: Sampling Protein DNA RTq-PCR Immunostrips PCR end point
ELISA plates Protein PCR end point DNA RTq-PCR

7
In order to detect proteins, specific antibodies are required
In order to detect proteins, specific antibodies are required. The antibodies are proteins with quaternary structure.

8
Lateral flow test, IMMUNOSTRIP
Control line. Antibodies anti-IgG adsorbed Test line. Antibodies anti-antigen adsorbed Antibodies anti-antigen conjugated with enzyme

9
Lateral Flow test, IMMUNOSTRIP
The antibodies are binded to their antigen in the sample and the complex antigen-antibody moves by capillarity towards the reaction lines.

10
Lateral Flow test, IMMUNOSTRIP
Antigen binds to the antibodies that are in the test line. Free antibodies bind to the antibodies anti-Ig present in the control line.

11
Immunostrip procedure
1. Weigh 250 mg of fresh leaf (plantlet) 2. Insert the sample in the bag 3. Grind or crush the sample 5. Let stand for 10 minutes (vertical position) 4. Insert the immunostrip into the bag with SEB or MEB buffer. 6. Read results
 2. Insert the sample in the bag. 3. Grind or crush the sample. 5. Let stand for 10 minutes (vertical position) 4. Insert the immunostrip into the bag with SEB or MEB buffer. 6. Read results.")
12
Qualitative immunoassay in strip.
Ej. Cry9C QuickStixTM Envirologix

13
Also by this technique can be detected CP4-EPSPS protein in samples with low % of transgenic maize
IMMUNOSTRIP Cry 1Ab/Ac Maíz BT 11 10% 1% 0.5% 0.1% IMMUNOSTRIP CP4 EPSPS Maíz NK603 10% 1% 0.1% 0.05%

14
Enzyme-Linked-ImmunoSorbent Assay
ELISA: Enzyme-Linked-ImmunoSorbent Assay Format: DAS (Double Antibody Sandwich) The first Ac is adsorbed to the plate
 The first Ac is adsorbed to the plate.")
15
Enzyme-Linked-ImmunoSorbent Assay
ELISA: Enzyme-Linked-ImmunoSorbent Assay Formato: DAS (Double Antibody Sandwich) Sample that contains protein is added Protein
 Sample that contains protein is added. Protein.")
16
Enzyme-Linked-ImmunoSorbent Assay
ELISA: Enzyme-Linked-ImmunoSorbent Assay Format: DAS (Double Antibody Sandwich) Second antibody is added. It is conjugated with a enzyme Enzyme Antibody
 Second antibody is added. It is conjugated with a enzyme. Enzyme. Antibody.")
17
Enzyme-Linked-ImmunoSorbent Assay
ELISA: Enzyme-Linked-ImmunoSorbent Assay Formato: DAS (Double Antibody Sandwich) Colorless compound Product Enzyme Antibody
 Colorless. compound. Product. Enzyme. Antibody.")
18
ELISA plate, second antibody congujated to alkaline phospatase

19
Quantitative Immunoassay (ELISA)
Centrifugation to clarify samples Sample extraction. Preparation of ELISA plates

20
Incubation at room temperature Sample application
ELISA cont. Incubation at room temperature Sample application Substrate addition/ Colour development Spectrophotometric measurement for quantification- Wash

21
Specificity assesment of antibodies in the ELISA test
KIT Cry 1Ab/1Ac KIT CP4 EPSPS A B C D E F G H A B C D E F G H 1 2 3 A MEB Cry 1Ab/1Ac NK 603 B C CP4 Cry 3A Bt 11 D E NPT II Cry 3Bb1 MON 810 F G Cry 2A Cry 1C Chalqueño H

22
Quantitative Analysis by ELISA in detection of protein CP4-EPSPS
A B C D E F G H 1 2 3 4 5 A MEB 0.125 % Mon % Nk603 10% Bt11 10% B Mon810 10% Bt % C 1% 0.062 % Mon810 1% Nk603 1% Bt % D E 0.5% 0.031 % Mon % Nk % Bt11 0.1% F G 0.25% 0.015 % Chalqueño Control Negativo H Control Negativo

23
Detection thresholds of three transgenic maize events
CP4-EPSPS protein can be detected with high sensitivity in mixtures with low percentage of transgenic maize. Sensitivity for detection of CRY proteins is much lower.

24
Considerations: Immunochemical methods
Immunochemical methods can be realized in fast ways, in situ, or in laboratory, few equipment is required. Strip based methods are only qualitative. ELISA can be quantitative but: Different levels of protein expression are reflected in different sensitivity levels No reference materials recognized. No agreement between quantification units (% in weight or protein concentration)
")
25
PCR principles Double chain opening (~90°C) –denaturation-
Primers that recognize specific sequences (50- 60°C) Synthesis of template complementary chains (74°C) 3’ ’ 5’ Sequence of interest Synthesis of one copy Taq polymerase 3’ Primers are small DNA molecules of defined sequence designed to recognize specific sequences within the genetically modified DNA present in a GMO. Once bound, primers become starting points from which Taq polymerase can synthesize a copy of a portion of the genetically modified sequences. 3’ 5’ 5’ ’
 Synthesis of template complementary chains (74°C) 3’ 5’ 5’ Sequence of interest. Synthesis of one copy. Taq polymerase. 3’ Primers are small DNA molecules of defined sequence designed to recognize specific sequences within the genetically modified DNA present in a GMO. Once bound, primers become starting points from which Taq polymerase can synthesize a copy of a portion of the genetically modified sequences. 3’ 5’ 5’ 3’")
26
Amplification: Amplification Sequence of interest Taq Taq Taq Taq
When the Taq polymerase reaction is allowed to take place over and over again, many copies of the recombinant “target sequence” are made. Each Taq polymerase cycle doubles the number of copies. Beginning with one copy, two are made, and from that, four, and from that 8…. Taq

27
Number of DNA molecules 1 2 4 8 16 32 64 128 256 512 1024 1,000,000
Number of PCR cycles 1 2 3 4 5 6 7 8 9 10 20 30 40 Number of DNA molecules 1 2 4 8 16 32 64 128 256 512 1024 1,000,000 1,000,000,000 1,000,000,000,000 Continuing on, ten cycles generate more than 1000 copies of the original target sequence, 20 generate 1,000,000, thirty generate 1,000,000,000, and 40 generate 1,000,000,000,000. We normally run between 30 and 40 cycles. Obviously this is a very powerful amplification process, which is the basis for a highly sensitive detection method.

28
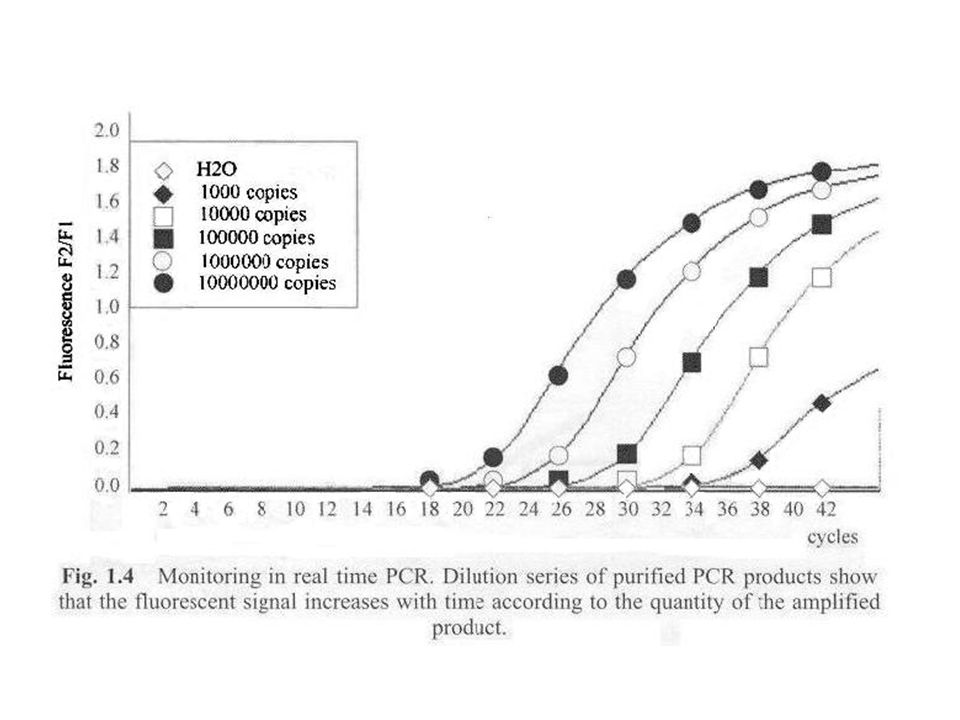
Cycle number PCR products Theoretical Real

29
Factors to consider Specificity – primer design
Product length (DNA amplified fragment) There are differences between qualitative and quantitative tests Whether PCR is uniplex or multiplex If the method is specific for a type of instrument
 There are differences between qualitative and quantitative tests. Whether PCR is uniplex or multiplex. If the method is specific for a type of instrument.")
30
Primer design P E H G T LOW HIGH 1. Exploration
Target specificity 1. Exploration 2. Gene specific target 3. Specific construct 4. Event specific target H Host genomic DNA P Promoter element (CaMV 35S) E Amplifying element G Gene of interest (Cry, EPSPS) T Terminator (NOS)
 E Amplifying element. G Gene of interest (Cry, EPSPS) T Terminator (NOS)")
31
Recombinant Gene Amplicons PCR for transgenic sequence detection A B C
1 2 3 4 5 In each case we have selected primer sets that span a unique sequence junction, that is, a site where two sequence elements have been joined in a manner unique to that event. Thus, a positive signal with these primer sets is definitive evidence for the presence of the respective event in the sample of interest. This is an example of a recombinant gene that has been created by splicing five different pieces of DNA, from five different organisms, together. These are sequences 1, 2, 3, 4, and 5. The Green bars flanking seqauences 1 and 5 represent corn genomic DNA sequences. The recombinant gene was inserted into a unique site within the corn genome, thus these are unique sequences. We show 4 different primer sets that could be used to detect this gene. Primer sets A and C detect sequences that are wholely within a single one of the five sequence elements that have been spliced together to make this recombinant gene, sequences 1, and 5, respectively. Because these two primer sets reside within a single DNA sequence element, they are unable to distinguish between the original genes, from which sequence elements 1 and 5 were obtained, and the recombinant gene, shown in the diagram. The same product will be made from these primers in either case. Primer set B, however, consists of one primer that recognizes sequence 1 and another that recognizes sequence 2. These two sequences do not exist in nature in the same gene, so the only case in which a PCR product will be made from this primer set will be when sequence elements 1 and 2 are juxtaposed, as is the case in the recombinant gene. Only then will these two sequences be juxtaposed in a manner that will allow PCR amplification to occur. Thus this primer set is specific for DNA isolated from the recombinant organism. Similarly primer set D includes one primer set specific for sequence 5 and one specific for the corn genomic sequences flanking the recombinant gene. As with primer set A, PCR products will be made from primer set D only when the recombinant gene is present, because only then will sequence 5 and the corn genomic sequences be juxtaposed. Thus primer set D is also specific for DNA isolated from the recombinant organism. Primer sets such as set B and set D both are capable of definitively identifying specific varieties of GM corn. MAFF claims to be using primer sets similar to set D. They claim that only they have access to the sequence information necessary to develop such primers. And therefore that only they can carry out definitive varietal analysis. The fact is that any properly trained molecular biologist can go into the laboratory and develop such primer sets based only on information that is in the public domain. Genetic ID has the capacity to develop primer sets such as set D and such as set B, and we use such primer sets in our varietal tests to definitively identify specific transgenic “events” or varieties, and at the same time to distinguish between DNA from transgenic corn and DNA from contaminating organisms or microorganisms. A B C D Amplicons

32
DNA of GM grains Recombinant gene Genomic DNA
We use three GMO specific primers so that we have a strong internal cross-check. Information theory indicates that redundancy of information increases certainty. If we were to use only a single GMO-specific primer set, there would be no way to confirm a positive signal. If we were to use two GMO specific primer sets, we could carry out one cross-check to confirm the result. If we run three GMO specific primer sets, we can carry out three pair-wise cross checks. This increases the certainty of the result by three fold.

33
DNA of non-GM grains No amplification
Specific-specie primers recognize genomic DNA DNA of non-GM grains Genomic DNA Specific-GMO primers do not interact No amplification Results for a non-GMO sample.

34
Intrinsic factors of the sample that affect the amplification
Integrity of template DNA Size of the amplicon Presence of inhibitory substances Humic substances Proteins Others: EDTA NaOH SDS and other detergents

35
1 Ladder 2A Seeds 2B Commercial nixtamal flour 3 Dough 4 Nixtamal flour 5 Tortilla 6 Tortilla chips 7 Corn chips 8 Dry Corn chips Load: 100ng Dye: SYBR Green

36
DNA Extraction Extraction yield DNA purity Quality for amplification
Tissue DNA purity Quality for amplification

37
Amplification – effect of the purity of the DNA template
S 225 pb E HJ HJS HM HMS Es P C- A 225 pb C- M HM HMS HJ HJS S E P C C- 225 pb M HM HMS HJ HJS S E Es P B Amplification of a fragment of the Invertase gene.

38
Limit of Detection 300 pb 10 1 0.1 M MON810 B C-1 C-4 C-2 C-3 100 pb Detection of the specific event MON810 in different proportions (10%, 1% y 0.1%). C-1, negative control with BT11 maize seed DNA 100% transgenic; C-2, negative control with NK603 maize seed genomic DNA; C-3, negative control with chalqueño maize seed DNA; C-4, negative control without DNA. M, 50 bp ladder.
. C-1, negative control with BT11 maize seed DNA 100% transgenic; C-2, negative control with NK603 maize seed genomic DNA; C-3, negative control with chalqueño maize seed DNA; C-4, negative control without DNA. M, 50 bp ladder.")
39
Identity verification:
Restriction analysis Amplicons of CamV35S promoter and restriction products with Asp700. Lane 1: 50bp ladder, lanes 2 and 3: Bt176 control, lanes 4 and 5: canned corn grains, in 2% agarose gel.

40
Quantitative PCR qPCR – RTQ-PCR

42
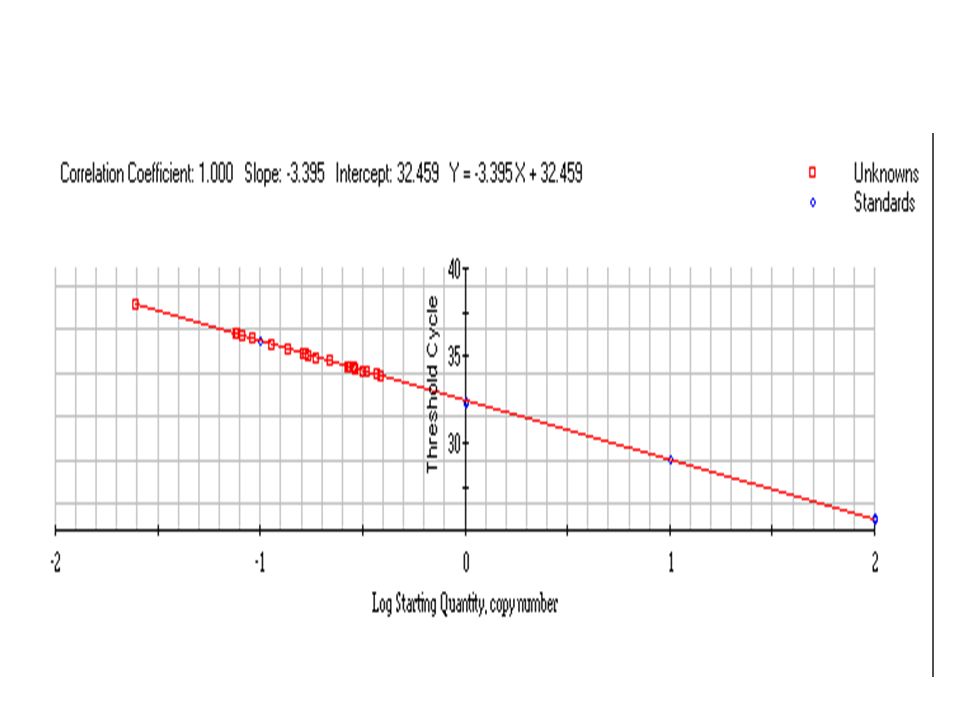
10 2 1 0.1 100 0.01 Cycle number PCR products Ct Ct = number of cycles needed for the amplification signal to be statistically different from the background signal m=-3.32 Log conc.

43
10 2 3.32 Number of DNA molecules Number of PCR cycles 2 2 1 1 4 2 2 2
5 6 7 Number of DNA molecules 2 2 1 4 2 2 8 2 3 Continuing on, ten cycles generate more than 1000 copies of the original target sequence, 20 generate 1,000,000, thirty generate 1,000,000,000, and 40 generate 1,000,000,000,000. We normally run between 30 and 40 cycles. Obviously this is a very powerful amplification process, which is the basis for a highly sensitive detection method.

44
Lineal dynamic range

46
Results are accepted when the efficiency
(-1/m) * Results are accepted when the efficiency is higher than 95% (m = 3.45 a 3.3)
 * Results are accepted when the efficiency. is higher than 95% (m = 3.45 a 3.3)")
47
More common system probes

49
Some results in PCR real time
Specificity of primers and probes designed for RTQ-PCR Maíze % GMO Primers and Probes Bt11 Primers and Probe MON810 Promoter 35S CaMV Endogenous gene No. muestras/ reacciones positivas Promedio de Ct Promedio de Ct 10 3/3 0/3 - 8/8 10/10 37.9 * 6/6 5/5 NK603 * 4/4 Chalqueño 0/6 * NTC 0/4 0/10

50
Effect of the extraction system
Figure 26. Standard curves of the events MON810 y Bt11 from DNA extracted with the commercial systems A, B and C. 1, curve of the event Bt11 with extraction system A. 2, curve of the event MON810 with extraction system A. 3, curve of the event MON810 with extraction system B. 4, curve of the event Bt11 with extraction system B. 5, curve of the event Bt11 with extraction system C. 6, curve of the event MON810 with extraction system C.

51
A B C D E F G H Figure 27. Amplification curves generated with 100% transgenic DNA from event MON810, extracted with the system B. A, 20 ng. B, 10 ng. C, 5 ng. D, 2.5 ng. E, 1.25 ng. F, ng. G, ng. H, ng.

52
Figure 29. Amplification curves generated with 100% transgenic DNA of the event MON810, extracted with the system A. Serial dilutions were performed however, the amplification generated with each dilution does not allow to clearly establish to each curve the initial DNA concentration.

53
Effect of the extraction method over the quantification
Mixture of MON810 (%) 10 1 0.1 Extraction method B C A Without amplification
 Extraction method. B C A Without amplification.")
54
Effect of the primers and probes design
Linearization Data Curve with event Slope Intercept R2 Efficiency (%) Transgene Kit comercial OGMs Bt11 -3.537 28.253 0.999 91.7 MON810 -3.375 29.712 97.8 NK603 -3.836 30.512 82.3 Diseño -3.382 27.673 0.998 97.5 -3.326 28.411 99.8 -3.429 29.592 0.992 95.7 Endogenous Gene -3.685 29.003 0.993 86.8 -3.516 29.466 0.996 92.5 -3.731 30.187 0.985 85.4 -3.111 28.593 0.997 109.6 28.228 0.995 -3.193 29.103 105.7
 Transgene. Kit comercial OGMs. Bt MON NK Diseño Endogenous. Gene")
55
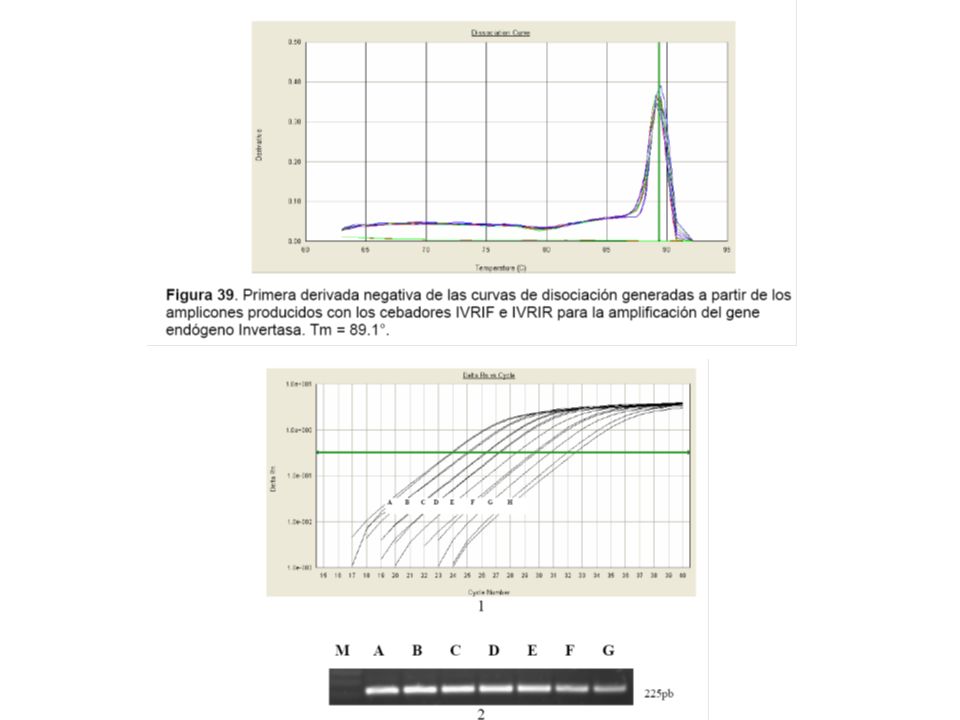
Sybr green A B First negative derivate of the dissociation curves of
Amplicons obtained for MON810 and B. endogenous gene

57
Non-specific amplification

58
Effect of the DNA quality over Sybr green quantification
Mixture of MON810 (%) 10 1 0.1 Extraction method B 10.3±0.007 1.1±0.021 0.25±0.006 C 10.8±0.018 2.3±0.017 0.10±0.077 A 48.5±0.157 53.8±0.149 0.03±0.011
 Extraction method. B. 10.3± ± ± C. 10.8± ± ± A. 48.5± ± ±")
59
Other example: Detection of transgenic maize in processed foods:
Nixtamal Flour Dough Tortilla Fried tortilla (tostada) Fried dough M. Quirasco, B. Schoel, J. Plasencia, J. Fagan & A. Gálvez Suitability of RTQ-PCR and ELISA for Cry9C detection in Mexican corn tortillas: fate of DNA and protein after alkaline cooking. Journal of AOAC International. 87:
 Fried dough. M. Quirasco, B. Schoel, J. Plasencia, J. Fagan & A. Gálvez Suitability of RTQ-PCR and ELISA for Cry9C detection in Mexican corn tortillas: fate of DNA and protein after alkaline cooking. Journal of AOAC International. 87:")
60
1 Ladder 2A Semillas 2B Harina de nixtamal comercial 3 Masa 4 Harina de nixtamal 5 Tortilla 6 Tortilla frita 7 Masa frita 8 Masa seca frita Carga: 100ng Tinción: SYBR Green

61
ND StarLinkTM 0.1% (w/w) Sample Media, % (w/w) RSD CV, %
Content of GMO, determined by RTQ-PCR, in different nixtamalized products prepared with white maize non – transgenic and different percentages of StarLinkTM . Granos de maíz 0.19 0.018 9.3 Masa 0.10 0.005 4.8 Harina de nixtamal 0.001 0.7 Tortilla 0.31 0.004 1.4 Tortilla chip ND - Corn chip 0.002 1.5 StarLinkTM 0.1% (w/w) Sample Media, % (w/w) RSD CV, % Corn chip secos ND = No detectado
 Sample. Media, % (w/w) RSD. CV, % Corn chip secos. ND = No detectado.")
62
Granos de maíz 1.23 0.121 9.8 Masa 1.16 0.002 0.2 Harina de nixtamal 1.03 0.016 1.5 Tortilla 1.41 0.015 1.0 Tortilla chip 0.52 0.001 0.3 Corn chip 0.023 2.0 StarLinkTM 1% (w/w) Sample Media , % (w/w) RSD CV, % Corn chip secos 0.63 0.079 12.4
 Sample. Media , % (w/w) RSD. CV, % Corn chip secos")
63
Granos de maíz 14.12 0.166 1.2 Masa 12.64 0.090 0.7 Harina de nixtamal 9.35 0.017 0.2 Tortilla 9.47 0.254 2.7 Tortilla chip 6.64 0.175 2.6 Corn chip 14.29 0.119 0.8 StarLinkTM 10% (w/w) Sample Media, % (w/w) RSD CV, % Corn chip secos 8.28 0.053 0.6
 Sample. Media, % (w/w) RSD. CV, % Corn chip secos")
64
LOD = Limit of Detection
=.01% en RTq-PCR LOQ = Limit of Quantification = 0.1% en RTq-PCR

65
... However DNA can be detected in highly processed foods
Immunochemical methods are adequate to detect the protein in grains and materials without too much processing Protein DNA Seed Primary Processed Highly processed ingredient foods foods ... However DNA can be detected in highly processed foods

67
Sampling GenScan Pre-treatment UNAM Halving 1 Halving 2
Composite samples “ Detection and cuantification of exogenous DNA by RTQ-PCR Heterologous protein detection 1 2 3 ELISA p35S Detection of authorized and unauthorized transgenic events in Mexico by RTQ-PCR Event Specific Immunostrips Results

68
Customs where maize samples were obtained Cd. Juárez Piedras Negras
Nuevo Laredo Matamoros Altamira Customs where maize samples were obtained Veracruz 430 Veracruz Centro Coatzacoalcos

69
Subsampling by dividing into four parts (“halving”)
1) 2) 3) 4) Subsampling by dividing into four parts (“halving”)
 2) 3) 4) Subsampling by dividing into four parts ( halving )")
70
Food authorization status of GM varieties of maize
TRANSFORMATION EVENT Authorized in Mexico U.S.A. Europe MON (GA21) Yes MON (NK603) MON (MON810) DAS (TC1507) MON (MON863) DAS MON (MON88017) No ACS–ZM002-1 / ACS-ZM003-2 (T14, T25) SYN-BTØ11-1 (BT11 (X4334CBR, X4734CBR)) Yes * REN (LY038) SYN-IR604-5 (MIR604) * vents Approved in october of 2007
 Yes. MON (NK603) MON (MON810) DAS (TC1507) MON (MON863) DAS MON (MON88017) No. ACS–ZM002-1 / ACS-ZM003-2 (T14, T25) SYN-BTØ11-1 (BT11 (X4334CBR, X4734CBR)) Yes * REN (LY038) SYN-IR604-5 (MIR604) * vents Approved in october of")
71
Immunological methods commercially available for heterologous protein detection
ELISA CP4-EPSPS (RR) Cry3Bb1 Cry1Ab/1Ac Cry1F Immunostrips CP4-EPSPS (RR) Cry3Bb1 Cry1Ab/1Ac Cry1F Cry34Ab1 Cry9C PAT
 Cry3Bb1. Cry1Ab/1Ac. Cry1F. Immunostrips. CP4-EPSPS (RR) Cry3Bb1. Cry1Ab/1Ac. Cry1F. Cry34Ab1. Cry9C. PAT.")
72
Possible presence of transgenic events by immunoassay (ELISA + strips)
Protein Port 1 Port 2 Port 3 Poprt 4 Port 5 Port 6 Port 7 Port 8 Cry1Ab/Ac MON810 Bt11 MON80100* MON802* MON809* DBT418** DBT418 ** Cry3Bb1 MON88017 MON863 N/D Cry1F DAS01507 DAS06275 *** DAS06275*** Cry34Ab1 DAS59122 Cry9C ND CP4-EPSPS NK603 PAT† T14/T25 MS6 DAS-06275*** ND, non detected protein * Events not containing Cry1Ab/Ac + CP4EPSPS ** Event containing Cry1Ab/Ac + PAT *** Event containing Cry1F + PAT † StarLink contains Cry9C + PAT. Cry9C not detected, its presence is discarded in PAT positive samples Potential presence of MON80100 y MON809 because they were not commercialized. DNA verification required.

73
Specific presence of transgenic events in maize grains, by RTQ-PCR
MON810 T25 GA21 NK603 DAS MON863 MON88017 DAS 1 2 3 4 5 6 7 8

74
Third party analysis (Gene Scan)
Confirmed the results obtained in Lab. 312, Dept. of Food Science and Biotecnhnology, Faculty of Chemistry, UNAM Confirmed the absence of the eventMON88017

75
“Possible” events are discarded
Immunodetection is insufficient for specific-event detection. Do not encompass the totality of authorized events (GA21), as well as non-authorized ones (676/678/680, DLL25, LY038, MIR604, MS3 y MS6) By PCR was confirmed the presence of MON810, MON862, DAS01507, DAS59122 and NK603 It was also discarded the presence of MON88017, possible event according to the immunodetection. Technological development is needed for the detection of possible unauthorized events.
, as well as non-authorized ones (676/678/680, DLL25, LY038, MIR604, MS3 y MS6) By PCR was confirmed the presence of MON810, MON862, DAS01507, DAS59122 and NK603. It was also discarded the presence of MON88017, possible event according to the immunodetection. Technological development is needed for the detection of possible unauthorized events.")
76
* Bt11 y LY038 approved in july andy MIR604 in october of 2007
% Events Customs Quantification (RTQ-PCR) of transgenic events authorized in Mexico prior to may 2007* * Bt11 y LY038 approved in july andy MIR604 in october of 2007
 of transgenic events authorized in Mexico prior to may 2007* * Bt11 y LY038 approved in july andy MIR604 in october of")
77
Total content (%) of GM material in each one of the analyzed samples
Aduana Estado Región Total content (%) of GM material in each one of the analyzed samples
 of GM material in each one of the analyzed samples.")
78
“Stacked” varieties of Maize
Event 1 x Event 2 Event 3 ACS-ZMØØ3-2 MON-ØØ81Ø-6 DAS NK603 TC1507 DAS-Ø15Ø7-1 MON-ØØ6Ø3-6 BT11 MIR604 GA21 LY038 MON-ØØ863-5 MON-ØØØ21-9 MON89034 MON88017 MON8903 SYN-BTØ11-1 MON810

79
Evento “Stack” DAS59122-7 x NK603
Copia 1 ADN Copia 2 ADN Copia 3 ADN Copia 4 ADN Copia 5 ADN Evento “Stack” DAS x NK603 100% 100% 200% ?

80
Evento “Stack” DAS59122-7 x NK603
Copia 1 ADN Copia 2 ADN Copia 3 ADN Copia 4 ADN Copia 5 ADN Evento “Stack” DAS x NK603 80% 100% 180% ?

81
Evento “Stack” DAS59122-7 x NK603
Copia 1 ADN (No-GM) Copia 2 ADN Copia 3 ADN Copia 4 ADN Copia 5 ADN Evento “Stack” DAS x NK603 80% 80% 160% ?
 Copia 2 ADN. Copia 3 ADN. Copia 4 ADN. Copia 5 ADN. Evento Stack DAS x NK % 80% 160%")
82
Normalizing genes from developers´ certified methods*
MON810: hmg (high mobility group) MON863: adh (alcohol dehydrogenase) NK603: adh (alcohol dehydrogenase) * Only recomended gene
 MON863: adh (alcohol dehydrogenase) NK603: adh (alcohol dehydrogenase) * Only recomended gene.")
83
Use of normalizing gene in tests performed in the laboratory: RT-PCR
% OGM = (transgene/normalizing gene) x 100 MON810 with hmg 15.25 x 100 = 43.8 34.84 MON810 with adh 15.25 x 100 = 23.1 66.01 If the amount of endogenous gene increases (denominator), the amount of GMO will be underestimated.
 x 100. MON810 with hmg x 100 = MON810 with adh x 100 = If the amount of endogenous gene increases (denominator), the amount of GMO will be underestimated.")
84
Quantification of three events using two different normalizing
% Quantification of three events using two different normalizing

85
adh could be present in the genome of the maize in more than one copy.
Quantification with adh could underestimate the results

86
Quantification of GM material (total) according to specific events or promoter 35S
 according to specific events or promoter 35S")
87
Hipotesis about the diferent quantification of the endogenous gene
Poor characterization of the endogenous gene (number of copies in the genomic DNA not specified) Sequences of primers or probes provided by the developer are not specific enough Low astringency PCR programme ¿Which endogenous gene should choose? ¿Differences between cultivars?
 Sequences of primers or probes provided by the developer are not specific enough. Low astringency PCR programme. ¿Which endogenous gene should choose ¿Differences between cultivars")
88
Conclusions Exists a high income of GM material in the analyzed customs. The most abundant events were: MON810 > NK603 > DAS1507-1 The presence of “stacked” variety makes more complex the transgenic material quantification. Standardization is required (at international level) regarding which normalizing genes should be used. An inter- governmental information exchange system is required in order to harmonize maize commerce between the USA and Mexico The event MON88017 (authorized variety) was not detected
 regarding which normalizing genes should be used. An inter- governmental information exchange system is required in order to harmonize maize commerce between the USA and Mexico. The event MON88017 (authorized variety) was not detected.")
89
Abraham Acatzi1 Javier Magaña1 Carlos Moles2 Carolina Peña2
Marcela Castillo2 Maricarmen Quirasco1 Javier Plasencia3 Marcelo Signorini4 Amanda Gálvez1, 2 1 Programa Universitario de Alimentos. PUAL-UNAM 2 Dept. Alimentos y Biotecnología. Facultad de Química. Universidad Nacional Autónoma de México (UNAM) 3 Dept. Bioquímica. Facultad de Química. UNAM 4 Comisión Federal para la Protección contra Riesgos Sanitarios. Secretaría de SALUD
 3 Dept. Bioquímica. Facultad de Química. UNAM. 4 Comisión Federal para la Protección contra Riesgos Sanitarios. Secretaría de SALUD.")
Similar presentations


>")

 Motion Controller Design for A Class of Second-order Systems Center for Self-Organizing Intelligent.>")


