Download presentation
Presentation is loading. Please wait.

1
Redesign of Precalculus Mathematics THE UNIVERSITY OF ALABAMA College of Arts and Sciences Course Redesign Workshop October 21, 2006

2
Redesign of Precalculus Mathematics l Setting/Problem l Course History l Course Format l Outcomes l Implementation issues l Cost-Savings l Conclusions

3
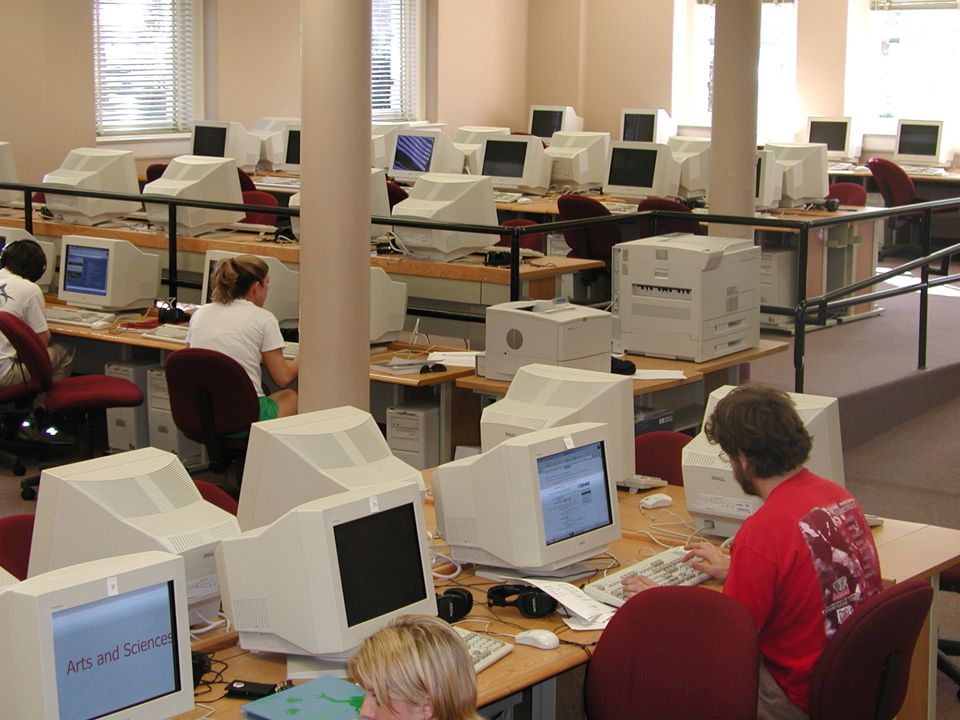
Setting 6 Precalculus math courses 6500 students per year Taught in traditional, lecture-based setting Taught entirely by instructors and GTAs

4
Course Format Courses taught in rigid format Common syllabus Common presentation schedule Common tests

5
Problems Courses teacher centered No support for multiple learning styles Inconsistent coverage of topics No flexibility in instructional pace Lack of student success D/F/W rates as high as 60% Very high course repeat percentage Negative impact on student retention Significant drain on resources

6
Issues Tenure-track faculty not invested in precalculus courses Courses damaging to department’s reputation Solutions proposed required significant resources Smaller class size Increased support (graders, tutors)
")
7
Solution Identify an alternative structure that: Had faculty and instructor support Was learner centered Supported multiple learning styles Provided consistent presentation of material Allowed students to work at own pace Increased student success Reduced resource demands

8
Approach Selected “Math Emporium” model developed by Virginia Tech Initial application to Intermediate Algebra (Math 100) Approximately 1300 students per year
 Approximately 1300 students per year")
9
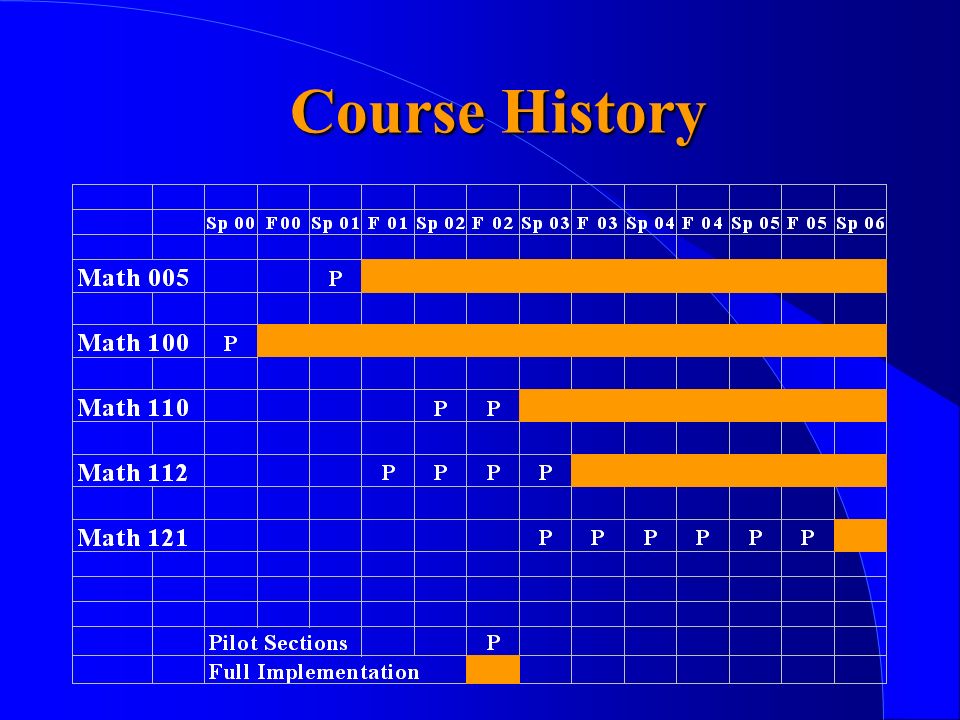
Course History

10
Fall 1999Fall 1999 Visited Virginia Tech Began initial planning for course course text/software - Intermediate Algebra by Martin- Gay/MyMathLab (Prentice-Hall)
")
11
Course History Spring 2000Spring 2000 Piloted redesigned format in 3 sections of Math 100 (100 students)
")
12
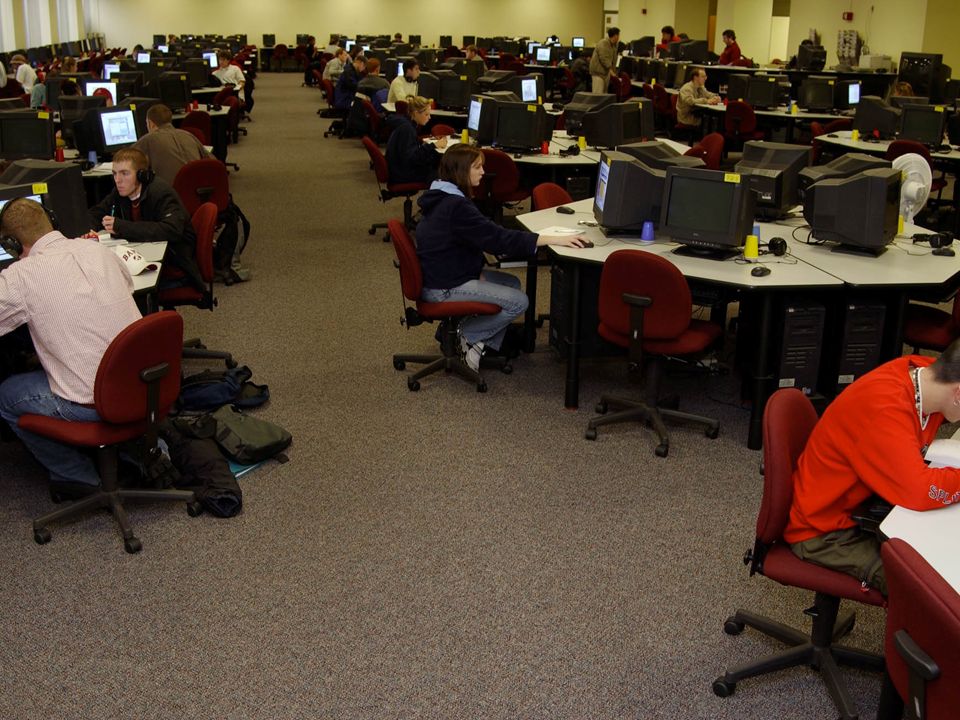
Course History Summer 2000Summer 2000 Received $200,000 Pew grant Assigned a 70-seat computer lab to course Mathematics Technology Learning Center (MTLC)Established the Mathematics Technology Learning Center (MTLC) Taught 5 sections of Math 100 (130 students) using redesigned format
Established the Mathematics Technology Learning Center (MTLC) Taught 5 sections of Math 100 (130 students) using redesigned format")
14
Course History Fall 2000Fall 2000 Taught 18 sections of Math 100 in MTLC (1140 students) 1140
 1140")
15
Course History

19
Course Format

20
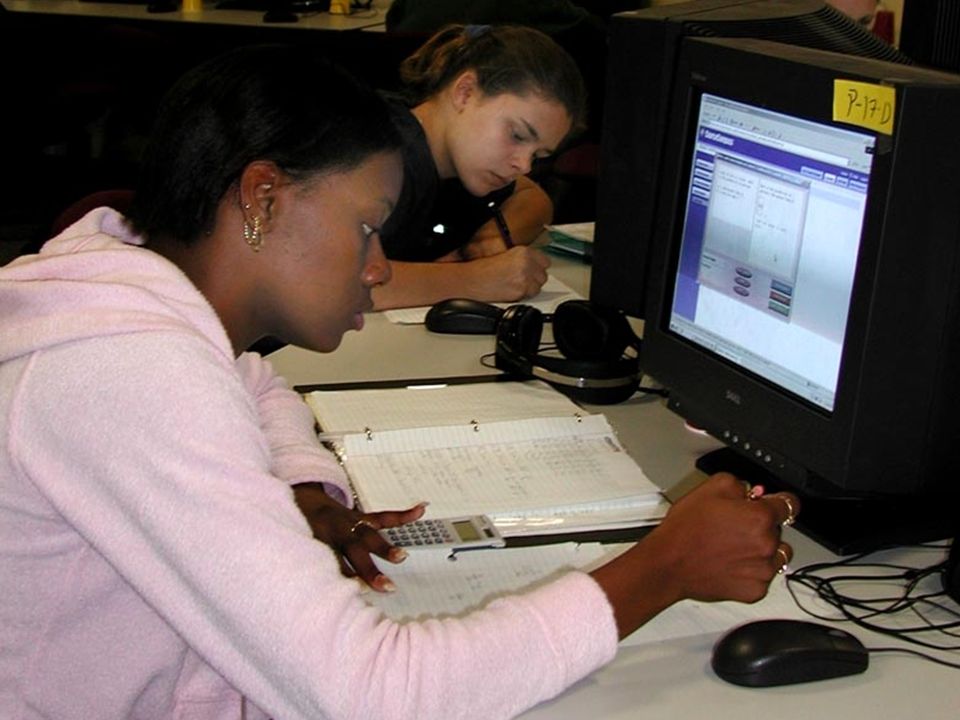
l 30-50 minute “classes” that introduce students to topics and integrate the topics into the overall course objectives l 3-4 hours in MTLC or elsewhere working independently using course software that presents a series of topics covering specific learning objectives l Instructors and tutors available in MTLC 71 hours/week to provide individualized assistance

22
Course Format (continued) l Students work homework problems that cover defined learning objectives l Homework is graded immediately by the computer providing the student with instant feedback on their performance l After completing homework, students take quizzes that cover learning objectives
 l Students work homework problems that cover defined learning objectives l Homework is graded immediately by the computer providing the student with instant feedback on their performance l After completing homework, students take quizzes that cover learning objectives")
23
Course Format (continued) l Students can do homework and take quizzes multiple times and receive instant feedback l After completing homework and quizzes on a series of topics, students take a section test l Tests are given only in the MTLC l Tests available on demand with a specified completion date
 l Students can do homework and take quizzes multiple times and receive instant feedback l After completing homework and quizzes on a series of topics, students take a section test l Tests are given only in the MTLC l Tests available on demand with a specified completion date")
24
Fundamental Premise Students learn mathematics by doing mathematics

26
Advantages of Course Format Learner centered Software supports multiple learning styles Consistent presentation of material Individualized tutorial support available

27
Advantages of Course Format Students can work at own pace Students can work in lab or at home Software provides instant feedback on work Homework, quizzes, tests, & exam computer graded Software records all student activity

28
Implementation Issues

29
Instructor Buy-In Instructor Training Detachment From Students Student Engagement “No Teacher” Syndrome Staff Scheduling Scheduling Deadlines, Tests, Etc. Data Management Implementation Issues

30
Outcomes

31
Success Rates Semester Success Rate Semester Success Rate Fall 1998 47.1% Spring 199944.2% Fall 1999 40.6% Spring 200053.5%

32
Success Rates Semester Success Rate Semester Success Rate Fall 1998 47.1% Spring 199944.2% Fall 1999 40.6% Spring 200053.5% Fall 2000 50.2% Spring 200135.8% Fall 2001 60.5% Spring 200249.8% Fall 2002 63.0% Spring 2003 41.8% Fall 2003 78.9% Spring 200455.4% Fall 2004 76.2% Spring 200560.1%

33
Success Rates Semester Success Rate Semester Success Rate Fall 1998 47.1% Spring 199944.2% Fall 1999 40.6% Spring 200053.5% Fall 2000 50.2% Spring 200135.8% Fall 2001 60.5% Spring 200249.8% Fall 2002 63.0% Spring 2003 41.8% Fall 2003 78.9% Spring 200455.4% Fall 2004 76.2% Spring 200560.1% Fall 2005 66.7% Spring 200656.5%

34
Outcomes – Grade Distribution* Semester A B C Fall 199913.1%32.6%54.2% Spring 2000 12.7% 34.0% 53.3% Fall 200018.0% 41.6% 40.4% Spring 200111.0% 24.8% 64.2% Fall 200117.4% 41.7% 40.9% Spring 200211.0% 36.7% 52.2% Fall 200221.5% 40.1% 38.4% Spring 200317.0%28.6%54.4% Fall 200342.3%38.1%19.6% Spring 200422.1%36.2%41.7% *Percentages of students successful

35
Math 121 Grade Distributions (Fall 2005 Semester) ABCDFW Math 121 T10.8%18.6%21.9%5.4%11.9%31.4% Math 121 C17.4%20.4%26.9%11.4%9.6%14.4%
 ABCDFW Math 121 T10.8%18.6%21.9%5.4%11.9%31.4% Math 121 C17.4%20.4%26.9%11.4%9.6%14.4%")
36
Pass Rate (Subsequent Courses) Cohort MTLC Overall F98-Sp99 57.4% 44.3% F99-Sp00 54.6% 40.0% F00-Sp01 58.0% 44.5% F01-Sp0274.6% 53.8% F02-Sp0381.4% 46.6% Math 112 - Precalculus
 Cohort MTLC Overall F98-Sp % 44.3% F99-Sp % 40.0% F00-Sp % 44.5% F01-Sp0274.6% 53.8% F02-Sp0381.4% 46.6% Math Precalculus")
37
Underserved Groups

38
Pass Rates by Math Placement Category Math Placement Score Year<200200-250>250 98/9931.5%45.5%66.6% 99/0040.3%43.8%63.2% 00/0132.8%42.0%60.6% 01/0248.9%53.8%71.2% 02/0348.4%54.9%62.0%

39
Pass Rates by Gender (Fall Semesters) F 98F 99F 00F 01F 02 Females54.7%48.9%53.0%66.7%68.2% Males39.1%31.8%45.9%55.8%57.6% Overall47.1%40.6%50.2%60.5%63.0%
 F 98F 99F 00F 01F 02 Females54.7%48.9%53.0%66.7%68.2% Males39.1%31.8%45.9%55.8%57.6% Overall47.1%40.6%50.2%60.5%63.0%")
40
Outcomes By Ethnicity Demographics Caucasian – 81% African-American – 15% Other – 4%

41
Math Placement Scores Fall 2001Placement Level Mean<200200-250>250 African- American20841%31%28% Caucasian23020%45%35%

42
Pass Rates by Ethnicity (Fall Semesters) F 98F 99F 00F 01F 02 African-American46.2%35.0%59.4%60.4%63.6% Caucasian46.9%41.1%46.5%60.7%62.3% Overall47.1%40.6%50.2%60.5%63.0%
 F 98F 99F 00F 01F 02 African-American46.2%35.0%59.4%60.4%63.6% Caucasian46.9%41.1%46.5%60.7%62.3% Overall47.1%40.6%50.2%60.5%63.0%")
43
Course Persistence

44
Course Persistence (Math 100) Test 1Test 2Test 3Test 4Final Fall 200192.4%89.3%83.8%81.6%78.6% Fall 200292.3%89.7%84.7%79.4%77.2% Fall 200392.1%91.2%88.6%86.3%85.8% Fall 200494.4%92.2%90.0%86.6%86.4% Fall 200593.6%89.7%82.7%79.7%80.1%
 Test 1Test 2Test 3Test 4Final Fall %89.3%83.8%81.6%78.6% Fall %89.7%84.7%79.4%77.2% Fall %91.2%88.6%86.3%85.8% Fall %92.2%90.0%86.6%86.4% Fall %89.7%82.7%79.7%80.1%")
45
Math 121 Course Persistence (Fall 2005 Semester) Test 1Test 2Test 3Test 4Final Math 121T88.4%83.0%67.0%64.9%67.3% Math 121C94.6%92.2%85.6%82.6%81.4%
 Test 1Test 2Test 3Test 4Final Math 121T88.4%83.0%67.0%64.9%67.3% Math 121C94.6%92.2%85.6%82.6%81.4%")
46
Cost Savings

47
2001-2002 Academic Year - 1480 Students 43 Sections of 35 Students Each 2 FTTI (16 sections) @ $36,250 $72,500 5 GTAs (20 sections) @ $17,565 $87,825 7 PTTI (7 sections) @ $1,655 $11,585 Total Cost $171,910 Cost Per Student $116 Traditional Course Cost

48
Redesigned Course Cost 2001-2002 Academic Year - 1480 Students 1 Section Each Semester 2 FTTI @ $36,250$72,500 6 PTTI @ $1,655 $9,930 UG Tutors 5760 hrs @ $7/hr $40,320 Total Cost $122,750 Cost Per Student $83

49
Cost Savings Traditional Course$116/student Redesigned Course$83/student Savings$33/student (28%)
")
50
Cost Savings (Economy of Scale) 955 Students in Math 005 & 112 1 FTTI @ $36,250$36,250 4 PTTI @ $1,655 $6,620 Total$42,870 $45/student
 955 Students in Math 005 & $36,250$36,250 4 $1,655 $6,620 Total$42,870 $45/student")
51
Cost Savings (Reduction of Course Repeats) 1480 Students in Math 100 20% increase in success rate = 296 students 296 students @ $116/student = $34,336
 1480 Students in Math % increase in success rate = 296 students 296 $116/student = $34,336")
52
Student Perceptions of Computer-Based Instruction

53
Perceived Advantages l Flexibility in scheduling l Ability to move at own pace l Instant feedback l Availability of individual help l Equality of presentation l Equality of testing l Elimination of language problems

54
Perceived Disadvantages l Technical problems frustrating l Confusion regarding course policies l Lack of a “teacher” l Inconsistent availability and quality of help l Necessity of self-discipline

55
Worked More or Less Than Traditional Course SemesterMoreSameLess Sp 0133.3%30.3%36.4% Fall 0146.1%29.3%24.6% Sp 0243.2%28.6%28.2% Fall 0242.6%37.0%20.4% Sp 0337.0%38.9%24.1%

56
For each section, what do you typically do first. Percent Learning Activities5.0% Practice Problems9.4% Graded Homework81.8% Quiz1.7% Talk With Tutor1.8%

57
Learning Compared to Traditional Class SemesterLessSameMore Fall 0018.3%68.5%13.2% Sp 0140.8%31.6%27.6% Fall 0128.8%34.8%36.4% Sp 0232.7%40.9%26.4% Fall 0224.6%39.0%36.4% Sp 0335.2% 29.6%

58
Correlation to Active Learning Question Strongly Agree Tend to Agree Tend to Disagree Strongly Disagree 1. This course helped me learn to work through a process to solve math problems 32.5%47.2%14.8% 5.5% 2. This course encourages me to take responsibility for my own learning 45.2%42.3% 8.9%3.6% 3. This course encourages me to search for answers myself rather than asking others 38.9%49.9% 7.4%3.8% 4. It is easy to pay attention in this class 34.0%46.4%14.5%5.1%

59
University of North Carolina Survey “This course is a good fit with my learning preferences.” Redesign Strongly Disagree45.3% Disagree21.8% Neutral17.3% Agree11.7% Strongly Agree3.9%

60
University of North Carolina Survey “This course is a good fit with my learning preferences.” RedesignTraditional Strongly Disagree45.3%26.6% Disagree21.8%54.0% Neutral17.3% Agree11.7%2.1% Strongly Agree3.9%0.0%

61
Conclusions Based on our experience, we are confident that computer-based instruction in precalculus mathematics courses can: Enhance student learning Increase success rates, particularly for underserved students Reduce resource demands

Similar presentations


 Course Sue Spaulding, UNC Charlotte Pearson Education March 9, 2012 Boston Office.>")


