Download presentation
Presentation is loading. Please wait.

1
The Cross-Border Cooperation between Portugal-Spain and Sweden–Norway INTERREG-A

2
0 300 km PSBRSNBR Area (km 2 )137.015192.656 Territory (%)2327 Counties > 50.000 inhab.1022 Dynamic Axes21 SNBR – Swedish Norwegian Border Region PSBR – Portuguese Spanish Border Region SNBR – Swedish Norwegian Border Region PSBR – Portuguese Spanish Border Region
 Territory (%)2327 Counties > inhab.1022 Dynamic Axes21 SNBR – Swedish Norwegian Border Region PSBR – Portuguese Spanish Border Region SNBR – Swedish Norwegian Border Region PSBR – Portuguese Spanish Border Region")
3
0 300 km Population Density - EU NUTS III - 2003 PSBRSNBR Population5.460.9903.558.648 Population (%)1126 Pop. Density (hab/km 2 )4032 Pop. Growth (91-05) (93-06)64.818150.761 Birth Rate (‰)8.4910.92 Mortality rate (‰)12.0310.49 Ageing Index (%)143.998.99 Data Source: ESPON Database 2 - 50 50 - 100 100 - 200 200 - 500 500 - 20365
4032 Pop. Growth (91-05) (93-06) Birth Rate (‰) Mortality rate (‰) Ageing Index (%) Data Source: ESPON Database")
4
0 300 km GNP per capita (€) - EU NUTS III – 2003 PSBRSNBR GNP pc (PPC) (€/hab)12.26131.893 GNP (%)7,55,3 Activity rate (%)51.4573.45 Unemployment rate (%) 1 8.55.7 GVA – Primary Sector (%)8.902.89 GVA – Secondary Sector (%)26.0036.64 GVA – Terciary Sector (%)65.1058.47 University degree (%)9.918.7 Data Source: ESPON Database < 10000 10000 - 20000 20000 - 30000 30000 - 40000 > 40.000
 - EU NUTS III – 2003 PSBRSNBR GNP pc (PPC) (€/hab) GNP (%)7,55,3 Activity rate (%) Unemployment rate (%) GVA – Primary Sector (%) GVA – Secondary Sector (%) GVA – Terciary Sector (%) University degree (%) Data Source: ESPON Database < >")
5
0 300 km Border Sub-Regions PSBRSNBR Investment (million €)> 2.500> 200 Projects2179532 SR1 (% Proj.) / (% Inv.)23 / 23 SR2 (% Proj.) / (% Inv.)16 / 15 SR3 (% Proj.) / (% Inv.)17 / 16 SR4 (% Proj.) / (% Inv.)25 / 26 SR5 (% Proj.) / (% Inv.)20 / 20 SR6 (% Proj.) / (% Inv.)36 / 32 SR7 (% Proj.) / (% Inv.)29 / 27 SR8 (% Proj.) / (% Inv.)35 / 41 1 2 3 4 5 6 7 8 INTERREG I – II – III-A
> 2.500> 200 Projects SR1 (% Proj.) / (% Inv.)23 / 23 SR2 (% Proj.) / (% Inv.)16 / 15 SR3 (% Proj.) / (% Inv.)17 / 16 SR4 (% Proj.) / (% Inv.)25 / 26 SR5 (% Proj.) / (% Inv.)20 / 20 SR6 (% Proj.) / (% Inv.)36 / 32 SR7 (% Proj.) / (% Inv.)29 / 27 SR8 (% Proj.) / (% Inv.)35 / INTERREG I – II – III-A")
6
INTERREG I-II-III-A Counties Public Institutes Reg. Associations Universities INTERREG II-III-A

7
Participation of Counties in INTERREG-A Projects

8
Participation of Universities in INTERREG-A Projects

9
Project Leaders in INTERREG III-A Projects 1st Phase

10
Source: ESPON

11
INTERREG-A projects with more than one stage - PSBR and SNBR PSBRSNBR 78 - 3,5%62 – 11,7%

12
PSBR INTERREG-AProjectERDF (€) INT I – PIP1- Algarve - Road84.828.892 INT I – PAccesses to Guadiana Bridge24.939.894 INT I – SMotorway Badajoz-Portuguese Border70.556.740 INT I – SMotorway Porriño-Tuy N-55047.422.220 INT II – PRoads - EN 202 and EN 301 Monção-S. Gregório28.535.619 INT II – PSabugal Dam24.927.424 INT II – SRoads and bridges60.000.000 INT II – SRoads22.550.736 INT III – PSAdvanced networks – Information and telecom.47.418.848 INT III – PSIC 27 Road Odeleite-Alcoutim38.810.376 INT III – PSCommercial infra-structures and border permeability29.199.616 INT III – PSPipe infra-structures26.568.052 INT III – PSCEI Guarda-Salamanca library23.616.573 INT III – PSCross border road network - south of peninsula23.234.817 INT III – PSRehabilitation of roads22.230.768 INT III – PSRevitalization of the economic tissue21.358.291 INT III – PSRoad cross-border permeability20.884.313 INT III – PSBasic network of road infra-structures20.435.038 INTERREG-A ProjectERDF (€) INT II – SNRock Carvings5.427.754 INT II – SNGIT Bohuslän/Dalsland-Østfold3.620.619 INT II – SNScanland2.535.464 INT II – SNGIT Bohuslän/Dalsland-Østfold2.128.866 INT III – SNNABO– Train Trondheim-Östersund7.219.824 INT III – SNNABO– Train Trondheim-Östersund5.488.982 INT III – SNNew job markets4.595.208 INT III – SNKNIS – Knowledge and development in IS2.260.167 INT III – SNSkandia Take-Off – Trøndelag -Jämtland Univ.2.161.298 SNBR
 INT II – SNRock Carvings INT II – SNGIT Bohuslän/Dalsland-Østfold INT II – SNScanland INT II – SNGIT Bohuslän/Dalsland-Østfold INT III – SNNABO– Train Trondheim-Östersund INT III – SNNABO– Train Trondheim-Östersund INT III – SNNew job markets INT III – SNKNIS – Knowledge and development in IS INT III – SNSkandia Take-Off – Trøndelag -Jämtland Univ SNBR.")
13
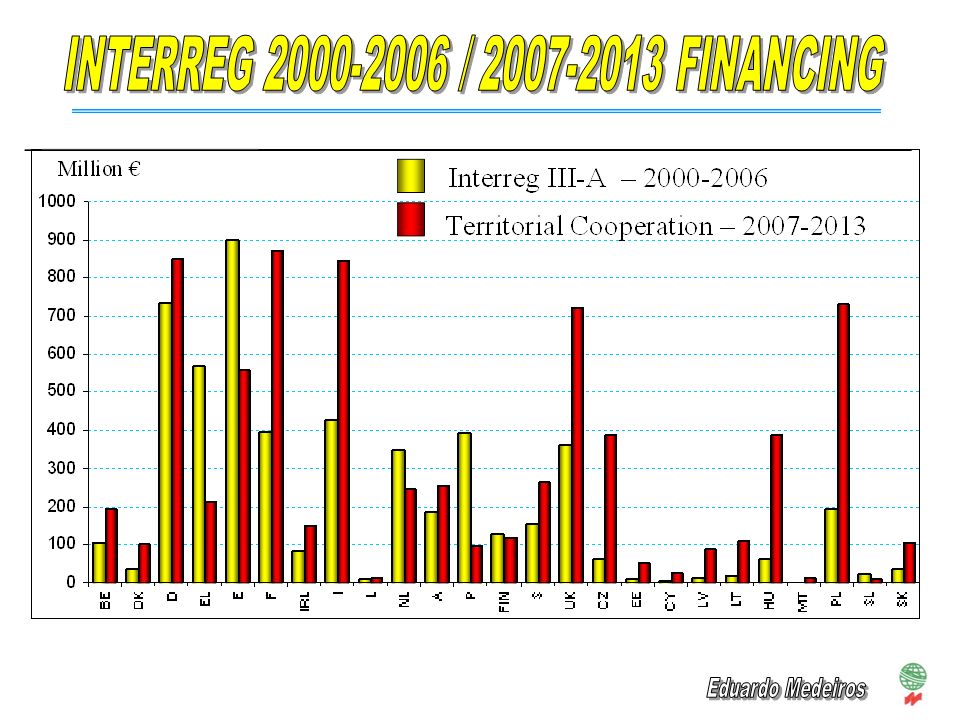
Data Source: INTERACT (million €)
")
15
0,05 - 0,13 0,13 - 0,15 0,15 - 0,17 0,17 - 0,24 Socio-economic development index 1991-20051993-2006 Iberia Peninsula: 0,165 PSBR: 0,157 Scandinavia Peninsula: 0,185 SNBR: 0,132

16
Territorial Articulation

17
INVESTMENT (%) PSBR SNBR Accessibilities Culture/Social Environment/Heritage Institutional/Urban Economy/Technologic Studies
 PSBR SNBR Accessibilities Culture/Social Environment/Heritage Institutional/Urban Economy/Technologic Studies")
20
0 100 km Country Sub- NUTS II Sub-regions EGTC Norte-Galiza EGTC Duero-Douro EGTC ZASNET Source:: Author EGTCGuadiana Central

23
Data Source: ESPON Database

24
Data Source: http://re.jrc.ec.europa.eu/pvgis/cmaps/eur.htm + http://www.windpower.org/en/tour/wres/euromap.htmhttp://re.jrc.ec.europa.eu/pvgis/cmaps/eur.htm http://www.windpower.org/en/tour/wres/euromap.htm

25
Data Source: ESPON Database

Similar presentations


 Opole Voivodeship (PL) Silesian Voivodeship (PL) Silesian Voivodeship (PL)>")


 Dr. Silvia Stiller Brussels 25th June 2013.>")


 Supporting Secondary Urban Centres in the Lake Victoria Region to Achieve the Millennium.>")
 Regional Conference EU Perspectives.>")
