Download presentation
Presentation is loading. Please wait.

1
Northern California Oracle Applications User Group February 11, 2004

2
Mary Burns Sales Consultant Oracle Corporation

3
Business Challenges The market punishes organizations that miss forecasts The struggling economy is applying intense pressure to the bottom line C-Level executives required to certify the accuracy of corporate information Economic conditions are forcing organizations to find where every penny of their business is going Need to react much faster to changing business conditions Align performance with corporate objectives

4
Solution Requirements Timely reporting and optimized performance linked to strategy Single source of truth Consistent Cross-Functional View of Information Low implementation and setup cost Internet Architecture – scales to thousands of users across the extended enterprise Flexibility

5
Corporate Performance Measurement CPM Operational Analytics and Reporting Planning, Budgeting, Forecasting and Modeling Strategic Goal setting and Alignment

6
CPM - Closed Loop Strategy Formulation: Enterprise Goals and Strategies Strategic Operational Execution: Operation Targets and Budgets Transactional Transaction Systems: Process Transactions Performance Metrics Correction Improvement Communication Feedback Source: Gartner research User Type

7
CPM - Closed Loop Oracle Scorecard Strategic Operational Oracle Enterprise Planning&Budgeting Transactional Oracle Daily Business Intelligence Performance Metrics Correction Improvement Communication Feedback User Type

8
What is Daily Business Intelligence Out-of-the-Box, Integrated Management Reporting for EBS – Oracle Portal based pages – Key performance indicator portlets – Management summary portlets – Ability to drill-down to reports NOT a new product … But a New Architecture

9
Out-of-the-Box Roles Chief Executive Officer VP of Operations VP of Procurement VP of Service Contracts Project Executive Marketing Manager Sales Manager Email Center Manager Profit Center Manager Cost Center Manager

10
Out-of-the-Box Pages Profit and Loss Expense Management HR Management Operations Management Order Management Fulfillment Management Project Profitability Management Project Operations Management Quote Management Marketing Management Leads Management Sales Management Sales Comparative Performance Opportunity Management Procurement Management Procure-to-Pay Management Service Contracts Management

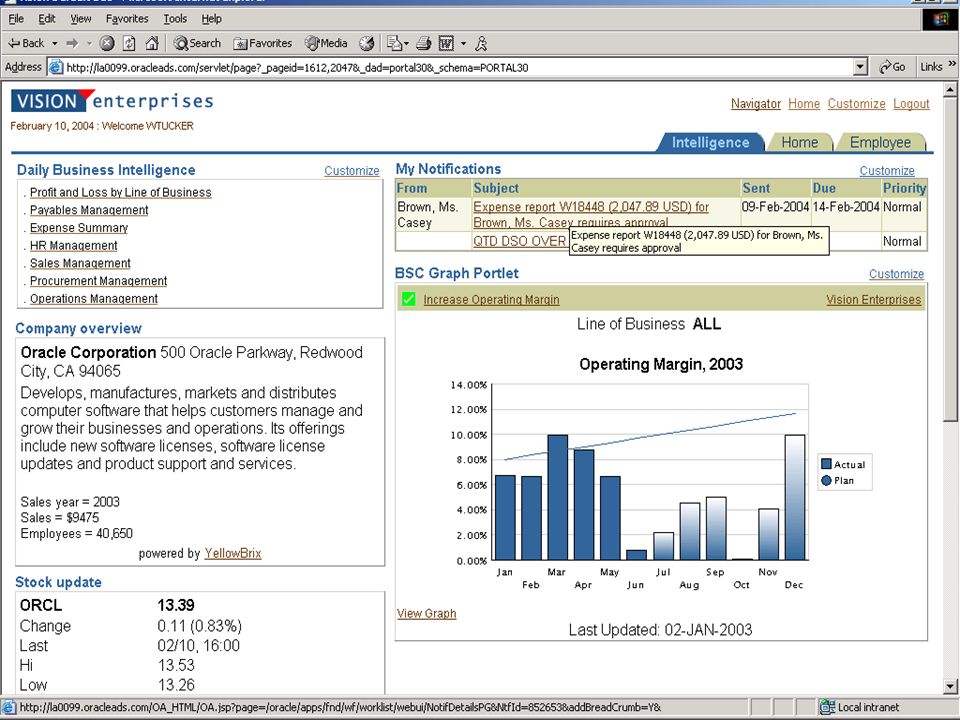
11
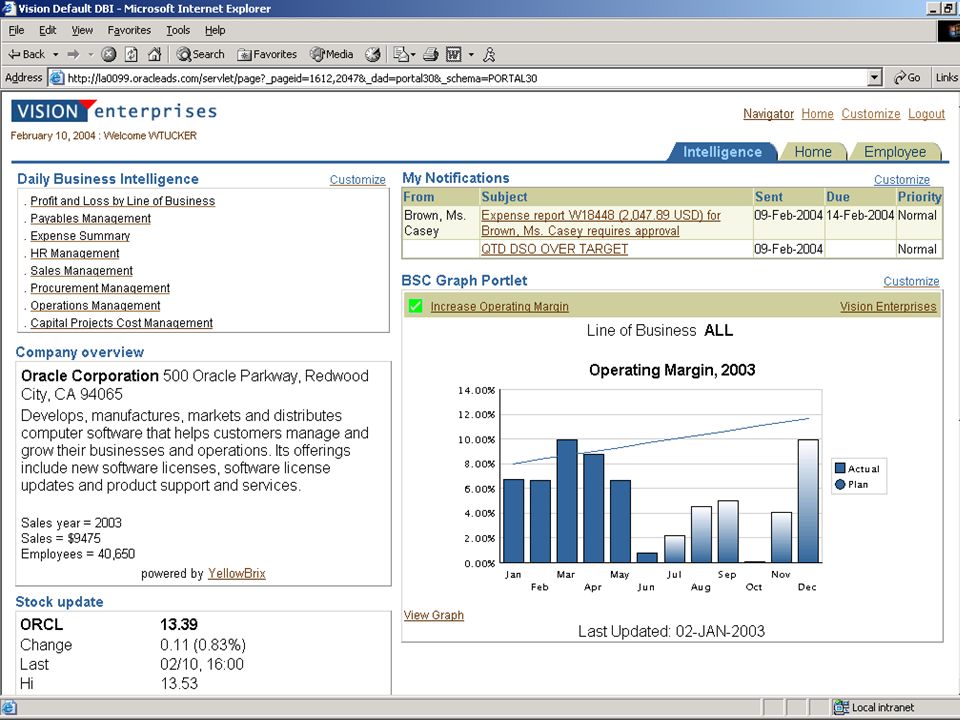
Daily Business Intelligence Portal Page Role Oriented Page Key Performance Indicators ContextualDrilldown Management Summaries

12
DBI Technology Stack RDBMS 9i R2 9iAS 1.0.2.2.2 Oracle Portal 3.0.9.8.4 BI Beans 2.7.0.3 Applications 11.5.8 OA Framework 5.6E PMF 4.0.0.4 PMV 4.0.0.4 BIA 4.0.0.4

13
Global Setups for DBI Allows consistent view of the organization to facilitate cross functional analysis Global Start Date Enterprise Calendar Period Type Start Day of Week Primary Currency Primary Rate Type Secondary Currency Secondary Rate Type Product Top Node Workforce Measurement Type

14
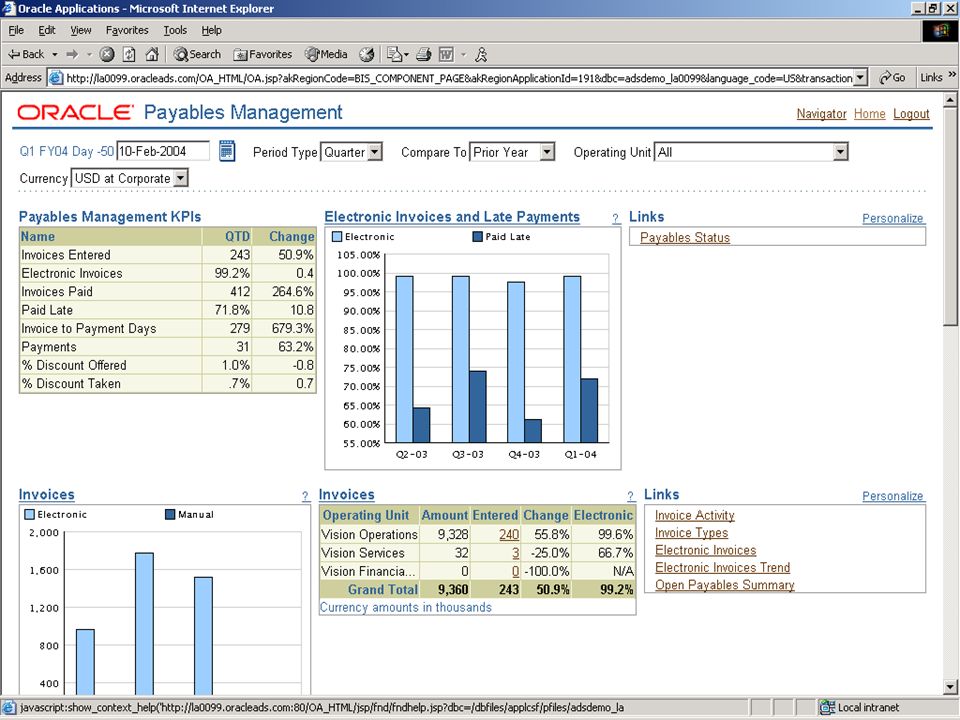
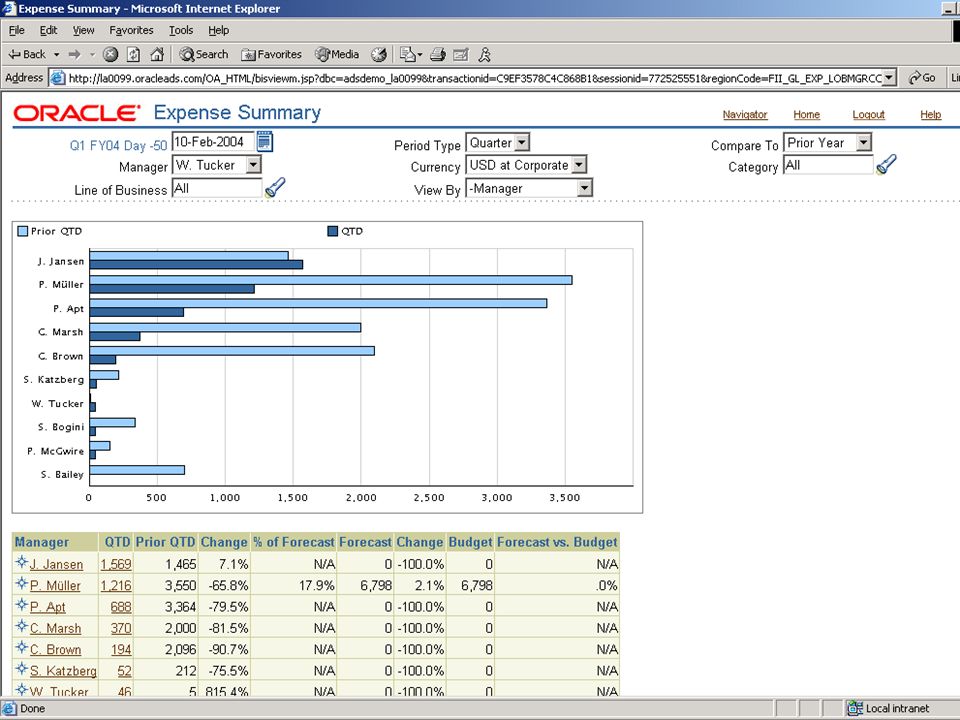
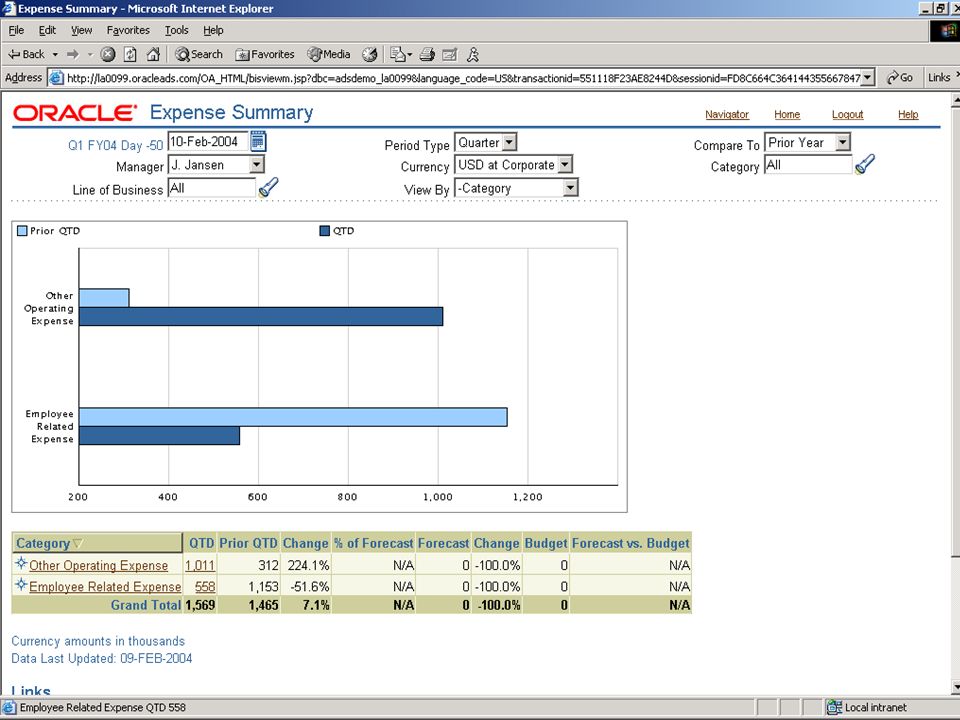
Elements of the DBI Page Page Level Parameter Portlet Key Performance Indicator Portlet DBI Regions per KPI – Management Summaries Table Portlet Graph Portlet – Drill down and Drill Across Capabilities Related Links Portlet Reports Pages Other Form functions

15
DBI Page Parameter Portlet

16
DBI Page-Level Parameters Portlet ConsistentOrganizationalView Currency Periods Fiscal Date and Days Until Qtr End Select Any Day Comparisons Management Perspective of Time

17
KPI Portlet

18
Drilldown to Detail Report KPI Values by Period Period to Period Change Comparative Performance

19
DBI Region per KPI

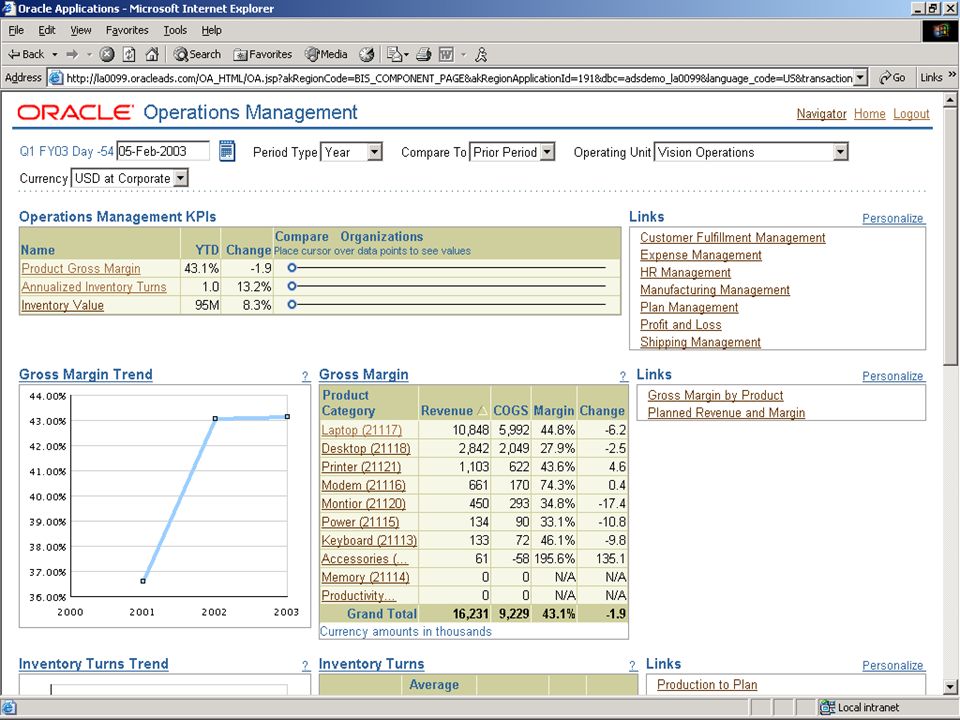
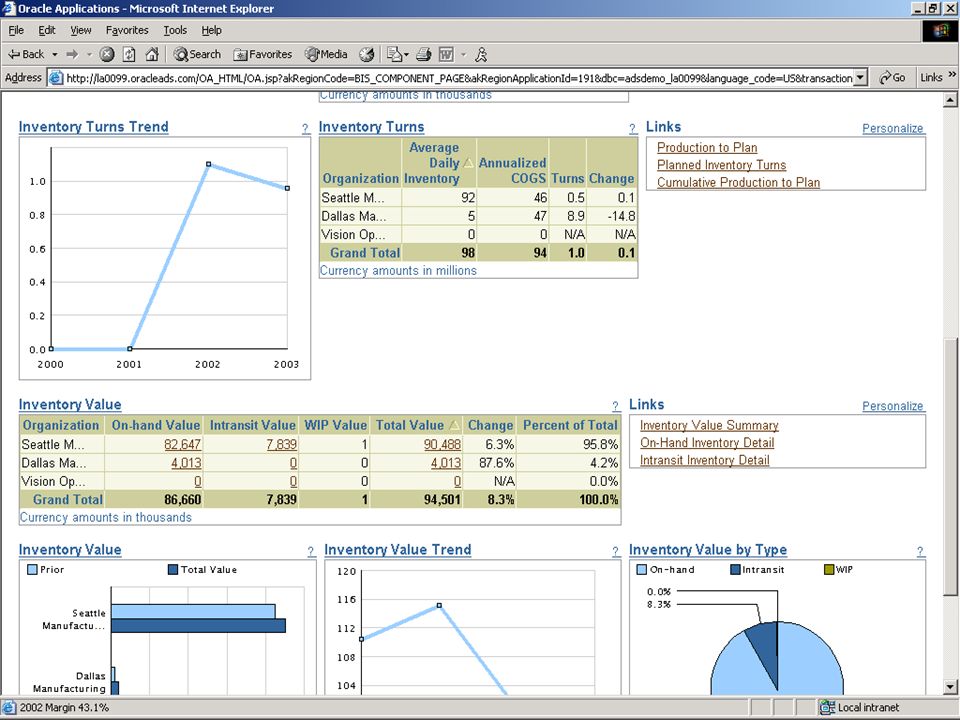
20
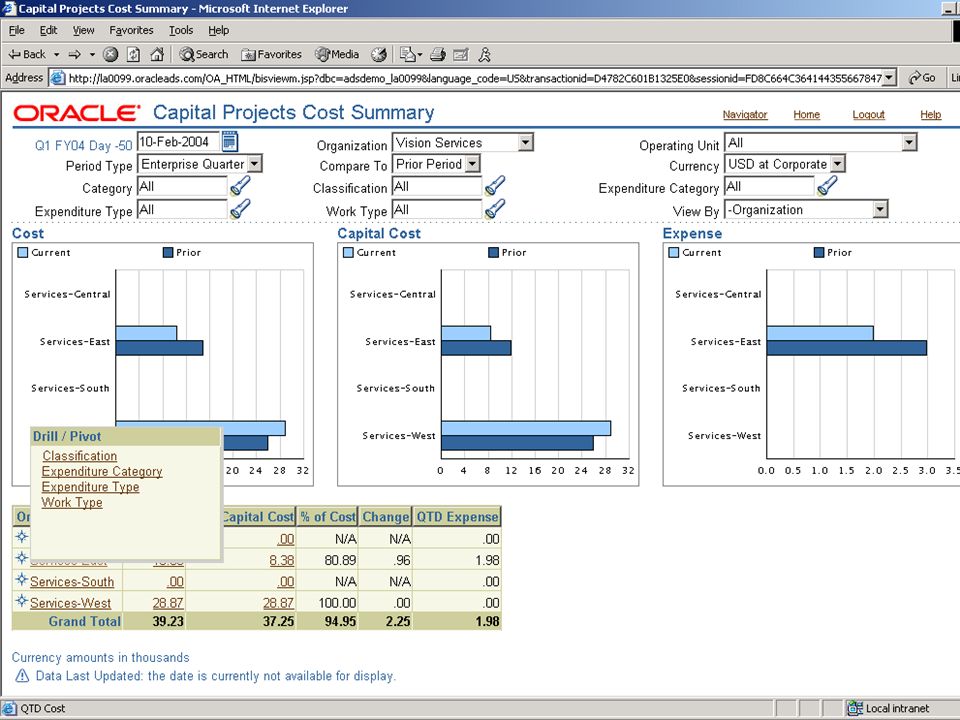
Management Summary Portlets: Graphs and Tables

21
Related Links Portlet

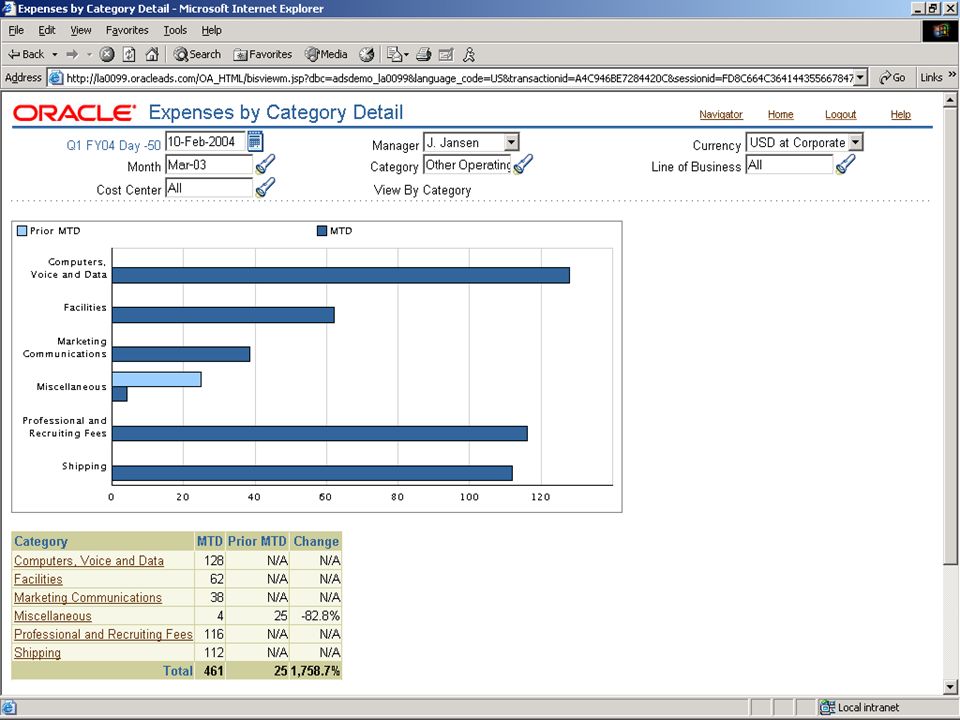
22
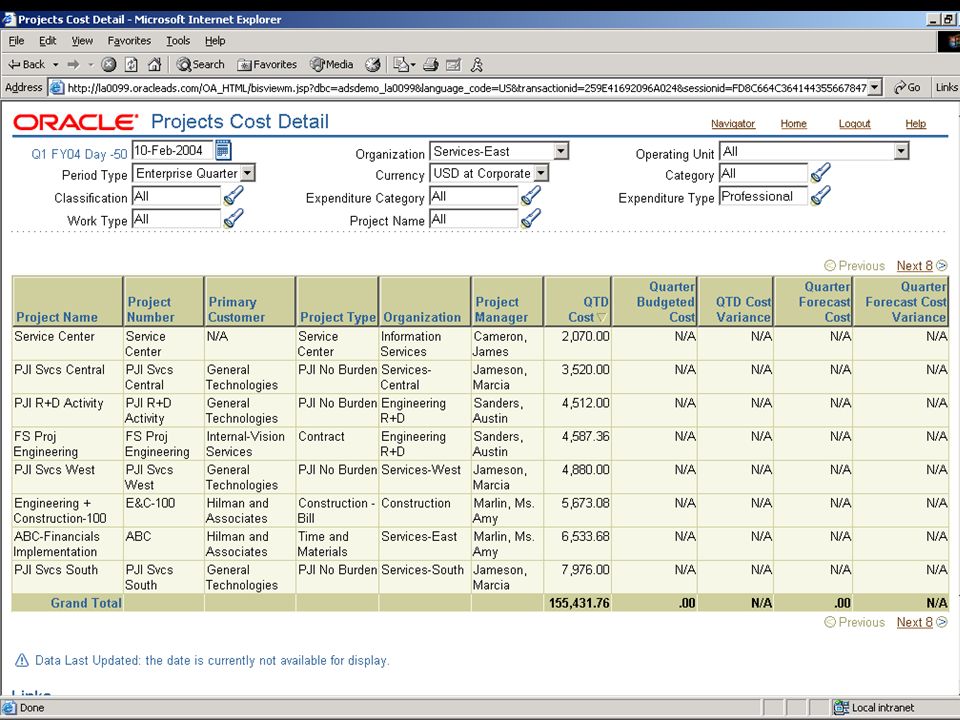
DBI Report

62
Copyright 2003, Oracle Corporation. All Rights Reserved.

Similar presentations


 in K-12>")
 solution Sefton Thesing Director Indigo NZ Limited.>")


