Download presentation
Presentation is loading. Please wait.

1
ArcGIS Marine Data Model
Project Introduction Conceptual Framework Dawn Wright, Oregon State University Joe Breman, ESRI Review Team Workshop ESRI Headquarters, Redlands, CA June 7-8, 2002 dusk.geo.orst.edu/djl/arcgis

2
Workshop Goals Overview of process
Refine the initial concepts and technical structure of the model Test model's initial application to real data Discussion of case studies, SIG meeting, further steps Agenda and handouts

3
Project Overview Steps in Process Conceptual Framework
50 pg. draft at dusk.geo.orst.edu/djl/arcgis Lead in to demos and discussion

4
Steps in Data Model Process
Data model template – few weeks to months Mature data model – up to few years more info at dusk.geo.orst.edu/djl/arcgis/about.html Draft Model Review, Projects Final Model

5
Project Milestones Initial Working Group - Oct. 4-5, 2001
Steve Grisé, Joe Breman, Simon Evans Dawn Wright, Jason Marshall, Pat Halpin, Eric Treml Analysis Diagram, UMLs, Data Structures Draft Conceptual FW Document – Nov. 2001 Review Team, Case Studies, and Interested Participants This workshop – Jun. 7-8, 2002 Marine SIG Meeting at ESRI UC,July 9, 2002

6
Purpose of Marine Data Model
basic template for implementing GIS projects input, formatting, geoprocessing, creating maps, performing analyses basic framework for writing program code and maintaining applications development of tools for the community promote networking and data sharing through established standards Learning,understanding ArcGIS!

7
Georelational to Geodatabase Model
coverage and shapefile data structures features are aggregated into homogenous collections of points, lines, and polygons with generic, 1- and 2-dimensional "behavior" can’t distinguish behaviors Point for a marker buoy, same as point for OBS “smart features” in a geodatabase

8
Geodatabase Concepts ESRI's new data object-oriented data model Object
objects, features, behaviors Object in ArcGIS an object is non-spatial it is NOT a point, line, or area it has no geographic location it has no shape attribute in its table ship, vehicle, … customer, lake, house Feature an object that has geographic location a point, line, area, TIN, raster

9
Geodatabase Concepts ( cont. )
collection of feature data sets, rasters, TINs all data in relational tables behavior is coupled with features through rules no more division between ARC and INFO

10
Transition to ArcGIS 8? how and when to do it?
How well are marine application domain requirements met in the geodatabase structure now? What can we do as a group to understand the technology and identify requirements? What are the potential benefits?

11
Marine Data Layers Bathymetry Shoreline Marine boundaries
Geophysical time series Sub-bottom profiling Sidescan sonar Magnetics Gravity Seismics Atmospheric influences Sea state Sea surface Temperature Salinity Sensor calibration data Current meters Density Sediment transport Wave activity

12
Monterey Bay Bathymetry Planimetric View

13
Faults Draped on Bathy

14
3- and 4-D Analysis Maximizing the use of available tools
“Placeholders” for 3-, 4-D data in the model

15
Coastlines and sea level change Raster layers with adjusted base heights

16
ESRI Marine Conservation Program
The ESRI Marine Conservation Program intends to evoke the interest of the marine GIS user community, and promote its development by providing a forum for the exchange of Marine Conservation GIS research and projects. GIS has many applications in marine conservation. This site provide a link to a collection of stories of some of the people and organizations who are making a difference in the marine GIS community. The mission of the ESRI Marine Conservation Program is to support the conservation of the seas and oceans worldwide by facilitating communication and encouraging cooperation throughout the marine GIS user community. The goals and objectives of the ESRI Marine Conservation Program are to: Provide training and professional development opportunities to increase the capacity of the marine community in the use of GIS. Promote low-cost or free access to marine-related data, and encourage the collaborative sharing of marine related information. Publish an annual forum to provoke the exchange of new ideas, methodologies, and tools relevant to the marine user community. Assist the marine GIS community in obtaining and utilizing GIS equipment, software, and services. Extend outreach to make marine-specific GIS techniques available to a wide network of marine users. And to enhance the development and growth of the marine GIS user group by providing a forum for meeting at the annual ESRI User Conference, and hosting the website:

17
“3D” Kriging?

18
Enhancement request for ARGCIS 8.2:
3-D Kriging development for volumetric analysis The 3-D Analyst has some volumetric analysis capability, and it would be very interesting and useful to see 3-D kriging developed and added to ARCGIS Extension functionality. In considering simulation (in geostatistics), enhancements, and lattice models. Interest has been expressed from the user community for the development of a volume model for the incorporation of oceanographic and atmospheric data into maps. Developing this data model would be useful for data such as currents, temperature, density, salinity, contaminants, wind, weather systems, atmospheric components, and much more. There have been many requests for an increase in this functionality. 3-D volumetrics actually performs analysis on the inputs, while 3-D kriging would create a volume in some sort in 3-D space. This enhancement request is to create a grid, or multiple grids, or a type of stacked grid model to handle multiple z value data. This will still only be a static representation that would need a 3-D viewer to support it. This 3-D viewer could support a geostatistical layer. Once the 3-D Kriging is developed then what is needed are tools to do some calculations, specifically how much volume is in the phenomenon.
, enhancements, and lattice models. Interest has been expressed from the user community for the development of a volume model for the incorporation of oceanographic and atmospheric data into maps. Developing this data model would be useful for data such as currents, temperature, density, salinity, contaminants, wind, weather systems, atmospheric components, and much more. There have been many requests for an increase in this functionality. 3-D volumetrics actually performs analysis on the inputs, while 3-D kriging would create a volume in some sort in 3-D space. This enhancement request is to create a grid, or multiple grids, or a type of stacked grid model to handle multiple z value data. This will still only be a static representation that would need a 3-D viewer to support it. This 3-D viewer could support a geostatistical layer. Once the 3-D Kriging is developed then what is needed are tools to do some calculations, specifically how much volume is in the phenomenon.")
20
Marine Data Collection
Image courtesy of PISCO, OSU

21
Steps in Data Modeling (1) Model the user's view of data
what are the basic features needed to solve the problem? (2) Select the geographic representation points, lines, areas, rasters, TINs (3) Define objects and relationships draw a UML diagram (4) Match to geodatabase elements specify relationships, “behaviors” (5) Organize geodatabase structure
 Select the geographic representation. points, lines, areas, rasters, TINs. (3) Define objects and relationships. draw a UML diagram. (4) Match to geodatabase elements. specify relationships, behaviors (5) Organize geodatabase structure.")
22
Users’s View of Data

23
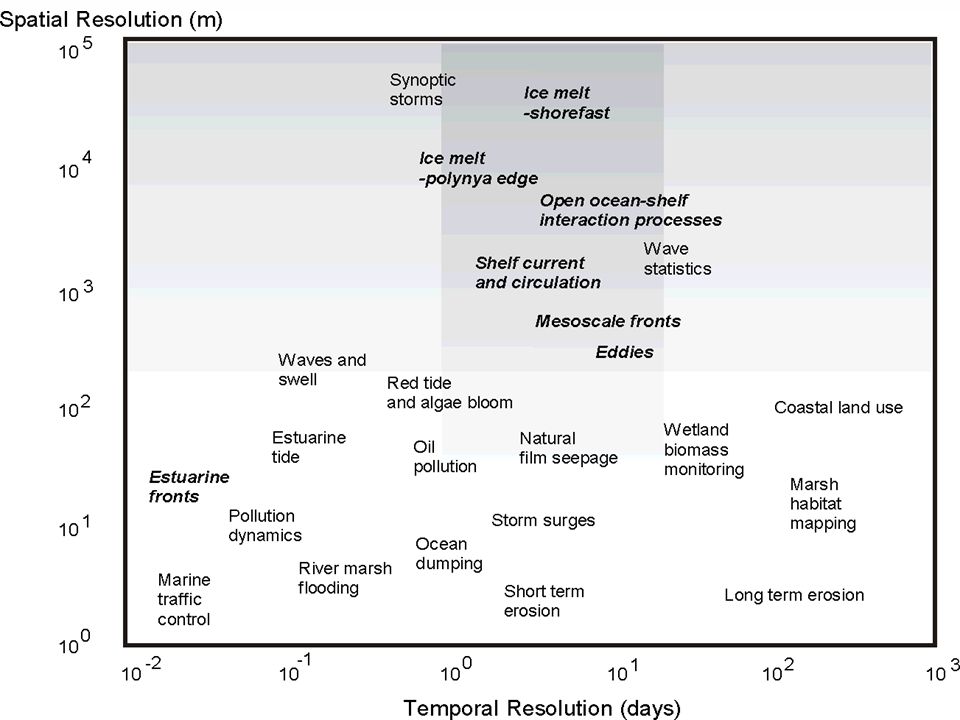
Representing dynamic marine data
Feature locations change Multiple time variable data A dynamic and multivariable coastline Time duration areas Instantaneous points with multiple z values Tracking marine animal movement Bathymetric layers

24
Select Geog. Rep. P. Halpin, Duke University

26
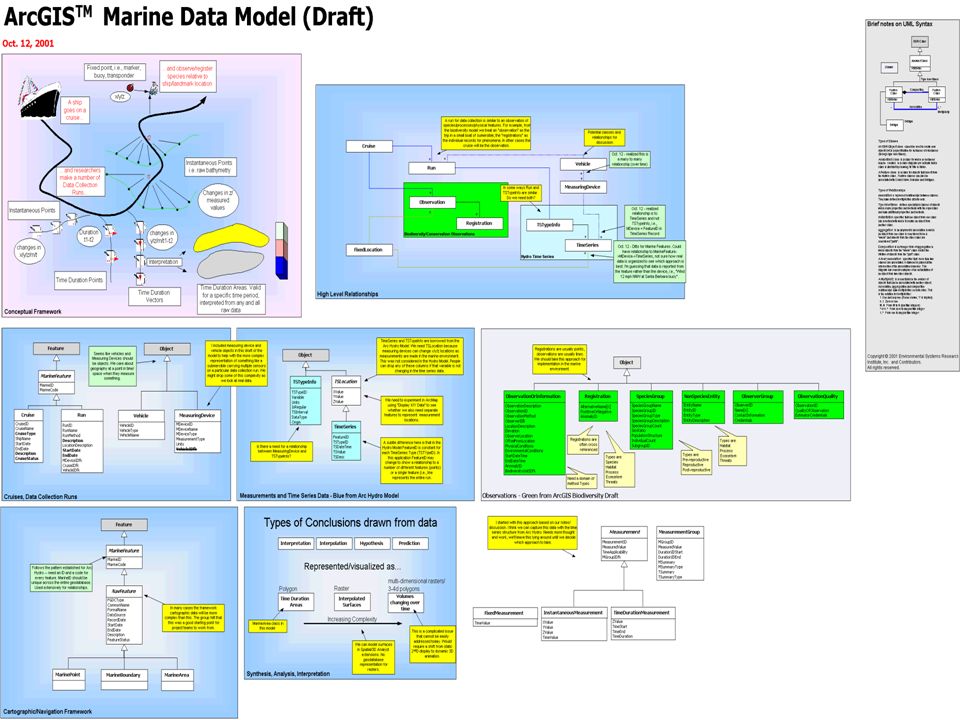
Understanding the Design
Won’t go through all boxes Use ArcMap and real data Data model a great poster? Data maintenance app. Programming framework

27
UML to ArcGIS 8

28
Some Issues How DOES the model handle time?
especially same feature in different locations over time? Hydro model time series may not be good equivalent after all Change in value (flow) for a fixed feature (channel, gauge) 3D Many use other software for true 3D analysis (Fledermaus, Rockware, etc.) import, conversion to Arc Geology, geophysics, phys. oceanography software Coastal vs. deepsea balance General Data Structures Your data may not immediately fall into present schema categories Shouldn’t be a problem with the structure. Others?
 for a fixed feature (channel, gauge) 3D. Many use other software for true 3D analysis (Fledermaus, Rockware, etc.) import, conversion to Arc. Geology, geophysics, phys. oceanography software. Coastal vs. deepsea balance. General Data Structures. Your data may not immediately fall into present schema categories. Shouldn’t be a problem with the structure. Others")
Similar presentations


 John Wiley and Sons Ltd 9. Geographic Data Modeling.>")
 Physical Model Modeling Process Conceptual Model Lists, flow diagrams, etc Logical.>")


 Longley et al., ch.>")


 GEOG 463 5/7/04.>")


 Zeiler, chs. 4, 5, and 12 Review Zeiler ch. 1.>")


