Download presentation
Presentation is loading. Please wait.

1
Copyright © 2009 Pearson Education, Inc. PowerPoint Lectures for Biology: Concepts & Connections, Sixth Edition Campbell, Reece, Taylor, Simon, and Dickey Chapter 36 Population Ecology Lecture by Brian R. Shmaefsky

2
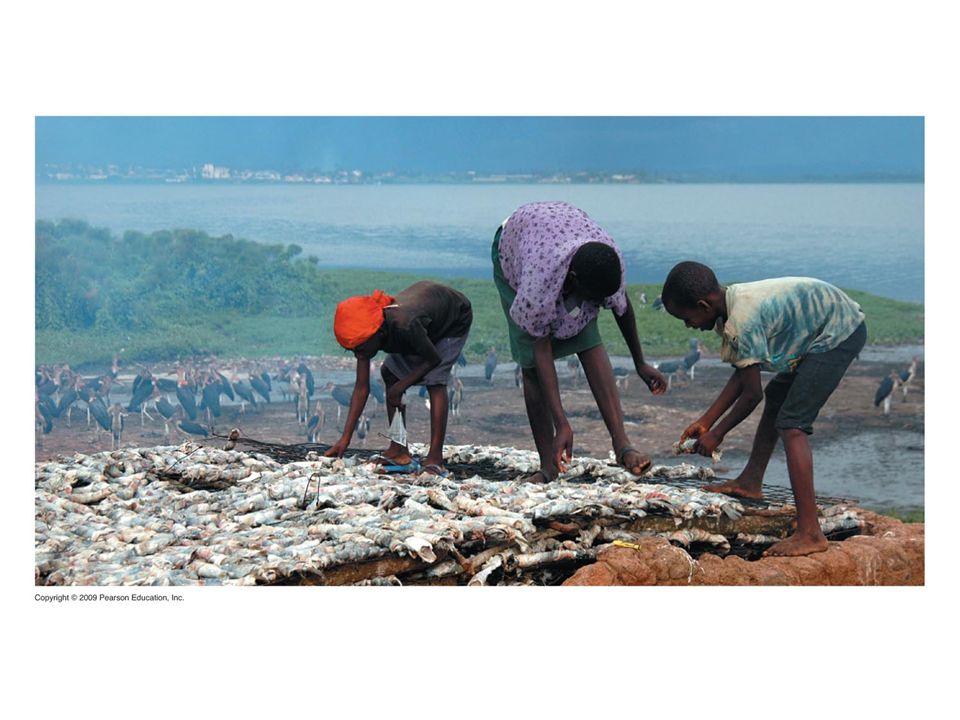
Copyright © 2009 Pearson Education, Inc. Introduction: A Tale of Two Fishes Population ecology is concerned with –Changes in population size –Factors that regulate populations over time It helps explain the biodiversity of an environment

3
Copyright © 2009 Pearson Education, Inc. Ecologists learn the structure and dynamics of natural populations With this information they are better equipped to –Develop sustainable food sources –Assess the impact of human activities –Balance human needs with the conservation of biodiversity and resources Introduction: A Tale of Two Fishes

7
Copyright © 2009 Pearson Education, Inc. POPULATION STRUCTURE AND DYNAMICS

8
Copyright © 2009 Pearson Education, Inc. 36.1 Population ecology is the study of how and why populations change Population –A group of individuals of a single species that occupy the same general area Individuals in a population –Rely on the same resources –Are influenced by the same environmental factors –Are likely to interact and breed with one another

9
Copyright © 2009 Pearson Education, Inc. A population can be described by the number and distribution of individuals Population dynamics is the interactions between –Biotic and abiotic factors It is the cause of variation in population sizes –A population increases through birth and immigration –Death and emigration out of an area decrease the population 36.1 Population ecology is the study of how and why populations change

10
Copyright © 2009 Pearson Education, Inc. 36.2 Density and dispersion patterns are important population variables Population density is the number of individuals of a species per unit area or volume Examples of population density –The number of oak trees per square kilometer in a forest –The number of earthworms per cubic meter in forest soil Ecologists use a variety of sampling techniques to estimate population densities

11
Copyright © 2009 Pearson Education, Inc. Within a population’s geographic range, local densities may vary greatly The dispersion pattern of a population refers to the way individuals are spaced within their area 36.2 Density and dispersion patterns are important population variables Video: Flapping Geese (clumped) Video: Albatross Courtship (uniform) Video: Prokaryotic Flagella (Salmonella typhimurium) (random)
 Video: Albatross Courtship (uniform) Video: Prokaryotic Flagella (Salmonella typhimurium) (random).")
13
Copyright © 2009 Pearson Education, Inc. The dispersion pattern of a population refers to the way individuals are spaced within their area Dispersion patterns can be –Clumped –Uniform –Random 36.2 Density and dispersion patterns are important population variables

14
Copyright © 2009 Pearson Education, Inc. In a clumped pattern individuals are grouped in patches 36.2 Density and dispersion patterns are important population variables

16
Copyright © 2009 Pearson Education, Inc. In a uniform pattern individuals are equally spaced in the environment 36.2 Density and dispersion patterns are important population variables

18
Copyright © 2009 Pearson Education, Inc. In a random pattern of dispersion, the individuals in a population are spaced in an unpredictable way 36.2 Density and dispersion patterns are important population variables

20
Copyright © 2009 Pearson Education, Inc. 36. 3 Life tables track survivorship in populations Life tables track survivorship over the life span of individuals in a population Survivorship curves plot the proportion of individuals alive at each age –Type I –Type II –Type III

22
Percentage of maximum life span Percentage of survivors (log scale) 0 50100 0.1 1 10 100 III II I
 III II I")
23
Copyright © 2009 Pearson Education, Inc. 36.4 Idealized models predict patterns of population growth Exponential growth model –The rate of population increases under ideal conditions –Calculated using the equation G = rN –G is the growth rate of the population –N is the population size –r is the per capita rate of increase

24
Time (months) Population size (N) 0 1 23 4 567 89 10 1112 0 50 100 150 200 250 300 350 400 450 500
 Population size (N)")
26
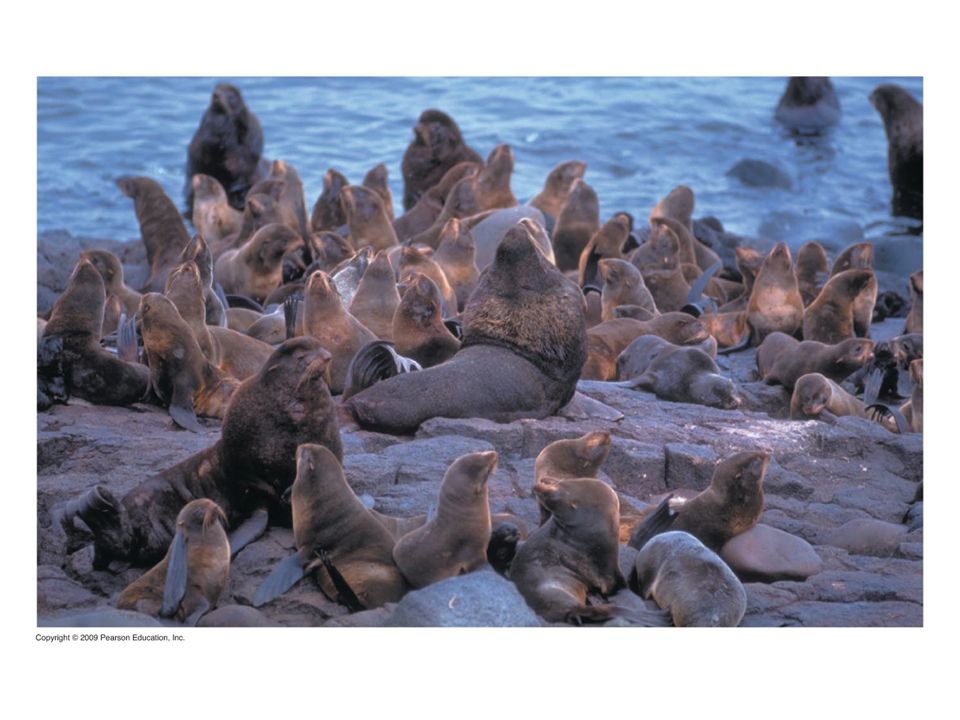
Copyright © 2009 Pearson Education, Inc. Logistic growth model –This growth model takes into account limiting factors –Limiting factors are environmental factors that restrict population growth –Formula 36.4 Idealized models predict patterns of population growth

27
Year Breeding male fur seals (thousands) 1915 1925 19351945 0 2 4 6 8 10
")
29
Year 1915 1925 1935 1945 Breeding male fur seals (thousands) 0 2 4 6 8 10
")
30
Copyright © 2009 Pearson Education, Inc. Idealized models describe two kinds of population growth –Exponential growth –Logistic growth 36.4 Idealized models predict patterns of population growth

31
Time Number of individuals (N) 0 K G = rN (K – N) K
 0 K G = rN (K – N) K")
33
Copyright © 2009 Pearson Education, Inc. 36.5 Multiple factors may limit population growth The logistic growth model –Population growth slows and ceases as population density increases –Increasing population density results in a decrease in birth rate, an increase in death rate, or both

34
Density of females Clutch size 0 10 20 30 40 50 60 7080 2.8 3.0 3.2 3.4 3.6 3.8 4.0

35
Copyright © 2009 Pearson Education, Inc. Abiotic factors may reduce population size before other limiting factors become important 36.5 Multiple factors may limit population growth

36
Apr MayJun Jul AugSepOct Nov Dec Number of aphids Exponential growth Sudden decline

37
Copyright © 2009 Pearson Education, Inc. Most populations fluctuate in numbers 36.5 Multiple factors may limit population growth

38
Time (years) Number of females 197519801985199019952000 0 20 40 60 80
 Number of females")
39
Copyright © 2009 Pearson Education, Inc. 36.6 Some populations have “boom-and-bust” cycles Some populations fluctuate in density with regularity Boom-and-bust cycles –Food shortages –Predator-prey interactions

40
Lynx Snowshoe hare Lynx population size (thousands) Hare population size (thousands) Year 1850187519001925 0 40 80 120 160 0 3 6 9
 Hare population size (thousands) Year")
41
Copyright © 2009 Pearson Education, Inc. 36.7 EVOLUTION CONNECTION: Evolution shapes life histories Life history –Series of events from birth to death r/K selection –r-selective traits –K-selective traits

42
MalesFemales Experimental transplant of guppies Predator: Killifish; preys mainly on small guppies Guppies: Larger at sexual maturity than those in pike-cichlid pools Pools with killifish, but no guppies prior to transplant Predator: Pike-cichlid preys mainly on large guppies Guppies: Smaller at sexual maturity than those in killifish pools 11 years later Mass of guppies at maturity (mg) 40 80 120 160 200 67.5 76.1 161.5 185.6 Age of guppies at maturity (days) MalesFemales 20 40 60 80 100 48.5 58.2 85.7 92.3 Control: Guppies from pools with pike-cichlids as predators Experimental: Guppies transplanted to pools with killifish as predators
 Age of guppies at maturity (days) MalesFemales Control: Guppies from pools with pike-cichlids as predators Experimental: Guppies transplanted to pools with killifish as predators")
43
Predator: Killifish; preys mainly on small guppies Experimental transplant of guppies Guppies: Larger at sexual maturity than those in pike-cichlid pools Pools with killifish, but no guppies prior to transplant Predator: Pike-cichlid preys mainly on large guppies Guppies: Smaller at sexual maturity than those in killifish pools

44
MalesFemales Mass of guppies at maturity (mg) MalesFemales 40 80 120 160 200 67.5 76.1 161.5 185.6 Age of guppies at maturity (days) 20 40 60 80 100 48.5 58.2 85.7 92.3 Control: Guppies from pools with pike-cichlids as predators Experimental: Guppies transplanted to pools with killifish as predators 11 years later
 MalesFemales Age of guppies at maturity (days) Control: Guppies from pools with pike-cichlids as predators Experimental: Guppies transplanted to pools with killifish as predators 11 years later")
45
Copyright © 2009 Pearson Education, Inc. 36.8 CONNECTION: Principles of population ecology have practical applications Sustainable resource management –Maximum sustained yield

46
1960 Yield (thousands of metric tons) 1970198019902000 0 100 200 300 400 500 600 700 800 900
")
47
Copyright © 2009 Pearson Education, Inc. THE HUMAN POPULATION

48
Copyright © 2009 Pearson Education, Inc. 36.9 The human population continues to increase, but the growth rate is slowing Human population is expected to continue increasing for several decades 95% of the increase is in developing nations

49
1500 Year Population increase Total population size Total population (in billions) 15501600 1650 1700175018001850190019502000 2050 0 2 4 6 8 10 20 40 60 80 100 Annual increase (in millions)
 Annual increase (in millions)")
51
Year Birth rate Death rate Rate of increase (r) 1900 1950 1925 19752000 20252050 0 10 20 30 40 50 Birth or death rate per 1,000 population
 Birth or death rate per 1,000 population")
52
Copyright © 2009 Pearson Education, Inc. Population momentum of Mexico 36.9 The human population continues to increase, but the growth rate is slowing

53
0 1234 554 321 0 1234 554 321 1980 Age Male Female 80+ 75-79 70-74 65-69 60-64 55-59 50-54 45-49 40-44 35-39 30-34 25-29 20-24 15-19 10-14 5-9 0-4 Population in millions Total population size = 68,347,479 Population in millions Total population size = 106,202,903 FemaleMale 2005 2030 Female Male Population in millions Total population size = 135,172,155 0 1234 554 321

54
Age 80+ 75-79 70-74 65-69 60-64 55-59 50-54 45-49 40-44 35-39 30-34 25-29 20-24 15-19 10-14 5-9 0-4 5 4 3 2 10 1 2 3 4 5 Population in millions Total population size = 68,347,479 1980 Male Female

55
5 4 3 2 10 1 2 3 4 5 Age 80+ 75-79 70-74 65-69 60-64 55-59 50-54 45-49 40-44 35-39 30-34 25-29 20-24 15-19 10-14 5-9 0-4 Population in millions Total population size = 106,202,903 Female Male 2005

56
5 4 3 2 10 1 2 3 4 5 Age 80+ 75-79 70-74 65-69 60-64 55-59 50-54 45-49 40-44 35-39 30-34 25-29 20-24 15-19 10-14 5-9 0-4 2030 Female Male Population in millions Total population size = 135,172,155

57
Copyright © 2009 Pearson Education, Inc. 36.10 CONNECTION: Age structures reveal social and economic trends Age structure diagram –Reveals a population’s growth trends

58
Age 1980 Birth years Male Female 2005 2030 Birth years Male Female Birth years Male Female 80+ before 1900 before 1926 before 1951 1951-551926-301901-1905 75-79 70-74 1906-10 1931-35 1956-60 1961-651936-40 1911-15 65-69 60-64 55-59 1916-201941-451966-70 1971-751946-50 1921-25 50-541926-301951-55 1976-80 1981-851956-60 1931-35 45-49 40-44 1936-40 1961-651986-90 1991-95 1966-70 1941-45 35-39 30-34 1946-501971-75 1996-2000 2001-05 1976-801951-55 25-29 20-24 1956-60 1981-852006-10 2011-15 1986-901961-65 15-19 10-14 1966-701991-952016-20 2021-25 1996-2000 1971-75 5-9 0-4 1976-80 2001-2005 2026-30 1210864202 4 6 8 12 Population in millions Total population size = 363,811,435 Population in millions Total population size = 295,734,134 12 10 86 4 2 0 24 6 8 12 10864202 4 6 8 12 Population in millions Total population size = 227,726,463

59
1980 Age Birth years Male Female 80+ 75-79 70-74 before 1900 1901-1905 1906-10 65-691911-15 60-64 1916-20 55-59 1921-25 50-54 1926-30 45-49 1931-35 40-44 1936-40 35-39 1941-45 30-34 25-29 20-24 1946-50 1951-55 1956-60 15-19 1961-65 10-14 5-9 0-4 1966-70 1971-75 1976-80 12 10 8 6 42 0 2 4 6 8 12 Population in millions Total population size = 227,726,463

60
Age 80+ 75-79 70-74 65-69 60-64 55-59 50-54 45-49 40-44 35-39 30-34 25-29 20-24 15-19 10-14 5-9 0-4 Birth years Male Female 12 10 8 6 42 0 2 4 6 8 12 Population in millions Total population size = 295,734,134 before 1926 1926-30 1931-35 1936-40 1941-45 1946-50 1951-55 1956-60 1961-65 1966-70 1971-75 1976-80 1981-85 1986-90 1991-95 1996-2000 2001-2005 2005

61
Age 80+ 75-79 70-74 65-69 60-64 55-59 50-54 45-49 40-44 35-39 30-34 25-29 20-24 15-19 10-14 5-9 0-4 Birth years Male Female 12 10 8 6 42 0 2 4 6 8 12 Population in millions Total population size = 363,811,435 2030 before 1951 1951-55 1956-60 1961-65 1966-70 1971-75 1976-80 1981-85 1986-90 1991-95 1996-2000 2001-05 2006-10 2011-15 2016-20 2021-25 2026-30

62
Copyright © 2009 Pearson Education, Inc. 36.11 CONNECTION: An ecological footprint is a measure of resource consumption U.S. Census Bureau projection –8 billion people within the next 20 years –9.5 billion by mid-21st century

63
Copyright © 2009 Pearson Education, Inc. Ecological footprint helps understand resource availability and usage The United States has a –Big ecological footprint –Large ecological deficit 36.11 CONNECTION: An ecological footprint is a measure of resource consumption

67
North America Europe Asia Africa > 5.4 global ha per person 3.6–5.4 global ha per person 1.8–3.6 global ha per person 0.9–1.8 global ha per person < 0.9 global ha per person Insufficient data South America Australia

68
Few large offspring, low mortality until old age Many small offspring, high mortality Percentage of maximum life span Percentage of survivors III II I

69
G = rN (K N)(K N) K
(K N) K")
70
Time Birth or death rate IIIIVI II

71
Copyright © 2009 Pearson Education, Inc. You should now be able to 1.Explain the factors that determine the characteristics of a population 2.Describe exponential growth and the factors that produce logistic growth of a population 3.Explain the limiting factors that influence population growth 4.Distinguish between r- and K-strategies 5.Describe and give examples of the different types of life histories

72
Copyright © 2009 Pearson Education, Inc. 6.Explain the factors the determine human population growth 7.Describe the concept of ecological footprint You should now be able to

Similar presentations


 Ecologists define a population as a single- species group of individuals that use common.>")


