Download presentation
Presentation is loading. Please wait.

1
Presentation Ling Zhang Date:2014-02-21

2
Framework of the method 1 Using Distribution Fitting for Assumptions 2 monte – carlo simulation 3 compare different cases 4 sensitivity analyze 5 find the best decision variable 6 Conclusion

3
Using Distribution Fitting for Assumptions Firstly I can get the historic data of assumption variables that I need. We can have fitted distribution if we have the historic data. The highest ranking fit is chosen to represent the data by using the software crystal ball which installed in excel.

4
Monte – Carlo simulation Monte – Carlo simulation and crystal ball For each uncertain variable in a simulation, you define the possible values with a probability distribution. A simulation calculates numerous scenarios of a model by repeatedly picking values from the probability distribution for the uncertain variables and using those values for the cell. Commonly,a Crystal ball simulation calculates hundreds or thousands of scenarios in just a few seconds.

5
compare different cases We use Monte- Carlo simulation to analyze every case we want,then we can get the final analyses.The final analyses include chart analyses, forecast,sensitivity analyses, statistic analyses and so on. For the statistic analyses you can see for example the mean the mode.

6
compare different cases After the running of the simulation we can see the analyses of the data we want for example we can see the statistic of the profit and interest rate. Then we can compare different cases. We are able to see which case is better than others.

7
sensitivity analyze By using sensitivity analyses we can find the rank of influence. Who have big influence to the data we want. For example who has big influence to profit. so we start further study about improving the target. Like how to improve profit.

8
find the best decision variable Before we compare the cases and find the best of the case. Now we can analyses the best case.First we use sensitivity analyses then we start to analyze the decision variable we can find the best solution of decision variable.

9
Conclusion The last step is get conclusion of the whole these.

10
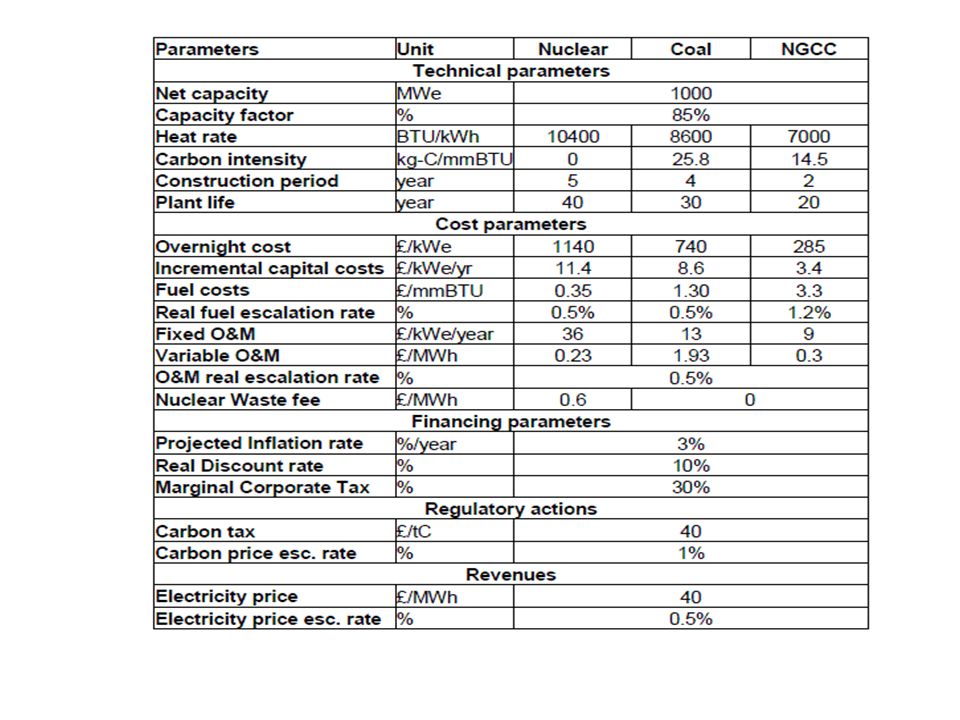
The topic Using Monte-Carlo simulation to estimate power genration investment under uncertainty There is a good example paper for me but my paper has some differences of that paper. The basic method I will use is the monte – carlo simulation and sensitivity analysis as I mentioned before.

11
Framework of the method 1 Using Distribution Fitting for Assumptions 2 monte – carlo simulation 3 compare different cases 4 sensitivity analyze 5 find the best decision variable 6 Conclusion

14
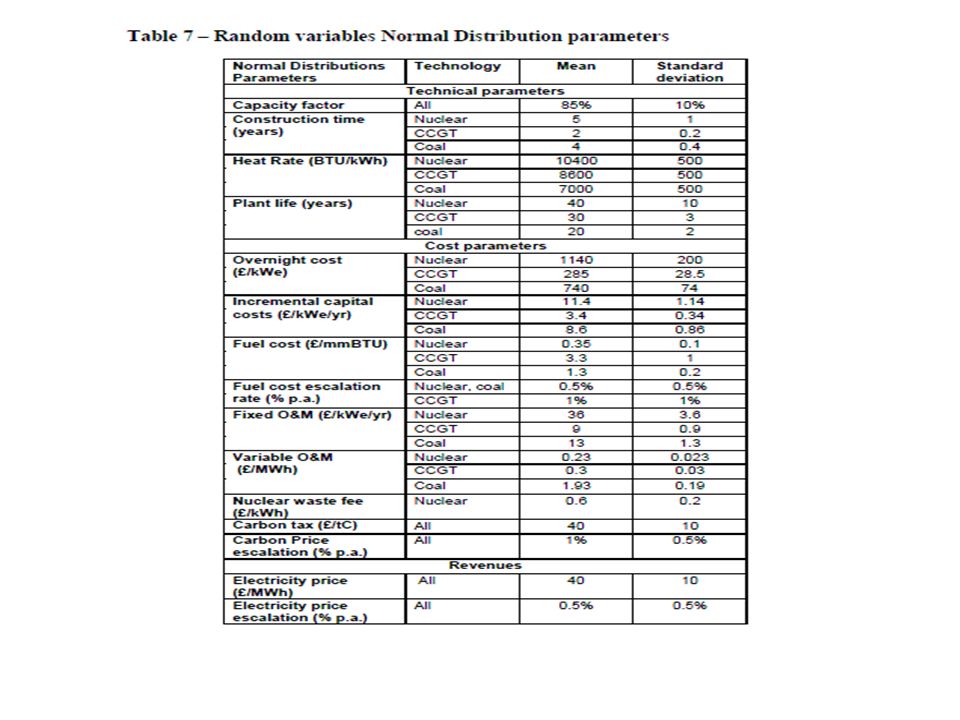
The former paper just assume all the data are normal distribution, I will find the historic data and then use fitted distribution. For example eletricity price

15
Define the forecast Funtion = (Revenue-cost)* tax rate
* tax rate")
16
Thank you

Similar presentations


, IF, Boolean Crystal Ball.>")


