Download presentation
Presentation is loading. Please wait.

1
Managing 2009 Crop Margins November 2008 Fundamentals: Supply & Demand Commodity Funds & Chart Technicals Outside Commodity Markets Steven D. Johnson Farm & Ag Business Management Specialist (515) 957-5790 sdjohns@iastate.edu www.extension.iastate.edu/polk/ farmmanagement.htm
 farmmanagement.htm.")
2
Presentation Objectives Highlight Crop Supply/Demand and Seasonal Price Trends Forecast 2009 Crop Corn & Soybean Prices Forecast 2009 Cost of Production and Net Revenue per Acre Highlight the New SURE and ACRE Programs available in 2009 through 2012 Provide 5 Strategies and 5 Web Sites for Managing Crop Risks

3
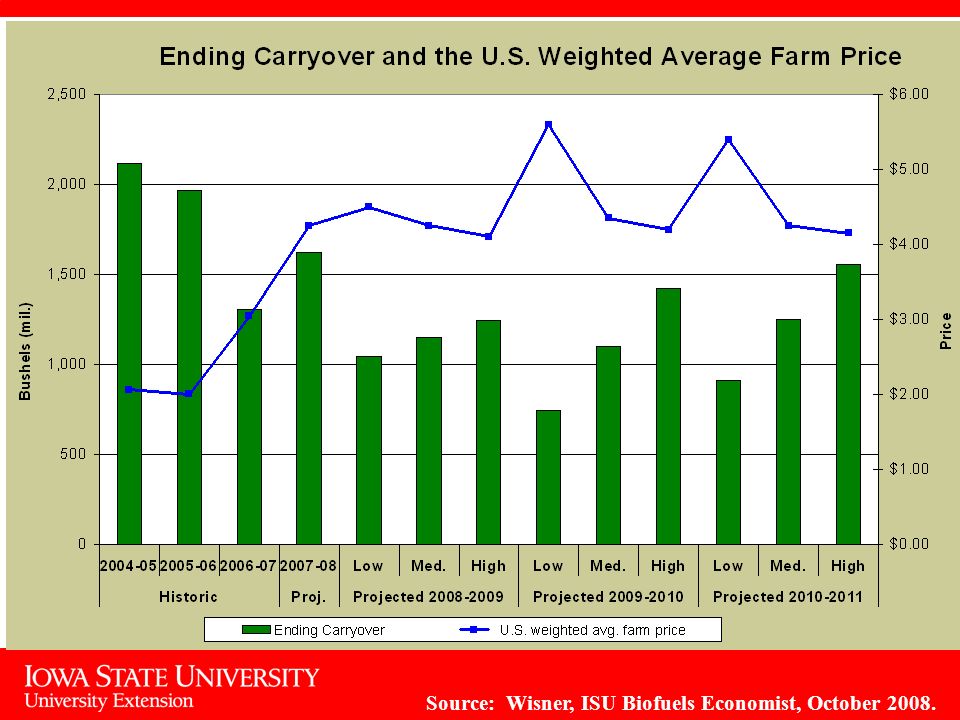
Source: Wisner, ISU Biofuels Economist, October 2008.

4
U.S. Planted Acreage Trend ◊ - Estimated * - Forecast Source: USDA WAOB and Johnson, ISU Ext. Economics, November 2008.

5
Source: Wisner, ISU Biofuels Economist, October 2008.

7
$5.60/bu 18% $4.35/bu 65% $4.20/bu 17% Corn Cash Price & Probability Forecast ’09-’10 Marketing Year Source: Wisner, ISU Biofuels Economist, October 2008.

8
New Crop Corn Seasonal Trend Source: CBOT data compiled by the U of MN, CFFM, 2008.

9
2009 New Crop Corn Chart Source: jim.wyckoff.com, November 6 th, 2008.

10
2009 New Crop Soybean Chart Source: jim.wyckoff.com, November 6 th, 2008.

11
Source: Wisner, ISU Biofuels Economist, October 2008.

13
$11.50/bu 18% $10.00/bu 65% $9.80/bu 17% Soybean Cash Price & Probability Forecast ’09-’10 Marketing Year Source: Wisner, ISU Biofuels Economist, October 2008.

14
New Crop Soybeans Seasonal Trend Source: CBOT data compiled by the U of MN, CFFM, 2008.

15
Source: Schnitkey, U of IL Ext. Economics, Oct. 2008. Direct Costs of Crop Production ($/A) Historical vs. 2009 Forecast
 Historical vs Forecast.")
16
Non-Land Costs vs. Gross Revenue ($/A) Historical vs. 2009 Forecast Source: Schnitkey, U of IL Ext. Economics, Oct. 2008.

17
SURE - SUpplemental REvenue Permanent Disaster Program Provides “supplemental” revenue coverage to existing crop insurance policies Insured must cover all crops, not individual crops Program offered 2009 through 2012 Annually, land must be in a “disaster county” (U.S. Secretary of Ag designation) –or a contiguous county –or crop revenue loss on all crops on all farms must exceed 50% All crops on all farms must be insured Administered by Farm Service Agency (FSA) Source: ISU Extension Economics, November 2008.
 –or a contiguous county –or crop revenue loss on all crops on all farms must exceed 50% All crops on all farms must be insured Administered by Farm Service Agency (FSA) Source: ISU Extension Economics, November")
19
New Average Crop Revenue Election (ACRE) Gives producers a one-time option to choose a revenue-based counter-cyclical payment program, starting in 2009 through 2012 (irrevocable election) Producers choose between the current program (with the potential CCP) or ACRE Computed on planted acres, up to the total number of base acres on the farm Price guarantee is the 2-year National Marketing Year Average (MYA) Cash Price. Source: ISU Extension Economics, November 2008.

20
ACRE Decisions Producers choosing ACRE agree to a 20% decline in direct payments and a 30% decline in loan rates Program has state and farm trigger levels, both must be met before payments are made Expected state and farm yields based on 5-year Olympic average yields per planted acre Revenue Guarantee = 2-year National MYA cash price X 5-year state Olympic average yield X 90% Actual Revenue = National MYA cash price X Actual state yield per planted acre (that year). Source: ISU Extension Economics, November 2008.

21
ACRE vs. CCP ACRE pays out No ACRE payments CCP pays out No CCP payments Source: ISU Extension Economics, November 2008.

22
ACRE Set-up for Iowa Corn 2009 Sign-up Decision YearYield per Planted Acre (bu./acre) 2004176.7 2005168.9 2006162.7 2007166.8 2008161.9* Olympic Average166.1 YearNational Average Price ($/bu.) 2007-084.20 2008-09 4.40* Average$ 4.30 * *The 2008 yield and price are forecasts. Prices are as of Nov. 10 th. So the expected state yield would be 166.1 bushels per acre and the ACRE price guarantee would be $4.30 per bushel. Source: ISU Extension Economics, November 2008.

23
State Revenue Guarantee –166.1 bu/A (most recent 5 years – Olympic Average) –X $4.30 /bu (forecast) –= $714/A Gross Revenue (estimated) –X 90% –= $643/A State Revenue Guarantee for 2009 (estimated) Farm Revenue Guarantee –170 bu/A (example only) Last 5-year Olympic Average – by FSA Farm Serial Number) –X $4.30 /bu (forecast) –= $731/A Gross Revenue (estimated) –+ $24/A Crop Insurance Premium Paid (estimated) –= $755/A Farm Revenue Guarantee for 2009 (estimated) State & Farm Revenue Guarantees Source: ISU Extension Economics, November 2008.
 –X $4.30 /bu (forecast) –= $714/A Gross Revenue (estimated) –X 90% –= $643/A State Revenue Guarantee for 2009 (estimated) Farm Revenue Guarantee –170 bu/A (example only) Last 5-year Olympic Average – by FSA Farm Serial Number) –X $4.30 /bu (forecast) –= $731/A Gross Revenue (estimated) –+ $24/A Crop Insurance Premium Paid (estimated) –= $755/A Farm Revenue Guarantee for 2009 (estimated) State & Farm Revenue Guarantees Source: ISU Extension Economics, November 2008.")
24
Determining 2009 ACRE Payment (Considers Both Triggers are Met) Lesser of State ACRE Revenue Guarantee Minus Actual State Revenue or State ACRE Revenue Guarantee Times25% ACRE Payments are issued after October 1 st of the year following harvest. ACRE Participant Payment Limits are $40,000 on Direct Payments (DPs) and reduced by the 20% DP. If enrolled in ACRE, then an Individual’s Payment Limits are $32,000 for DPs and $73,000 for ACRE Payments or $105,000 total. Source: ISU Extension Economics, November 2008.
 and reduced by the 20% DP. If enrolled in ACRE, then an Individual’s Payment Limits are $32,000 for DPs and $73,000 for ACRE Payments or $105,000 total. Source: ISU Extension Economics, November")
25
Potential 2009 Iowa ACRE Payment Assumptions: 5-yr. State Olympic Yield = 166.1 bu/A 5-yr. Farm Olympic Yield = 170 bu/A 2-yr. National Avg. Cash Price = $4.30 /bu 2009 State Revenue Guarantee = $643/A (estimates) 2009 Farm Revenue Guarantee = $755/A (estimates) In 2009, State Yield = 150 bu/A and Farm Yield = 160 bu/A The 2009-10 National Avg. Cash Price = $4.00/bu 2009 Actual State Revenue = 150 bu/A X $4.00/bu = $600 (forecast) 2009 Actual Farm Revenue = 160 bu/A X $4.00/bu = $640 (forecast) Example Only Since both 2009 the State and Farm Actual Revenue are below the Guarantees, an ACRE Payment is made. $643/A State Guarantee - $600/A Actual State Revenue = $43/A X (170 bu/A /166.1 bu/A) X 83.3% = $37/A Payment Source: ISU Extension Economics, November 2008.
 2009 Farm Revenue Guarantee = $755/A (estimates) In 2009, State Yield = 150 bu/A and Farm Yield = 160 bu/A The National Avg. Cash Price = $4.00/bu 2009 Actual State Revenue = 150 bu/A X $4.00/bu = $600 (forecast) 2009 Actual Farm Revenue = 160 bu/A X $4.00/bu = $640 (forecast) Example Only Since both 2009 the State and Farm Actual Revenue are below the Guarantees, an ACRE Payment is made. $643/A State Guarantee - $600/A Actual State Revenue = $43/A X (170 bu/A /166.1 bu/A) X 83.3% = $37/A Payment Source: ISU Extension Economics, November")
26
ACRE Beyond 2009 Revenue Guarantee is updated each year through 2012 using the same rules: 5-year Olympic Average Yields (most recent years) 2-years of National (MYA) Cash Prices Revenue Guarantees can not change by more than 10% (up or down) from year to year: So for example the 2009 State Revenue Guarantee is $643, then the 2010 ACRE Revenue Guarantee must be between $579 and $707. Source: ISU Extension Economics, November 2008.

27
Source: Johnson, ISU Ext. Economics, November 2008. 5 Strategies for Managing Crop Risks Limit Major Capital Expenditures Conduct Fall Soil Tests: Improve Fertilizer Efficiency Maximize Fuel: Harvest, Drying and Tillage Consider Early and Volume Seed Discounts Negotiate 2009 Cash Rent: Use $4.50 Corn & $10 Soybeans

28
5 Crop Risk Management Web Sites Ag Decision Maker – ISU Extension Economics (Spreadsheets - Decision Tools) www.extension.iastate.edu/agdm Farm Doc – U of IL Extension Economics www.farmdoc.uiuc.edu Center for Farm Financial Management – U of MN www.cffm.umn.edu Corn Nitrogen Rate Calculator Calculator http://extension.agron.iastate.edu/soilfertility/nrate.aspx Crop Risk Management – ISU Polk County (Marketing, Farm Program & Crop Insurance: Updates/Newsletters/Webcasts www.extension.iastate.edu/polk/farmmanagement Source: Johnson, ISU Ext. Economics, November 2008.

Similar presentations


 957-5790>")


 957-5790>")
 Will Snell – University of KY ------>")
 957-5790>")


 957-5790>")
 957-5790>")

 957-5790>")
 957-5790>")
