Download presentation
Presentation is loading. Please wait.

1
Characterization of Arctic Mixed-Phase Cloudy Boundary Layers with the Adiabatic Assumption Paquita Zuidema*, Janet Intrieri, Sergey Matrosov, Matthew Shupe, Taneil Uttal NOAA Environmental Technology Laboratory, Boulder, CO Brad Baker, Paul LawsonSPEC, Boulder, CO Aircraft path Lidar cloud base Temperature inversion Cloud radar reflectivity time Height (km) 1.0 km *National Research Council
 1.0 km *National Research Council")
2
MOTIVATION Mixed-phase clouds (i.e., liquid and ice coexisting near each other) are common in Arctic (Uttal et al. 2002; Intrieri et al. 2002; Shupe et al. 2001) Radiative forcing by liquid-containing clouds important to Arctic climate and surface energy balance (Intrieri and Shupe, 2002) Recent decades have seen a rapid warming of the Arctic Surface (Francis, 2002; Stone 1997) Difficult to characterize the liquid and ice components separately Most retrievals best suited for low cloud optical depths (e.g., lidar, IR spectra (Turner et al., 2002), near-IR spectra (Daniel et al., 2002) Mixed-phase microphysical processes may be necessary for models to properly simulate the annual cycle of Arctic clouds (S. Vavrus, 2003)
 Radiative forcing by liquid-containing clouds important to Arctic climate and surface energy balance (Intrieri and Shupe, 2002) Recent decades have seen a rapid warming of the Arctic Surface (Francis, 2002; Stone 1997) Difficult to characterize the liquid and ice components separately Most retrievals best suited for low cloud optical depths (e.g., lidar, IR spectra (Turner et al., 2002), near-IR spectra (Daniel et al., 2002) Mixed-phase microphysical processes may be necessary for models to properly simulate the annual cycle of Arctic clouds (S. Vavrus, 2003).")
3
Information from multiple sensors can be combined to describe liquid and ice cloud vertical structure May 1 – May 10 SHEBA example Derivation of liquid and ice cloud optical depth structure and effective particle size Comparisons against aircraft measurements (May 4 and May 7) Comparison of modeled surface radiative fluxes to observed fluxes
 Comparison of modeled surface radiative fluxes to observed fluxes")
4
Surface-based Instrumentation: May 1-8 time series dBZ 35 GHz cloud radar ice cloud properties depolarization lidar-determined liquid cloud base Microwave radiometer-derived liquid water paths 4X daily soundings. temperature inversions define liquid cloud top lidar cloud base -5-45 -20 1 2345678 day z 2 km -30C 4 1 8 2 4 6 8 km 100 g/m^2 day -10C

5
May 4, 7 NCAR C130 Research Flights FSSP-100 2-47 liquid, ice size distribution 1D OAP-260X (May 4) 40-640 ice size distribution 2D OAP (May 7) 25-800 ice shape, size Cloud Particle Imager 5-2000 particle phase, shape, size King hot-wire probe liquid water content range (micron) parameterinstrument
 ice size distribution 2D OAP (May 7) ice shape, size Cloud Particle Imager particle phase, shape, size King hot-wire probe liquid water content range (micron) parameterinstrument")
6
Aircraft path Lidar cloud base Temperature inversion Cloud radar reflectivity time Height (km ) 1 2 dBZ 0 -50 May 4 24:00 22:0023:00 UTC
 1 2 dBZ May 4 24:00 22:0023:00 UTC")
7
Liquid Water Content: Adiabatic Ascent Calculation lidar-determined liquid cloud base parcel interpolated sounding temperature structure constrained w/ microwave radiometer-derived liquid water path King LWC adiabatic LWC CB excellent correspondence between adiabatic calc. and King probe LWC May 4 Z (km) Liquid water content g/m^3 0 0.5 0.6 1.0
 Liquid water content g/m^")
8
Derivation of liquid volume extinction coefficient b and effective particle radius r e Lognormal droplet size distribution = exp(k 2 s 2 /2) (Frisch et al., ’95,’98,’02) cast b and r e in terms of observables: LWC (adiabatic calc.), Mean aircraft cloud droplet conc. N=244 (4) Mean aircraft lognormal spread in droplet size distribution s =0.76 (0.04) May 4 rere b adiabatic aircraft
 Mean aircraft lognormal spread in droplet size distribution s =0.76 (0.04) May 4 rere b adiabatic aircraft.")
9
Aircraft-adiabatic calc. optical depth comparison t aircraft t adiabatic May 4 May 7 10 6 2 0 2 6 Uses microwave LWP

10
Temperature inversion agrees well with the location of the liquid cloud top Cloud radar top Temperature inversion 1 11098765432 day 1 km 2 km

11
May 1 – 10 liquid b, r e, t time series b rere day 2 rere 60 030 km -1 micron 012 3458106791 day t 0 30 0 12 Mean liquid cloud optical depth ~ 8 1km 2km

12
Ice: Radar-only retrieval for all-ice clouds extended to mixed-phase (Matrosov ’02, ’03) IWC, b i, retrieved from radar reflectivity and Doppler velocity Define D eff = 1.5 IWC/r i A p = 3 IWC/r i b (Mitchell et al., 2002, Boudala et al., 2002) Comparison to in situ data more uncertain: Complete size distributions difficult to form Another degree of freedom: Particle shape
 IWC, b i, retrieved from radar reflectivity and Doppler velocity Define D eff = 1.5 IWC/r i A p = 3 IWC/r i b (Mitchell et al., 2002, Boudala et al., 2002) Comparison to in situ data more uncertain: Complete size distributions difficult to form Another degree of freedom: Particle shape")
13
Robust conclusions: Radar insensitive to liquid when ice is present Ice cloud optical depth almost insignificant Large error bars (~4x ?) dBZ liquid radar Ice aircraft b -40 -5 10 -3 110 2 km -1 IWC D eff 0 1 150 10 -4 g m -3 micron 0.6 1.2 km
 dBZ liquid radar Ice aircraft b km -1 IWC D eff g m -3 micron km")
14
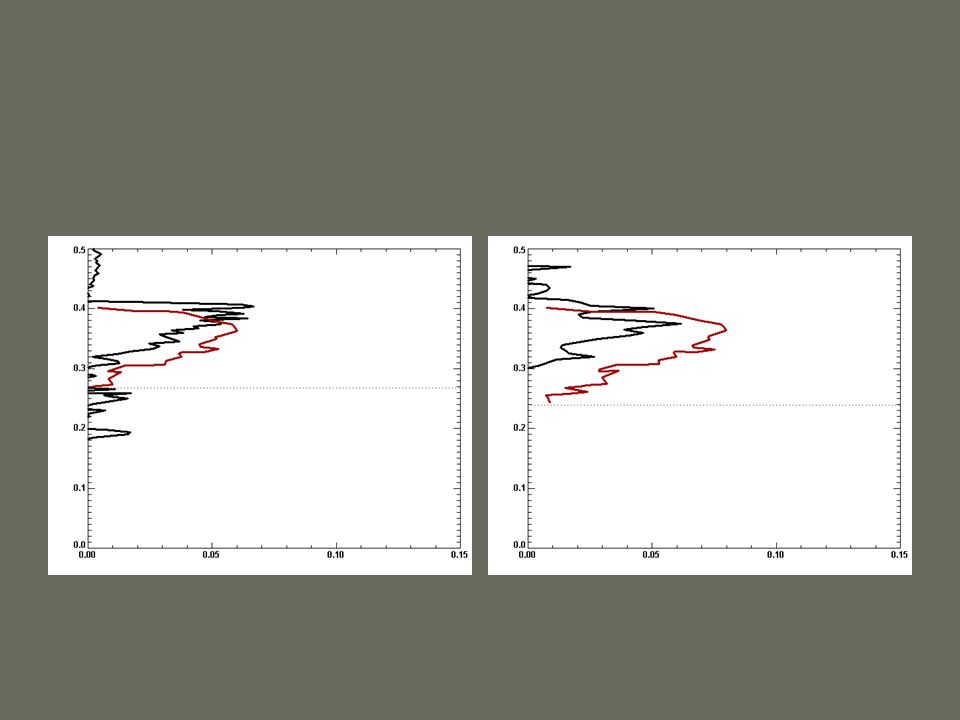
Ice b, r e, t Mean ice cloud optical depth ~ 0.2 Mean ice effective radius ~ 30 micron => main but indirect radiative effect is the uptake of the liquid b 3 0 Km -1 rere 40 0 t rere 0 0 0 8 Z (km) 4
 4")
15
Comparison of calculated surface radiative fluxes to observed fluxes Streamer (Key and Schweiger) DISORT (Stamnes et al. ) Parameterized shortwave ice cloud optical properties for 7 particle habits Arctic aerosol profile Lowtran 3B gaseous absorption database SHEBA spectral surface albedo (Perovich et al.) Adapted for cloud radar vertical resolution
 Parameterized shortwave ice cloud optical properties for 7 particle habits Arctic aerosol profile Lowtran 3B gaseous absorption database SHEBA spectral surface albedo (Perovich et al.) Adapted for cloud radar vertical resolution.")
16
Comparison of modeled to observed surface downwelling radiative fluxes, May 1 -10 Observed LW > modeled LW by 13 (15) W m -2 modeled SW > observed SW by 37 (36) W m -2 Clear-sky bias ½ of cloudy-sky bias => modeled cloud t too low FSSP cloud droplet number N too low ? LWP too low ? shortwave modeled longwave modeled observed 0 100 300 600 W m -2

17
Main sensitivity of total optical depth is to LWP error Microwave liquid water path g m -2 Frequency 025 0.2 0 10 5 Lidar, IR spectra retrievalsMicrowave LWP statistical physical SHEBA year MWR LWP frequency distribution (Shupe and Intrieri, 2003)
")
18
Summary & Conclusions Arctic mixed-phase clouds are common, radiatively and climatically important Can characterize the liquid with an adiabatic ascent calculation using a saturated air parcel from the lidar-determined liquid cloud base, constrained with the microwave radiometer-derived liquid water path The ice component can be characterized with cloud radar retrievals, even when LWC is high This was applied to a May 1-10 time series with some success, judging from comparison to aircraft data and comparison of calculated radiative fluxes to those observed. For May 1-10: radiative flux behavior is practically that of a pure liquid cloud The low ice water contents are consistent with what is required for the maintenance of a long-lived super-cooled (~ -20 C) liquid water cloud (e.g., Pinto, 1998, Harrington, 1999) Usefulness of the technique can be improved even further by improving the microwave radiometer retrievals of liquid water path
 liquid water cloud (e.g., Pinto, 1998, Harrington, 1999) Usefulness of the technique can be improved even further by improving the microwave radiometer retrievals of liquid water path.")
Similar presentations

. Reading: 19 Feb 08 – Meeting with Met office.>")


 –Met.>")


