Download presentation
Presentation is loading. Please wait.

1
Improving the Representation of Fire Disturbance in Dynamic Vegetation Models by Assimilating Satellite Data E.Kantzas, S.Quegan & M.Lomas School of Maths and Statistics University of Sheffield

2
Nansen Centre, Russia Nansen Centre, Norway Global Climate Forum, Germany Max Planck, Germany Stockholm University, Sweden University of Jena, Germany IFREMER, France CLS, France FH Joanneum, Austria University of Sheffield, UK Finnish Meteorological Institute, Finland University of Helsinki, Finland Researchers from partnering institutions visit Nansen Centre, St. Petersburg. Collaborate with Russian colleagues on environmental, climate and socio- economic research in the Arctic and sub- Arctic. Establish links between Russian and EU research institutions

3
Fire Land Cover Biomass LitterCarbon Permafrost Vegetation Soil GPP Atmosphere Climate & CO 2 Atmosphere Climate & CO 2 Snow Properties Snow Dynamics Soil Surface Ground Water Runoff Net Biome Productivity River C Transport EVT Atmosphere NPP

4
Carbon Balance (gC yr -1 ) 20-year Average, 50º-70ºN, Pan-Boreal Carbon fluxes to the atmosphere Trigger Vegetation Succession Alter Hydrology Remove Soil Carbon Thaw Permafrost Carbon emissions from fires have a significant effect on the magnitude of Net Biome Production (NBP).
 20-year Average, 50º-70ºN, Pan-Boreal Carbon fluxes to the atmosphere Trigger Vegetation Succession Alter Hydrology Remove Soil Carbon Thaw Permafrost Carbon emissions from fires have a significant effect on the magnitude of Net Biome Production (NBP).")
5
Dynamic Vegetation Models Gridcell by Gridcell Treatment No Lateral Fluxes Everyvery small each year Every gridcell experiences very small fire disturbance each year. Even if area average is accurate Minimal removal of Vegetation Soil litter insignificant Effects on ecosystem insignificant Kantzas et al., 2013

6
Univ. of Washington, Computer Vision, 2000 Dewar, M., 2013 Labelling (grouping) connected pixels in a binary image. Pixels can be connected through a common side or a common vertex. CCL has numerous applications in image analysis, computer vision. Also referred to as blob detection.
 connected pixels in a binary image. Pixels can be connected through a common side or a common vertex. CCL has numerous applications in image analysis, computer vision. Also referred to as blob detection..")
7
GFED4.0: Daily, global 0.25° spatial resolution burned area/fire emissions product. (2001-2012) 1)Acquire set of daily GFED4.0 images of burned area for the region of interest (Russia & Canada). 2)Convert to binary. Fire pixels become 1’s, rest become 0’s. 3)Stack (overlay) daily binary images. Latitude and longitude provide 2 dimensions and day the third. 4)Apply the 3 dimensional CCL algorithm. As fire propagates through space and time, CCL will link continuous fire pixels.
 1)Acquire set of daily GFED4.0 images of burned area for the region of interest (Russia & Canada). 2)Convert to binary. Fire pixels become 1’s, rest become 0’s. 3)Stack (overlay) daily binary images. Latitude and longitude provide 2 dimensions and day the third. 4)Apply the 3 dimensional CCL algorithm. As fire propagates through space and time, CCL will link continuous fire pixels..")
9
Canadian Large Fire Database (CLFD): Ground data of forest fires in Canada (1959-1999). No temporal overlap between GFED4.0 and CLFD. No similar database for fires in Russia. PFs obtained from 6-connected CCL and CLFD were largely similar in all categories. Best results between CLFD and CCL-6 on Canadian forests. Worst results between CLFD and CCL-6 on Russian non-forest cover.

10
Method is model-independent! 1)Run model once. Obtain fire output (fraction of area burned each year). 2)Run the assimilation algorithm with inputs the CCL fires and the fire output from the model. Obtain the new fires. 3)Re-run the model using the new fires obtained from Step 2. 2 model runs are NOT required each time LPJ-WM: Dynamic Vegetation Model tailored for High Latitudes. Includes organic soils and permafrost dynamics
. 2)Run the assimilation algorithm with inputs the CCL fires and the fire output from the model. Obtain the new fires. 3)Re-run the model using the new fires obtained from Step 2. 2 model runs are NOT required each time LPJ-WM: Dynamic Vegetation Model tailored for High Latitudes. Includes organic soils and permafrost dynamics.")
11
0.150.020.150.05 0.10.150.210.14 0.220.250.31 0.210.170.220.17 0.010.020.010.03 0.010.030.010.02 0.030.01 0.02 0.01 0.02 0.160.040.160.08 0.110.180.220.16 0.170.230.260.33 0.220.180.240.19 0.01 0.11 0.090.06 0.160.030.160.08 0.110.070.220.16 0.170.140.20.33 0.220.180.240.19 0.160.040.160.07 0.110.180.220.16 0.170.230.260.33 0.220.180.240.19
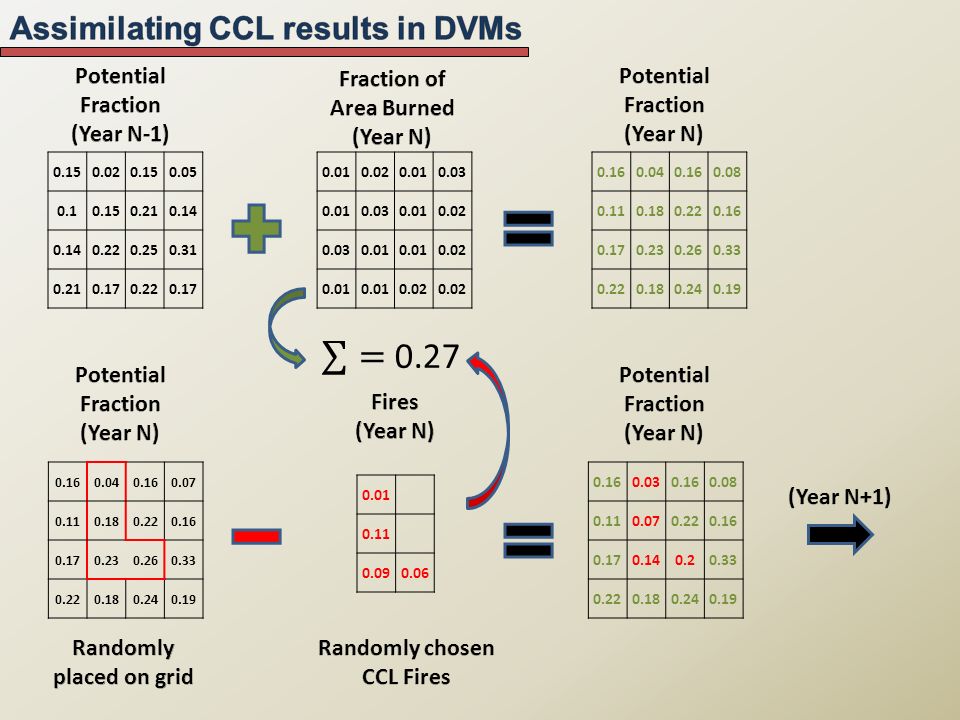
12
Fire Return Interval remained largely unchanged in the boreal region bar sub-region boundaries. Fire Size Distribution now follows CCL fires.

13
Cover was re-established after 5 years. Natural Vegetation advantageous over prescribed cover to describe vegetation succession. Biomass required 50 years to recover. Region remained a strong sink for decades. No canopy interception/radiation balance in LPJ-WM!

14
Kantzas E., Quegan S., Lomas M., Improving the representation of fire disturbance in Dynamic Vegetation Models by assimilating satellite data, Geoscientific Model Development, 2015 (under review) Kantzas E., Lomas M., Quegan S., Fire at high latitudes: Data-model comparisons and their consequences, Global Biochemical Cycles, 27, 677- 691, 2013 Dewar, M., Characterization and Evaluation of Aged 20Cr32Ni1Nb Stainless Steels, 2013 Univ. of Washington, Computer Vision, 2000 1)CCL approach creates pool of individual fire events to be assimilated in Dynamic Vegetation Models. 2)The assimilation approach produced Fire Return Interval largely similar to the one the model originally produces. 3)Fire Sizes in the model becomes realistic. 4)Method is model-independent. 1)Evaluate model post-fire dynamics considering radiation effects and compare against field data. in a changing climate 2)Run future scenarios and evaluate fire effects on vegetation succession, soil temperatures and permafrost in a changing climate.
CCL approach creates pool of individual fire events to be assimilated in Dynamic Vegetation Models. 2)The assimilation approach produced Fire Return Interval largely similar to the one the model originally produces. 3)Fire Sizes in the model becomes realistic. 4)Method is model-independent. 1)Evaluate model post-fire dynamics considering radiation effects and compare against field data. in a changing climate 2)Run future scenarios and evaluate fire effects on vegetation succession, soil temperatures and permafrost in a changing climate..")
Similar presentations


>")


 Y. YAMAGATA and G. ALEXANDROV Climate Change Research Project, National Institute for Environmental Studies,>")


 by Mercator W.P 1.4: Land cover and Fire and their representation in models. Objective 1: To amalgamate high latitude land cover.>")


 T. Machida, K. Shimoyama, N.Kadygrov, A. Itoh (1)>")

 Autumn Sun 1.>")