Download presentation
Presentation is loading. Please wait.

1
ACIS 1504 - Introduction to Data Analytics & Business Intelligence Clarity

3
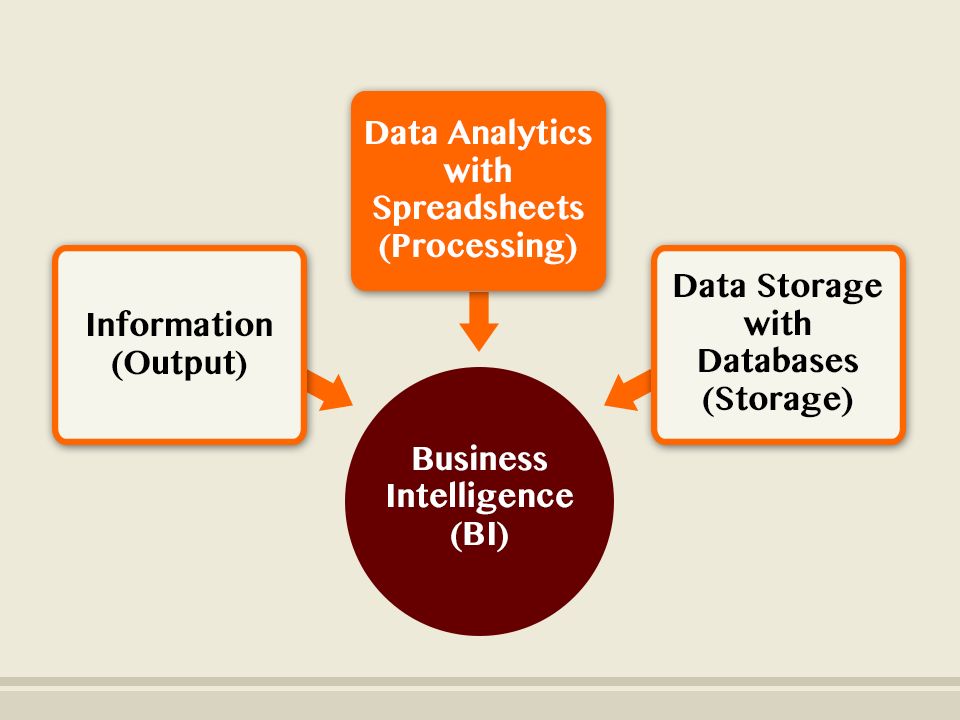
Business Intelligence Data Analytics E-commerce Big Data* Methods Data Mining* Text Mining* OLAP* Visualization* Query Data Analytics E-commerce Big Data* Methods Data Mining* Text Mining* OLAP* Visualization* Query Database Benefits Components Database Benefits Components

4
Concept Map Data Analytics Clarity Implementation Design Formatting Conditional Format Sort Freeze Panes

5
Objectives Explain the Clarity Design Goal and the four principles that comprise this goal. Demonstrate Excel features that support Clarity.

6
Segment A: Unity

7
Delineation Order Emphasis Clarity Principles

8
Unity Fonts Colors Borders Number Formats Freeze Panes Print Titles

9
Display Problem

10
Freeze Panes First position cursor below & to the right of headings Mac Users: Windows Menu

11
Printing Problem

12
Print Titles

13
Segment B: Delineation

14
Fonts Colors Borders Number Formats Indent/Wrap Row Height/Column Width

15
Balanc e Sheet Examp le

16
Delineate Worksheet Zones Heading Data Calculations

17
Nashville Hotels Example Open Nashville Hotels.xlsx Familiarize yourself with the data. Apply appropriate Excel features to support Unity and Delineation.

18
Nashville Hotels – formatting w/purpose 1.Apply formatting including fonts, background colors and borders to clearly identify at least the heading, data and calculation zones of Sheet1 and Sheet 2. 2.Apply number formatting so all dollar figures display a dollar sign. 3.Add a title that describes the entire worksheet.

19
Nashville Hotels – Unity w/Big Data 4.Setup Sheet1 so that column and row headings remain on the screen no matter where you scroll. Ensure that these headings appear on every printed page as well.

20
Segment C: Order

21
Sort Sort by Last Name. If two students have the same last name, sort by First Name as well. First, select data range.

22
Grades Example - Sorting Sort the data chronologically. Within one semester, sort students alphabetically. 1.What is the earliest semester represented in this data set? 2.Who is the last student alphabetically in the earliest semester? 3.What is the next semester chronologically?

23
Custom Sort

24
Nashville Hotels Example - Sorting Group hotels within the city they are physically located. Sort these cities alphabetically. Within each city group, list hotels by size; hotels with the most rooms would appear first. If two hotels in one city have the same number of rooms, list them alphabetically.

25
Nashville Hotels Example - Sorting Re-sort the hotels by price, listing pricing groups lowest to highest (Budget, Economy, Midprice, Upscale, then Luxury). Within each price category, sort hotels alphabetically.

26
Segment D: Emphasis

27
Conditional Format First, select data range.

28
Conditional Formatting Example Emphasize Accounting majors. First, select data range.

29
Emphasize Exam Scores Example 1.Emphasize perfect Exam 1 scores from all students. 2.Using only the first 10 students in your worksheet, emphasize the highest Exam 2 score. 3.Display a green icon for A’s, yellow for B’s and C’s and red for lower grades.

30
Emphasize Hotel Rooms Example Highlight hotels with a large meeting room (largest room over 10,000 sq ft). Don’t use the default formatting choices, build your own. Display one icon for large hotels (>200 rooms), a second icon for medium sized hotels (100-200 rooms) and a third icon for small hotels (<100 rooms).
, a second icon for medium sized hotels ( rooms) and a third icon for small hotels (<100 rooms)..")
Similar presentations