Download presentation
Presentation is loading. Please wait.

1
EEA activities on climate change impacts, vulnerability and adaptation
Project EURO4M 4th Annual Meeting, SMHI, Norrkoping, Sweden EEA activities on climate change impacts, vulnerability and adaptation André Jol Head of group vulnerability and adaptation 1

2
EEA member and cooperating countries
The European Environment Agency is the EU body dedicated to providing sound, independent information on the environment We are a main information source for those involved in developing, adopting, implementing and evaluating environmental policy, and also the general public 2

3
EU policy processes 3

4
EU strategy on climate change adaptation objectives
Promoting action by Member States: The Commission will encourage all Member States to adopt comprehensive adaptation strategies (currently 15 have strategies) and will provide funding to help them build up their adaptation capacities and take action. It will also support adaptation in cities by launching a voluntary commitment based on the Covenant of Mayors initiative. 'Climate-proofing' action at EU level by further promoting adaptation in key vulnerable sectors such as agriculture, fisheries and cohesion policy, ensuring that Europe's infrastructure is made more resilient, and promoting the use of insurance against natural and man-made disasters. Better informed decision-making by addressing gaps in knowledge about adaptation and further developing the European climate adaptation platform (Climate-ADAPT) as the 'one-stop shop' for adaptation information in Europe. 4
 and will provide funding to help them build up their adaptation capacities and take action. It will also support adaptation in cities by launching a voluntary commitment based on the Covenant of Mayors initiative. Climate-proofing action at EU level by further promoting adaptation in key vulnerable sectors such as agriculture, fisheries and cohesion policy, ensuring that Europe s infrastructure is made more resilient, and promoting the use of insurance against natural and man-made disasters. Better informed decision-making by addressing gaps in knowledge about adaptation and further developing the European climate adaptation platform (Climate-ADAPT) as the one-stop shop for adaptation information in Europe. 4.")
5
EU strategy package 5

6
EU adaptation strategy proposed actions
Action 1: Encourage all Member States to adopt comprehensive adaptation strategies Action 2: Provide LIFE funding to support capacity building and step up adaptation action in Europe. ( ) Action 3: Introduce adaptation in the Covenant of Mayors framework (2013/2014). Action 4: Bridge the knowledge gap (H2020, JPI, Copernicus) Action 5: Further develop Climate-ADAPT as the ‘one-stop shop’ for adaptation information in Europe. Action 6: Facilitate the climate-proofing of the Common Agricultural Policy (CAP), the Cohesion Policy and the Common Fisheries Policy (CFP). Action 7: Ensuring more resilient infrastructure Action 8: Promote insurance and other financial products for resilient investment and business decisions. Draft Multi-annual Financial Framework share of climate- related EU expenditure of 20% (35% for research) 6
 Action 3: Introduce adaptation in the Covenant of Mayors framework (2013/2014). Action 4: Bridge the knowledge gap (H2020, JPI, Copernicus) Action 5: Further develop Climate-ADAPT as the ‘one-stop shop’ for adaptation information in Europe. Action 6: Facilitate the climate-proofing of the Common Agricultural Policy (CAP), the Cohesion Policy and the Common Fisheries Policy (CFP). Action 7: Ensuring more resilient infrastructure. Action 8: Promote insurance and other financial products for resilient investment and business decisions. Draft Multi-annual Financial Framework share of climate- related EU expenditure of 20% (35% for research) 6.")
7
Importance of monitoring and observations
7

8
Climate change, impacts and vulnerability in Europe 2012 (EEA indicator based report)
Objectives: present climate change and impacts identify sectors and regions most at risk identify main sources of uncertainty demonstrate how monitoring and scenario development can improve the knowledge base Contributions by European Topic Centres, WHO, ECDC, JRC (about 90 experts) Data from research projects and international databases Report on adaptation actions (EU, national, sectoral) is due April 2013 8 8 8
 Data from research projects and international databases. Report on adaptation actions (EU, national, sectoral) is due April")
9
More than 40 indicators Climate variables
Cryosphere (glaciers, snow and ice) Marine environment and biodiversity Coastal zones Inland waters (quantity and quality, biodiversity) Terrestrial ecosystems and biodiversity Soil Agriculture Forestry/forests Human health Energy Other information, e.g. on: Fisheries Transport Vulnerability indices 9 9 9
 Marine environment and biodiversity. Coastal zones. Inland waters (quantity and quality, biodiversity) Terrestrial ecosystems and biodiversity. Soil. Agriculture. Forestry/forests. Human health. Energy. Other information, e.g. on: Fisheries. Transport. Vulnerability indices")
10
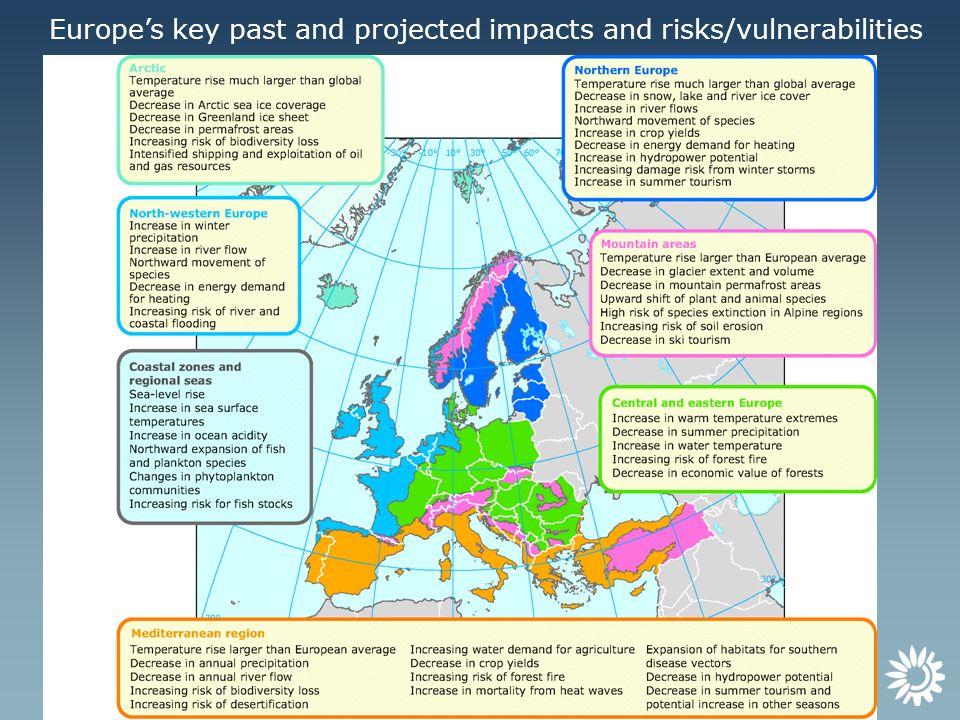
Europe’s key past and projected impacts and risks/vulnerabilities
10 10 10 10
11
Global temperature Three independent long records of global average near-surface (land and ocean) annual temperature show that the decade between 2002 and was 0.77 to 0.80 °C warmer than the pre-industrial average. Global reanalyses differ in their methods, which can lead to differences in ranking years, but all time series are close in agreement. 11 11 11
 annual temperature show that the decade between 2002 and 2011 was 0.77 to 0.80 °C warmer than the pre-industrial average. Global reanalyses differ in their methods, which can lead to differences in ranking years, but all time series are close in agreement")
12
European temperature The average temperature for the European land area for the last decade (2002–2011) is 1.3 °C above the pre-industrial level, which makes it the warmest decade on record. 12 12 12
 is 1.3 °C above the pre-industrial level, which makes it the warmest decade on record")
13
European temperature Large warming has been observed in the past 50 years over the Iberian Peninsula, across central and north-eastern Europe, and in mountainous regions. 13 13 13

14
Greenland ice sheet The Greenland ice sheet loses about 250 billion tonnes a year averaged over to This is estimated to contribute up to 0.7 millimetres a year to global sea- level rise (about one quarter of the total sea-level rise) 14 14 14
")
15
Arctic sea ice The extent and volume of the Arctic sea ice has declined rapidly since global data became available in 1980, especially in summer. Record low sea ice cover in September 2007, 2011 and 2012 was roughly half the size of the normal minimum extent in the 1980s. 15 15 15

16
Glaciers Most European glaciers are in retreat; glaciers in the Alps lost two thirds of their volume since The retreat is projected to continue. 16 16 16

17
Global and European sea level rise
Global mean sea level rose by 1.7 mm/year over the 20th century, while satellite measurements show a rise of 3 mm/year over the last 2 decades. Projections of global SLR in the 21st century are 20 cm to 2 m. It is more likely to be less than 1 m than to be more than 1 m. 17 17 17

18
River floods The number of river flood events increased due to better reporting and land-use changes River floods are projected to become more frequent (also flash and urban drainage floods) 18 18 18
")
19
Water stress Minimum river flows are projected to decrease throughout Europe (especially in summer) Water stress is projected to increase, especially in the south. This is due to increases in water abstraction and/or decreases in water availability. In a ‘sustainability ‘scenario water stress can be reduced. For agriculture increased efficiency for irrigation can reduce water abstractions, but this may not be sufficient to have enough water for aquatic ecosystems. 19 19 19

20
Plant and animal species
Plant and animal species are projected to shift to the north, forests to contract in the south and expand in the north, and many mountain plant species may face extinction. The rate of climate change is expected to exceed the ability of many plant and animal species to migrate, as landscape fragmentation may restrict movement. 20 20 20

21
Natural disasters Increases in damage costs from extreme weather events are due to increases in population, wealth and human activities in hazard-prone areas and to better reporting. Climate change is projected to increase these damage costs due to a projected increase in the intensity and frequency of extreme weather events. 21 21 21

22
Aggregated vulnerability
Economic, technical, and institutional capacity to adapt to climate change differs across Europe. When impacts of climate change affect regions with low adaptive capacity, the consequences can be severe. Territorial cohesion may be negatively affected by deepening existing socio‑economic imbalances. 22 22 22

23
Key messages Climate change (increases in temperature, changes in precipitation and decreases in ice and snow) is occurring globally and in Europe Wide range of impacts on environmental systems and society is occurring; further climate change impacts are projected for the future. Climate change can increase existing vulnerabilities and deepen socio‑economic imbalances in Europe. Damage costs from natural disasters have increased; the contribution of climate change to these costs is projected to increase in the future. Projected future damage costs from climate change can be reduced significantly by mitigation and adaptation actions. The causes of the most costly climate impacts are projected to differ strongly across Europe. 23 23 23

24
European Climate Adaptation Platform Climate-ADAPT
Supports governmental decision-makers developing/implementing climate change adaptation strategies, policies and actions Launched March 2012 (DG CLIMA, EEA) EEA maintains, with Commission, and supported by ETC CCA 24
 EEA maintains, with Commission, and supported by ETC CCA")
25
3 key tools have been developed for CLIMATE-ADAPT
Adaptation support tool Overview of countries activities Case study search tool 25

26
Comparison of countries actions
National adaptation strategies: (AT, BE, CH, DE, DK, ES, FI, FR, HU, IRL, LT, MT, NL, PT, SE, UK) Some of these also have adaptation action plans Impacts, vulnerability and adaptation assessments Research programmes Climate Services Web Portal Monitoring of adaptation 26
 Some of these also have adaptation action plans. Impacts, vulnerability and adaptation assessments. Research programmes. Climate Services. Web Portal. Monitoring of adaptation. 26.")
27
Conclusions Indicators are available but further monitoring and research (EU H2020, JPI and national) are needed Copernicus projects (e.g. EURO4M) and the planned EU climate change service and national services are essential Mainstreaming of climate change adaptation in EU policies is taking place; the European Commission adopted an EU adaptation strategy in April 2013 with proposals for further action Many EEA member countries have developed impacts, vulnerability and adaptation assessments and several countries and cities have strategies in place (and some also action plans); also many transnational actions have taken place or are planned The European Climate Adaptation Platform and transnational, national and city level adaptation platforms will support climate change adaptation at various governance levels 27
 and the planned EU climate change service and national services are essential. Mainstreaming of climate change adaptation in EU policies is taking place; the European Commission adopted an EU adaptation strategy in April 2013 with proposals for further action. Many EEA member countries have developed impacts, vulnerability and adaptation assessments and several countries and cities have strategies in place (and some also action plans); also many transnational actions have taken place or are planned. The European Climate Adaptation Platform and transnational, national and city level adaptation platforms will support climate change adaptation at various governance levels. 27.")
28
Thank you for your attention
28

Similar presentations


 information>")


