Download presentation
Presentation is loading. Please wait.

1
O lignin MeO O lignin OH OMe OH O lignin MeO O lignin OH OMe OH HO O O Me Slides and figures from Mark Williams, Diane McKnight, Bailey Simone, Rose Cory, Matt Miller, Rachel Gabor, Eran Hood

2
Complex, heterogeneous mixture Truly ubiquitous (ALL waters) Colored (gives water its color) Moderate molecular weight Mass Distribution: –50% C –35-40% O –4-6% H –1-6% N –<1-3%S
 Colored (gives water its color) Moderate molecular weight Mass Distribution: –50% C –35-40% O –4-6% H –1-6% N –<1-3%S")
3
Why DOM Matters Light absorbing DOM can act as sunscreen and control depth of photic zone Some DOM is bio-available and contains nutrients Organic acid portion of DOM can buffer pH Some DOM can act as metal complexing agents (fate & transport and bioavailability of metals) Hydrophobic organic pollutants can partition into some portion of DOM Some DOM can act as electron acceptors and donors Reducer and oxidizer Some DOM can “sensitize” the photochemical breakdown of pollutants Reactions with some DOM can produce toxic disinfection byproducts during drinking water treatment
 Hydrophobic organic pollutants can partition into some portion of DOM Some DOM can act as electron acceptors and donors Reducer and oxidizer Some DOM can sensitize the photochemical breakdown of pollutants Reactions with some DOM can produce toxic disinfection byproducts during drinking water treatment")
4
Soluble Decomposition Products Plants Microbes (bacteria, algae) Man-made (organic pollutants) Plant DOM Microbial DOM
 Man-made (organic pollutants) Plant DOM Microbial DOM")
5
DOM Pie (sometimes called hydrophobic) So how do we learn anything from this complex mixture?
 So how do we learn anything from this complex mixture")
6
CHEMISTRY!

7
Chemistry is all about electrons

8
Electrons have discrete energy levels (characteristic of the substance)
")
9
Electrons can move between energy levels

10
Electrons Orbitals have Specific Shapes

11
Molecules can have conjugated bonds (Molecular Orbital Theory!)
")
12
Molecules can be aromatic

13
So how does this awesome chemistry help us? Spectroscopy! Interaction of light and matter Specifically…. UV-VIS Fluorescence

14
1.Grab your sample 2.Filter your sample 3.Run it on a DOC analyzer for Dissolved Organic Carbon (DOC) and Dissolved Organic Nitrogen (DON) concentrations 4.Spectroscopy!
 and Dissolved Organic Nitrogen (DON) concentrations 4.Spectroscopy!")
15
UV-VIS Spectroscopy and SUVA 254

16
Absorbance Spectra of a DOM sample SUVA 254 is the absorbance at 254 nm normalized to the DOC concentration

17
UV-VIS Spectroscopy and SUVA 254 Higher SUVA 254 means greater degree of aromaticity !

18
Fluorescence Spectroscopy S0S0 S1S1 S2S2 Absorbance ΔE = λ Fluorescence ΔE ≠ λ ΔE = Emission λ – Excitation λ = Stokes Shift Geometry Rearrangements..Requires E!! Internal conversion vibrational relaxation

19
Fluorescence Spectroscopy

20
Quinones found in enzymes, e.g ubiquinone, and formed by lignin oxidation. Forms of this complex are found throughout cells Important in electron transfer reactions, such as the oxidation of NADH Also known as coenzyme Q “Q” “HQ” Ubiquinone Brief Interlude For More Chemistry

21
O lignin MeO O lignin OH OMe OH O lignin MeO O lignin OH OMe OH HO O O Me

22
What does a DOM Fluorescence Spectrum Look Like? Emission (nm) Excitation (nm) Protein-like humic Despite chemical diversity of DOM, similar steady state fluorescence spectra observed for ALL DOM EEMs; this strongly implies common pool of fluorophores
 Excitation (nm) Protein-like humic Despite chemical diversity of DOM, similar steady state fluorescence spectra observed for ALL DOM EEMs; this strongly implies common pool of fluorophores.")
23
Fluorescence Index Excitation (nm) Emission (nm) Ratio of emission intensity (470 nm / 520 nm) at 370 nm excitation
 Emission (nm) Ratio of emission intensity (470 nm / 520 nm) at 370 nm excitation")
24
Fluorescence Index FI Higher number = more microbial input Lower number = more terrestrial (plant) input
 input")
25
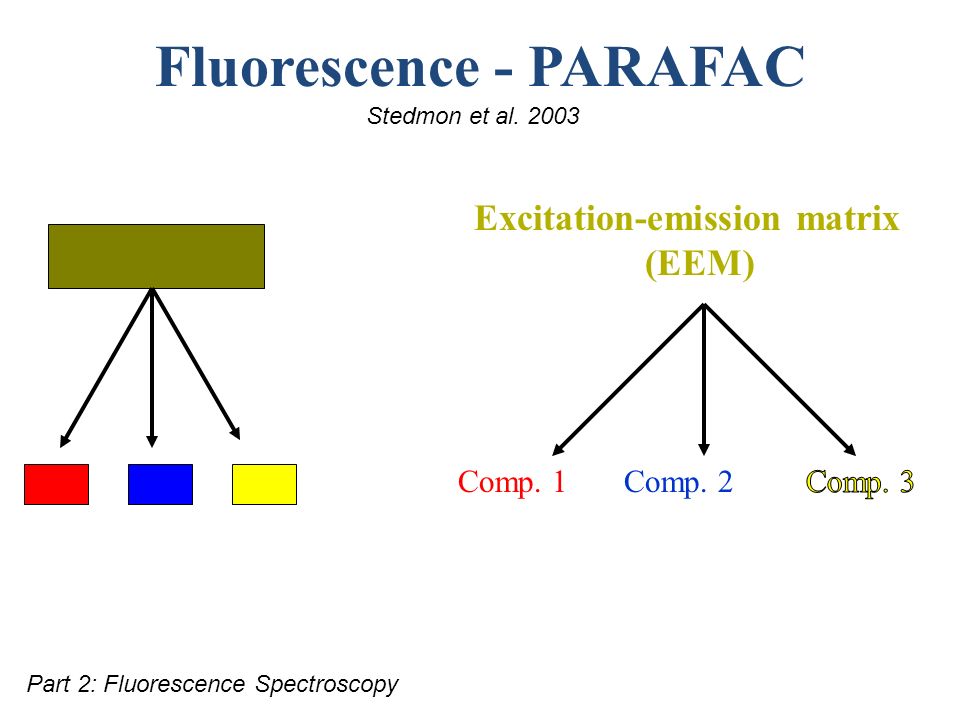
Excitation-emission matrix (EEM) Fluorescence - PARAFAC Part 2: Fluorescence Spectroscopy Stedmon et al. 2003
26
PARAFAC Components Oxidized Quinone-Like Components Reduced Quinone-Like Components Amino Acid-Like Components Unknown Components

27
Fluorescence Index Redox Index Component Ratio Specific UV Absorbance (SUVA) (254 nm) UV-VIS Absorbance Scan 3-D Fluorescence Scan UV-VIS Absorbance Scan Dissolved Organic Carbon Modeled in Cory + McKnight Parallel Factor Analysis (PARAFAC) Model yields.. + + Sample Processing - Analysis Diagram: Bailey Simone

28
DOM Fractionation

30
Fulvic Acid Fulvic acids make up a large fraction of aquatic DOM Provide most of the color Chemically active - redox reactions At pH = 2 HA precipitate, FA slightly hydrophobic

31
Fulvic Acid Isolation Whole Water Sample Filtered, pH< 2 XAD-8 0.1N NaOH Fulvic Acid Portion 2 XAD-8 Forward Back Elution Effluent 1 200 ml 20 mL FA portion 15 cm column Diagram: Bailey Simone

32
XAD-8 Columns

33
So We Can Know… DOC & DON concentrations SUVA 254 Degree of Aromaticity Fluorescence Fluorescence Index Microbial vs. Terrestrial Input PARAFAC Component Ratio Degree of oxidation/reduction All for both whole water and fulvic acid fractions ….So What?

34
Some DOM is Yummier to Microbes Higher C:N is more recalcitrant and more aromatic

35
Fe 3+ Fe 2+ NO 3 - NO 2 - + DOM DOM-N Humics act as electron shuttle Photoreduction of Ferric to Ferrous Iron Ferrous Wheel Hypothesis CO 2 Acetate Oxidized DOM DOM reducing microorganism Reduced DOM e-e- e-e-

36
Fe 3+ Fe 2+ NO 3 - NO 2 - + DOM DOM-N Humics act as electron shuttle Photoreduction of Ferric to Ferrous Iron Ferrous Wheel Hypothesis CO 2 Acetate Oxidized DOM DOM reducing microorganism Reduced DOM e-e- e-e- Electron shuttling affects: Bioavailability of metals Bioavailability of certain nutrients Degradation of persistent organic pollutants Microbial respiration rates And the ability depends on reduced/oxidized nature of DOM as well as the source of the DOM.

37
Hyporheic Zone: “hotspot” of biogeochemical reactions driven by mixing across redox gradient DOM influences that gradient, thus influencing nitrogen transport

38
How does DOM behave in a watershed? Most OM comes from top of soil (O and A horizons) which is more aromatic and more terrestrial-like than DOM from further down
 which is more aromatic and more terrestrial-like than DOM from further down.")
39
DOC Concentrations DOC (mg/L) Discharge (m 3 /day) (Eran Hood’s work looking at DOC in Green Lakes Valley)
 Discharge (m 3 /day) (Eran Hood’s work looking at DOC in Green Lakes Valley)")
40
DOC Concentrations DOC (mg/L)
")
41
Percent Fulvic Acid Discharge (m 3 /day) % Fulvic Acid
 % Fulvic Acid")
42
Fluorescence Index

43
General Trends in an Alpine System DOC peaks just before peak discharge Fulvic acids highest on rising limb Terrestrial production main source of DOM during snowmelt Terrestrial sources decrease on recession limb On recession limb, alpine lakes have greater proportion of aquatic sources

44
O lignin MeO O lignin OH OMe OH O lignin MeO O lignin OH OMe OH HO O O Me

Similar presentations


 is an important property of lake ecosystems, resulting from the decomposition of organic matter stored in soils and of plankton.>")


 CO 2 + H 2 O + energy + inorganic nutrients a form of respiration.>")


