Download presentation
Presentation is loading. Please wait.

1
Copyright © 1999 Center for Farm Financial Management, University of Minnesota Supporting Extension Programs with Benchmark Farm Financial Data Through Multi-State Cooperation

2
Copyright © 1999 Center for Farm Financial Management, University of Minnesota Uniform Farm Management Project

3
Comprehensive Farm Financial Information System FINPACK – Individual Farm Financial Analysis RankEm – Benchmark Individual vs Group RankEm Central – Group Summary Reports FINBIN – Dynamic Web-Based Financial Reports

4
Copyright © 1999 Center for Farm Financial Management, University of Minnesota Goals of the Uniform Project 4To support and enhance farm management association activities 4To develop a uniform farm financial database to support extension, ag education, and research programs across a broad geographic area 4To provide meaningful benchmarks for producer members and other producers

5
Copyright © 1999 Center for Farm Financial Management, University of Minnesota Uniform Farm Management Program Participating Groups 4MN Farm Bus Mgt2200 farms1996-pres 4SW MN Farm Mgt Assn200 farms1993-pres 4SE MN Farm Mgt Assn60 farms1993-pres 4ND Farm Bus Mgt550 farms1993-pres 4Nebraska Farm Bus Assn160 farms1995-pres 4Ohio Extension50 farms1997-pres 4Missouri Farm Bus Mgt91 farms2003, 2004

6
Copyright © 1999 Center for Farm Financial Management, University of Minnesota Uniform Farm Management Program Works in Process 4Utah Farm Business Management 4SW Wisconsin Tech College 4South Carolina Farm Business Associations

7
Copyright © 1999 Center for Farm Financial Management, University of Minnesota FINBIN www.finbin.umn.edu 4Data from 3400 producers 42.88 million acres of cropland 460,000 dairy cows 435,500 sows 4654,000 grow/finish pigs

8
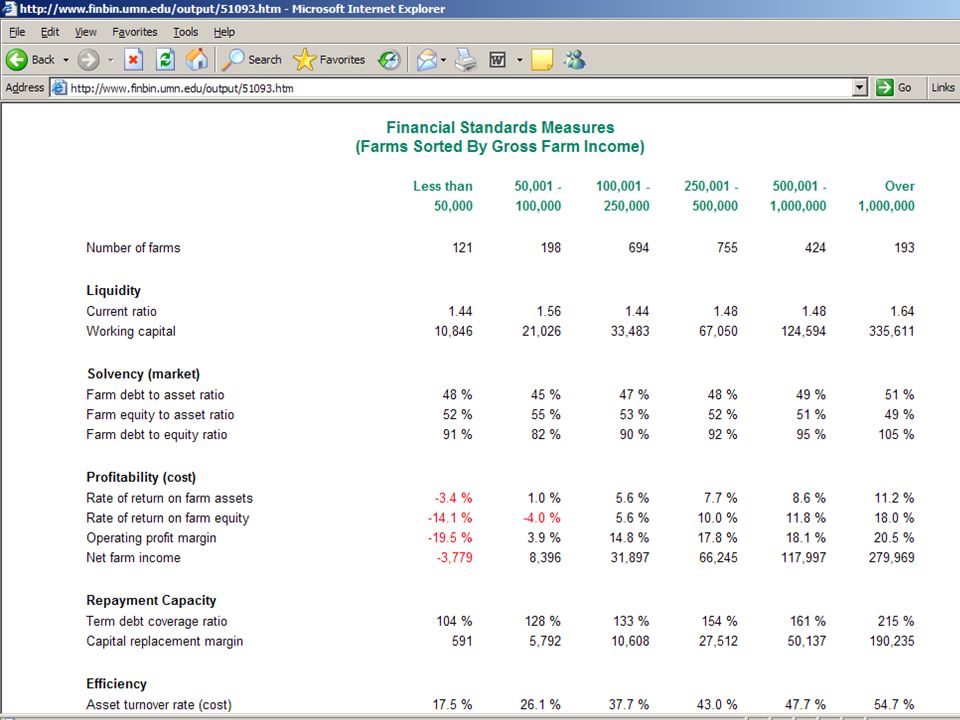
Copyright © 1999 Center for Farm Financial Management, University of Minnesota FINBIN Reports 4Whole farm reports Income statements Balance sheets Profitability, liquidity, solvency measures Family living expenditures Nonfarm income, assets and liabilities 4Crop enterprise reports 4Livestock enterprise reports

9
Copyright © 1999 Center for Farm Financial Management, University of Minnesota We feel there needs to be a return to: 4Participating producers 4Extension and other educators 4Research 4Public – Public access to publicly supported programs

10
Copyright © 1999 Center for Farm Financial Management, University of Minnesota

17
Crop Sort Criteria 4Year 4County 4Net return 4Cost of production 4Enterprise size (acres) 4Tenure 4Tillage system 4Row width 4Manure 4Roundup Ready 4Bt crops
 4Tenure 4Tillage system 4Row width 4Manure 4Roundup Ready 4Bt crops")
18
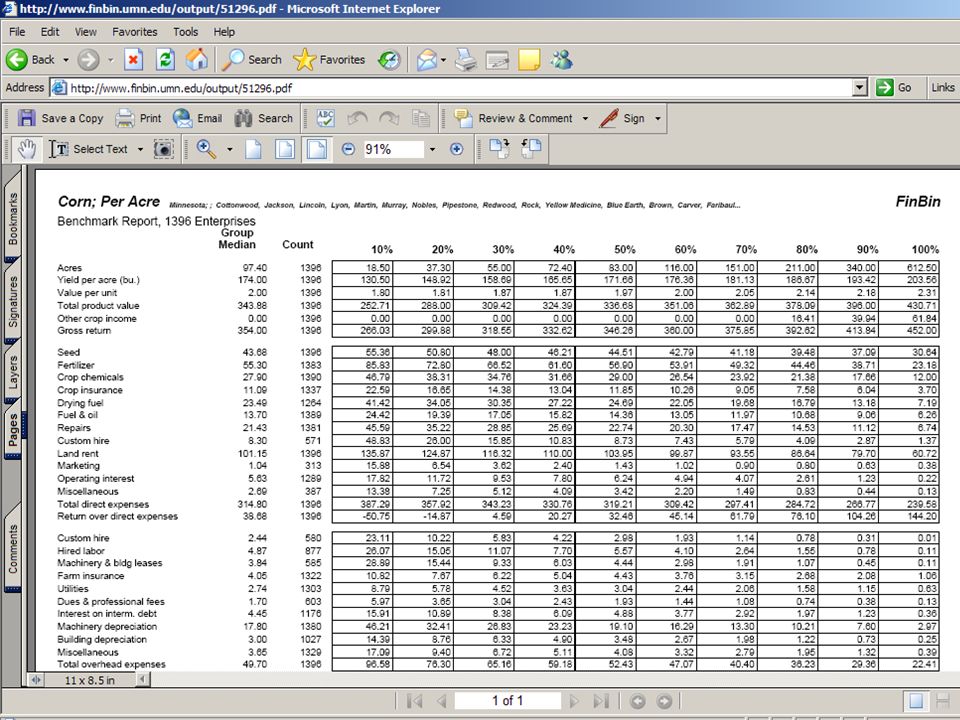
Copyright © 1999 Center for Farm Financial Management, University of Minnesota Example Crop Report 4Corn by Net Return Group

19
Copyright © 1999 Center for Farm Financial Management, University of Minnesota

21
Soybeans, Cash Rented FINBIN Database, Southern MN, 2002 - 2004 Roundup ReadyConventional Yield41.643.91 Gross return$276.59$286.72 Seed24.3015.75 Chemicals17.9824.96 Rent103.10105.17 Total costs241.14238.67 Net return to operator lbr & mgt35.4548.05 Cost of production5.445.21

22
Copyright © 1999 Center for Farm Financial Management, University of Minnesota Livestock Sort Criteria 4Year 4County 4Net return 4Cost of production 4Enterprise size

23
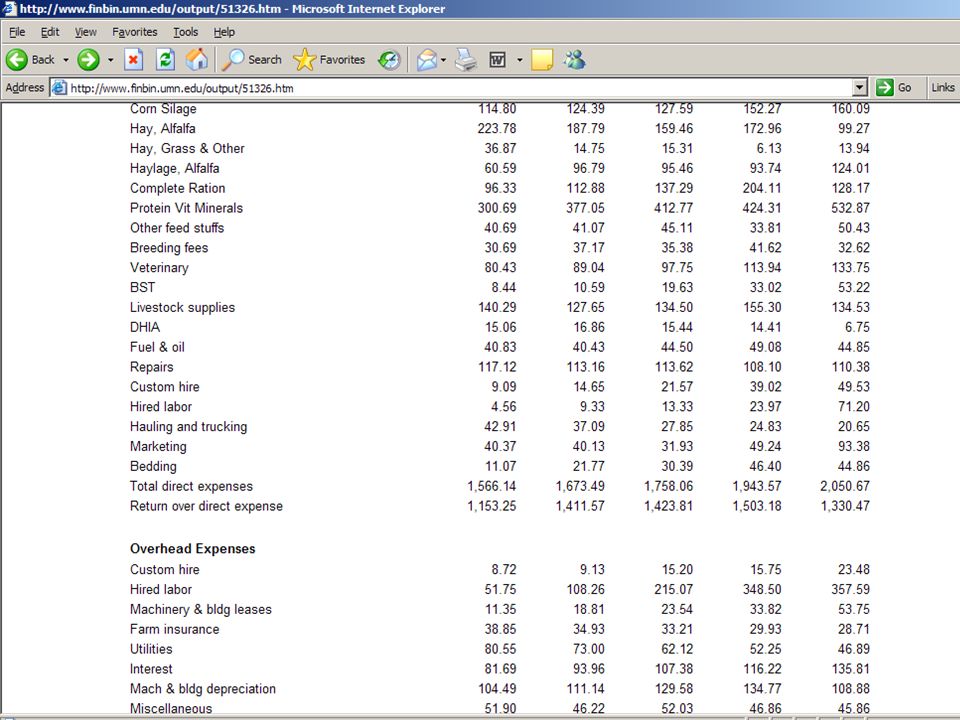
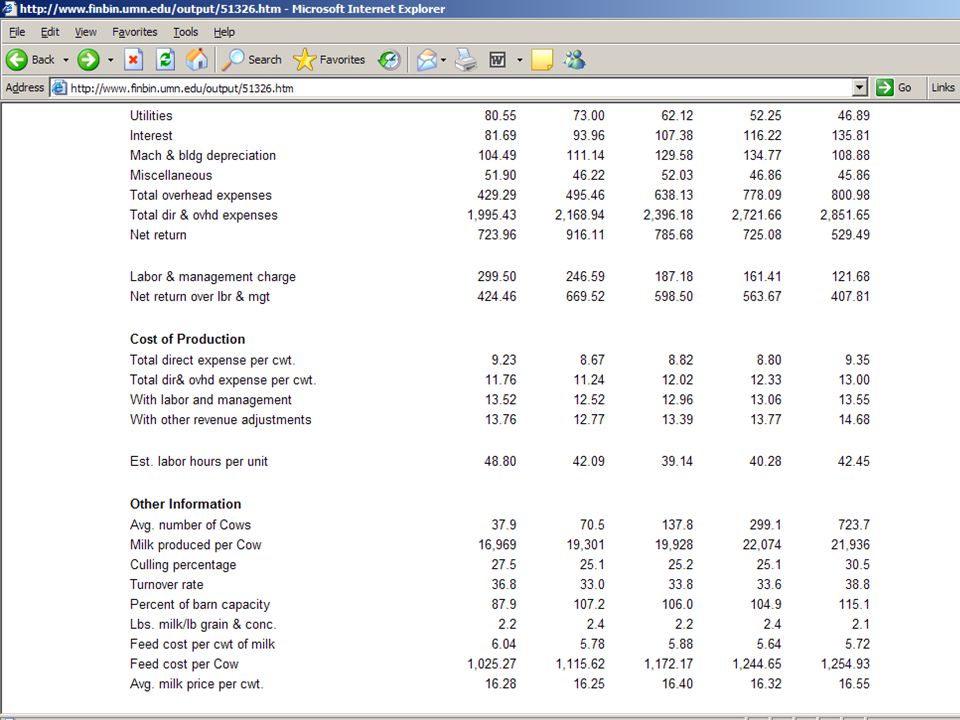
Copyright © 1999 Center for Farm Financial Management, University of Minnesota Example Livestock Report 4Dairy by Herd Size

24
Copyright © 1999 Center for Farm Financial Management, University of Minnesota

27
Dairy by Herd Size FINBIN Database, Minnesota, 2002-2004 Herd size51 - 100101-200201-500500 + Average number of cows70138304706 Production per cow19,05919,95721,91122,429 Gross return$2,650$2,798$3,039$2,971 Feed1,0471,1101,1611,176 Labor100202342399 Total expense per cow2,0412,2842,5802,711 Net return per cow610514458260 Cost of production11.7812.3912.9013.66 Net farm income53,52682,860145,460253,511

28
Copyright © 1999 Center for Farm Financial Management, University of Minnesota Data Security 4Whole farm reports -- minimum of 10 farms in each report 4Enterprise reports -- minimum of 5 farms in each report

29
Copyright © 1999 Center for Farm Financial Management, University of Minnesota Supporting Extension Programs 4Historic trends 4Enterprise budgets 4Rental rates 4Costs of production analysis 4News releases 4Winning the Game 4Marketing plan targets 4Crop insurance workshops 4Crop enterprise reports 4Support for publications

30
Copyright © 1999 Center for Farm Financial Management, University of Minnesota FINBIN Reports 456,000 reports since inception in 2001 46,000 since 2004 MN data was available in April 4Approximately 75 reports per day in last three months

31
Copyright © 1999 Center for Farm Financial Management, University of Minnesota

35
Farm Management Associations A unique public/private collaboration 4Producer/members 4Extension and other educators 4Research 4Public – Public return for publicly supported programs

Similar presentations


 and.>")

 957-5790>")


 Data Have Been Used by AFPC Dr. James W. Richardson Co-Director Agricultural and Food Policy Center.>")


