Download presentation
Presentation is loading. Please wait.

1
Copyright © 2004 Center for Farm Financial Management, University of Minnesota. All Rights Reserved. Farm Financial Database www.finbin.umn.edu

2
Comprehensive Farm Financial Information System FINPACK – Individual Farm Financial Analysis RankEm – Benchmark Individual vs Group RankEm Central – Group Summary Reports FINBIN – Dynamic Web-Based Financial Reports

3
Copyright © 2004 Center for Farm Financial Management, University of Minnesota. All Rights Reserved.

4
FINBIN Reports üWhole farm reports üCrop enterprise reports üLivestock enterprise reports

5
Copyright © 2004 Center for Farm Financial Management, University of Minnesota. All Rights Reserved. FINBIN Includes: üData from 2500 MN producers, 3400 total ü2.88 million acres of cropland ü60,000 dairy cows ü35,500 sows ü654,000 grow/finish pigs

6
Copyright © 2004 Center for Farm Financial Management, University of Minnesota. All Rights Reserved. FINBIN Data Sources üMN Farm Bus Mgt2200 farms1996-pres üSW MN Farm Mgt Assn200 farms1993-pres üSE MN Farm Mgt Assn60 farms1993-pres üND Farm Bus Mgt550 farms1993-pres üNebraska Farm Bus Assn160 farms1995-pres üOhio Extension50 farms1997-pres üMissouri FBMA66 farms2003-

7
Copyright © 2004 Center for Farm Financial Management, University of Minnesota. All Rights Reserved. Data Security üWhole farm reports -- minimum of 10 farms in each report üEnterprise reports -- minimum of 5 farms in each report

8
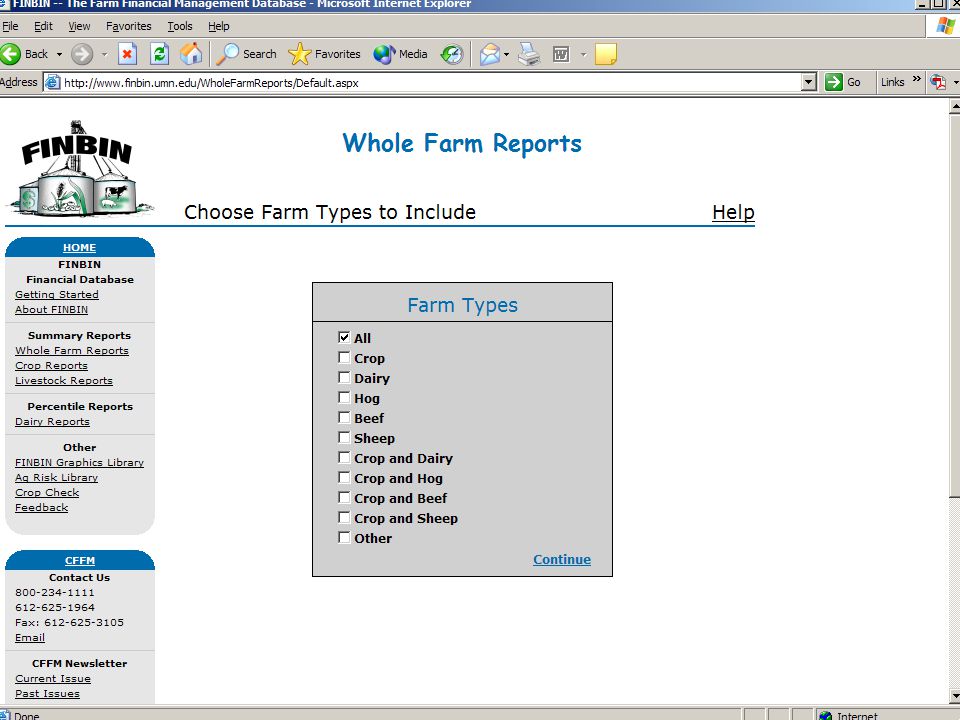
Copyright © 2004 Center for Farm Financial Management, University of Minnesota. All Rights Reserved. 5 Steps to Generating a FINBIN Report üSelect a report type/enterprise

9
Copyright © 2004 Center for Farm Financial Management, University of Minnesota. All Rights Reserved.

10
5 Steps to Generating a FINBIN Report üSelect a report type/enterprise üSelect location State Group Region Counties

11
Copyright © 2004 Center for Farm Financial Management, University of Minnesota. All Rights Reserved.

12
5 Steps to Generating a FINBIN Report üSelect a report type/enterprise üSelect location üSelect column format Any characteristic can be chosen as a column format

13
Copyright © 2004 Center for Farm Financial Management, University of Minnesota. All Rights Reserved.

14
5 Steps to Generating a FINBIN Report üSelect a report type/enterprise üSelect location üSelect column format üSelect characteristics Years Type of farm etc

15
Copyright © 2004 Center for Farm Financial Management, University of Minnesota. All Rights Reserved.

17
5 Steps to Generating a FINBIN Report üSelect a report type/enterprise üSelect location üSelect column format üSelect characteristics üRun the report

18
Copyright © 2004 Center for Farm Financial Management, University of Minnesota. All Rights Reserved. Whole Farm Report Characteristics üYears üType of farm (70 % rule) üSize of farm (gross farm income) üSize of farm (total assets) üSize of farm (total crop acres) üNet farm income (high/low profit farms) üDebt to asset ratio üAge of operator
 üSize of farm (gross farm income) üSize of farm (total assets) üSize of farm (total crop acres) üNet farm income (high/low profit farms) üDebt to asset ratio üAge of operator.")
19
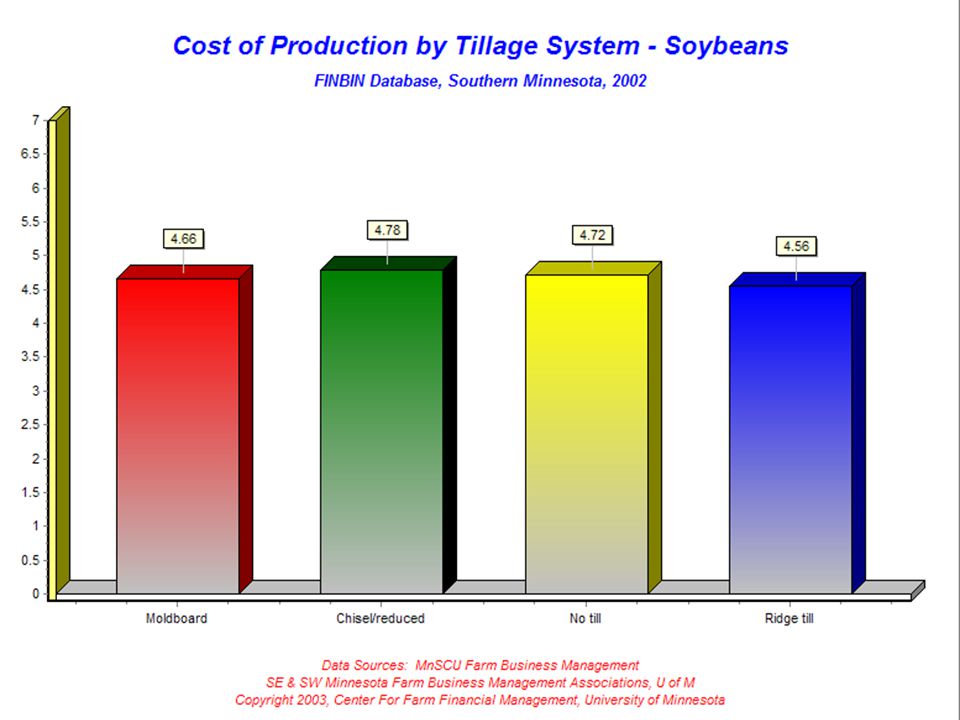
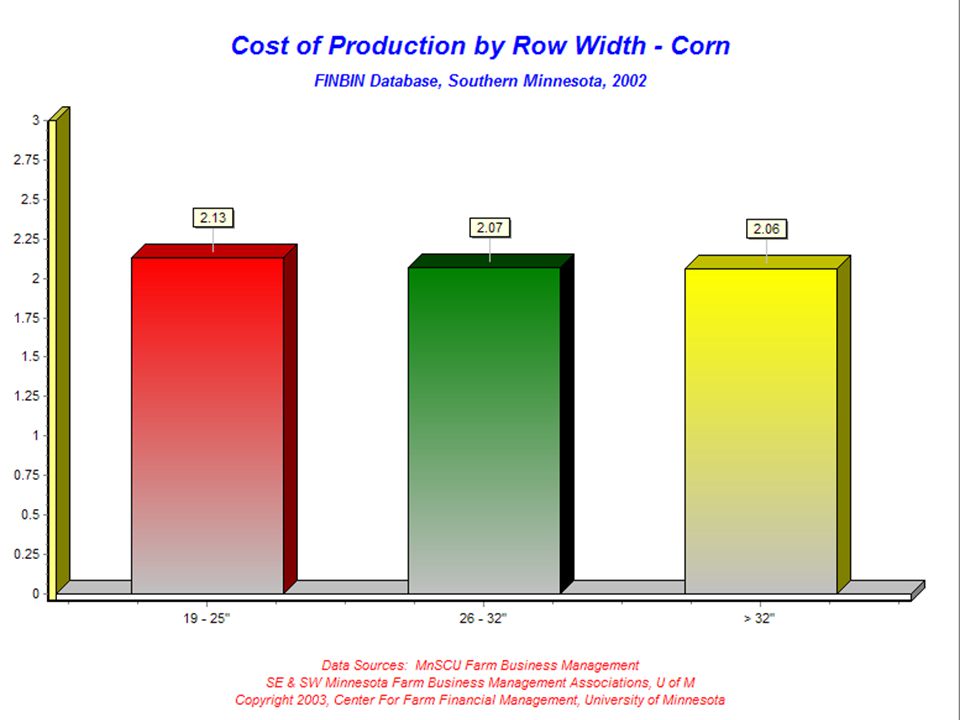
Copyright © 2004 Center for Farm Financial Management, University of Minnesota. All Rights Reserved. Crop Enterprise Report Characteristics üYears üTenure (owned, cash, share rent) üNet return (high vs. low return) üAcres (total on farm) üProduction practices Tillage system Row width Roundup ready Bt Organic Manure application
 üNet return (high vs. low return) üAcres (total on farm) üProduction practices Tillage system Row width Roundup ready Bt Organic Manure application.")
20
Copyright © 2004 Center for Farm Financial Management, University of Minnesota. All Rights Reserved. Livestock Enterprise Report Characteristics üYears üNet return (high vs. low return) üEnterprise size
 üEnterprise size.")
21
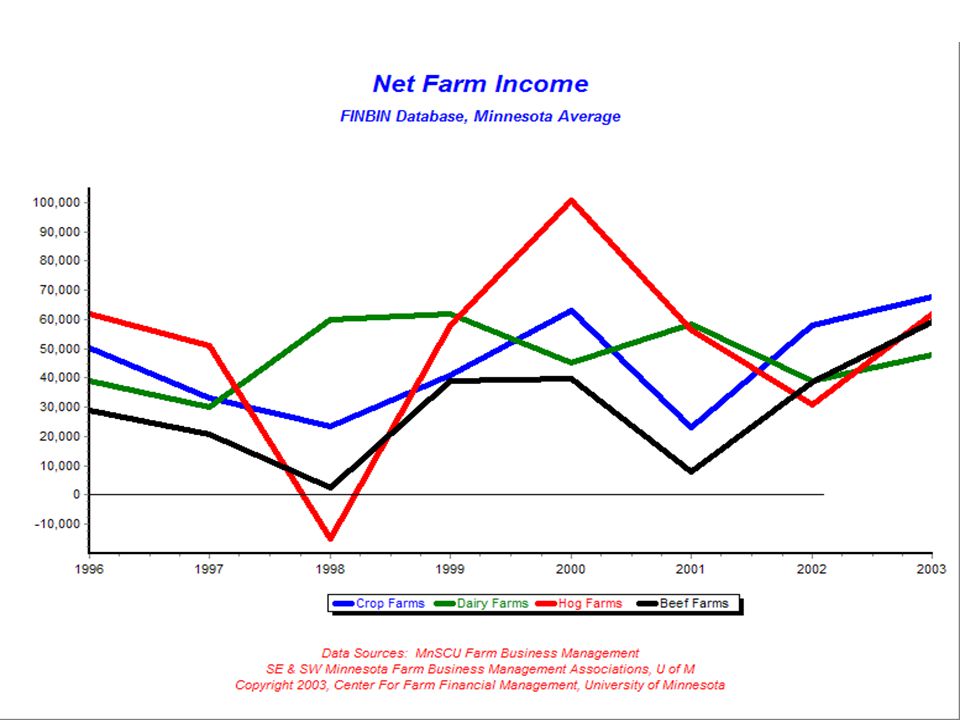
Copyright © 2004 Center for Farm Financial Management, University of Minnesota. All Rights Reserved. Example Whole Farm Report üFarm Financial Standards Sweet 16 by type of farm

22
Copyright © 2004 Center for Farm Financial Management, University of Minnesota. All Rights Reserved.

25
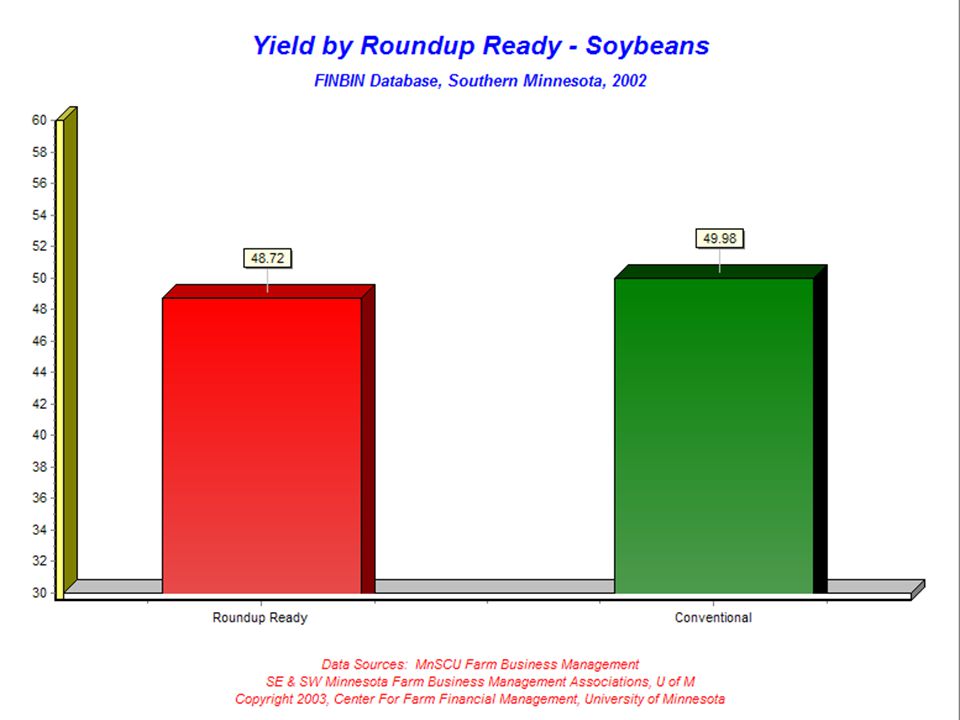
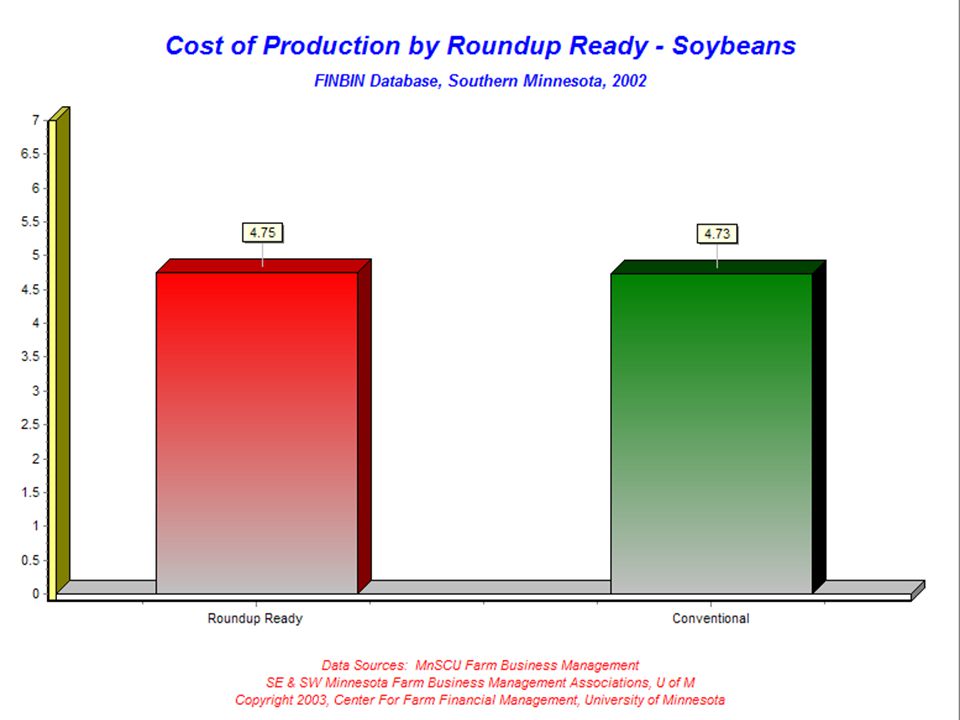
Example Crop Report üRoundup Ready vs. Conventional Soybeans

26
Copyright © 2004 Center for Farm Financial Management, University of Minnesota. All Rights Reserved.

31
Corn, Cash Rented, 2002 FINBIN Database, So MN Profitability Group< 20 %20-40%40-60%60-80%80-100% Yield150157161167173 Gross return$322.84$344.16$352.34$366.93$384.41 Seed38.4537.8237.3736.9936.56 Fertilizer48.0348.0145.8743.9142.13 Chemicals29.4829.9026.8126.0324.49 Rent103.50103.19101.67101.9798.06 Total direct cost302.08296.06280.41270.17258.41 Total costs373.94350.05330.90319.17296.09 Net return to operator lbr & mgt-51.10-5.8921.4447.7688.32 Cost of production2.532.262.091.941.75

32
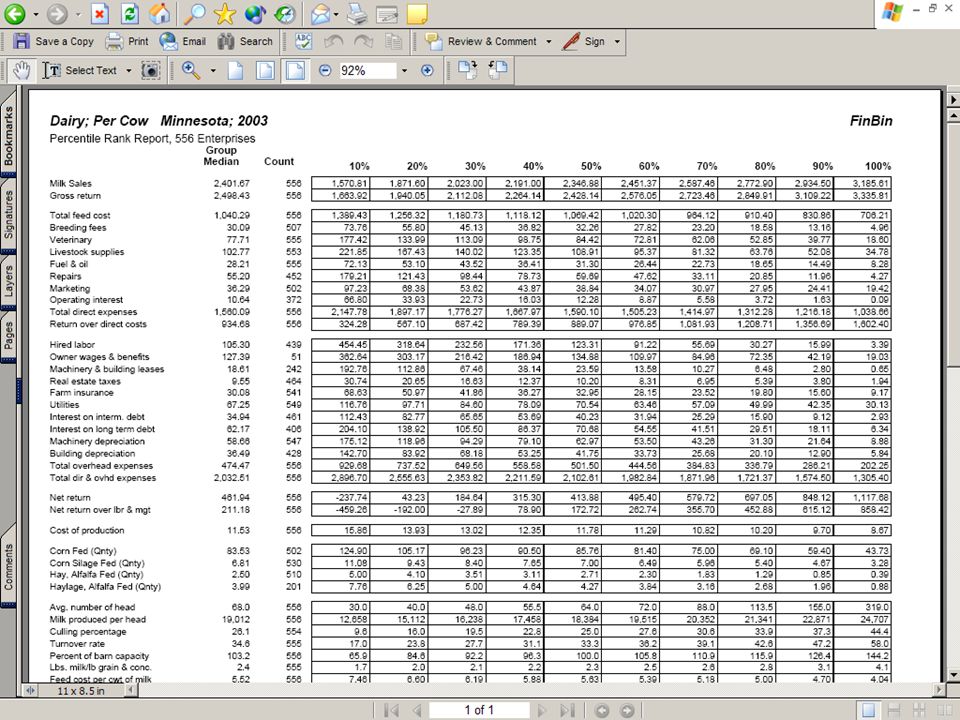
Copyright © 2004 Center for Farm Financial Management, University of Minnesota. All Rights Reserved. Example Livestock Report üDairy by Herd Size

33
Copyright © 2004 Center for Farm Financial Management, University of Minnesota. All Rights Reserved.

Similar presentations

 and.>")


 Data Have Been Used by AFPC Dr. James W. Richardson Co-Director Agricultural and Food Policy Center.>")


