Download presentation
Presentation is loading. Please wait.

1
Reassessing the Standard of Living in the Soviet Union: An Analysis Using Archival and Anthropometric Data Betsy Brainerd January 29, 2007 Presentation to the Program on the Global Demography of Aging, Harvard School of Public Health

2
“The greatest failed experiment in the history of the human race.” -- Joel Mokyr on the Soviet Union

3
Did the standard of living improve in the Soviet Union in the postwar period? GNP grew in every decade But know little about standard of living: little data; some unfavorable trends Important: our judgment of the Soviet growth model depends in part on whether growth translated into improved well-being for the population as a whole

4
This paper: Examines alternative measures of well-being: birth weights; child and adult heights; infant and adult mortality Useful supplement to traditional measures of living standards, especially where economic data is of poor quality and reliability Previously unexploited data sources

5
Outline: 1.Introduction and motivation 2.Related literature 3.Previous assessments of GNP growth and consumption in the USSR 4.New data sources 5.Trends in height, birth weight, and mortality 6.Hypotheses 7.Conclusions and further work

6
Related literature: Economic history: heights and the ‘antebellum puzzle’ in the US; ‘early industrial growth puzzle’ in Europe Comparative economics: reassessments of Soviet growth (Robert Allen on 1928-1940 period) Archival research in Soviet economics and history: Paul Gregory and Mark Harrison, J. Econ Lit Sept. 2005 Russian mortality crisis of 1990s

7
Conventional measures of growth in the Soviet Union “The fundamental problem in evaluating Soviet growth is data quality.” -- Easterly and Fischer, 1994

8
Problems with Soviet economic statistics Strong incentives for overreporting output Methodological differences between Soviet and western national income accounting practices Selective publication of data Shortages; poor quality of goods; lack of market prices Growing underground economy

9
Estimates of national income growth in the Soviet Union, 1928 – 1985 (annual rates of growth)
")
10
Comparisons of Soviet and Western economic performance, 1950 – 1980 (annual rates of growth)
")
11
New data sources Data on infant and adult mortality from the Soviet archives: by region, urban/rural, age and sex (adult mortality) for 1959, 1970 and 1979 Additional (limited) archival and published data on wages, health care infrastructure, food and alcohol consumption Anthropometric data: birth weights and child heights across regions, 1910s - present; adult heights from the Russian Longitudinal Monitoring Survey
 for 1959, 1970 and 1979 Additional (limited) archival and published data on wages, health care infrastructure, food and alcohol consumption Anthropometric data: birth weights and child heights across regions, 1910s - present; adult heights from the Russian Longitudinal Monitoring Survey")
15
Advantages of anthropometric and mortality data: More objective measures of well-being than economic growth or consumption Not affected by data problems inherent in more conventional measures Take into account that some economic activity is non-monetized

16
Insights from anthropometric data Adult height is a cumulative measure of nutritional status in infancy and childhood; measures net nutrition Fogel and others: height can provide a wealth of information on living standards; height and income highly correlated At the population level nearly all differences in average height are due to environmental influences: can compare stature across countries and over time

17
Soviet Anthropometric Data Most collected by the Semashko Inst. of Public Health from 1920s to present 59 Russian regions and most USSR republics Collected in preschools and schools; at least 100 children of each sex age each age (n = 165 on average) Underlying RSFSR data represent average heights of over 470,000 children Average child heights converted into percentiles of US growth standards, from (old) standard US growth charts (1) Child height data:
 Underlying RSFSR data represent average heights of over 470,000 children Average child heights converted into percentiles of US growth standards, from (old) standard US growth charts (1) Child height data:.")
18
Soviet Anthropometric Data, cont. Researchers sometimes excluded children with “defects” and chronic illnesses Urban areas sampled more frequently; urban stature is greater on average than rural stature Surveys not representative of USSR or RSFSR If better-off children more likely to go to school, will over- estimate heights (schooling became compulsory in 1958) Possible problems with child height data:
 Possible problems with child height data:.")
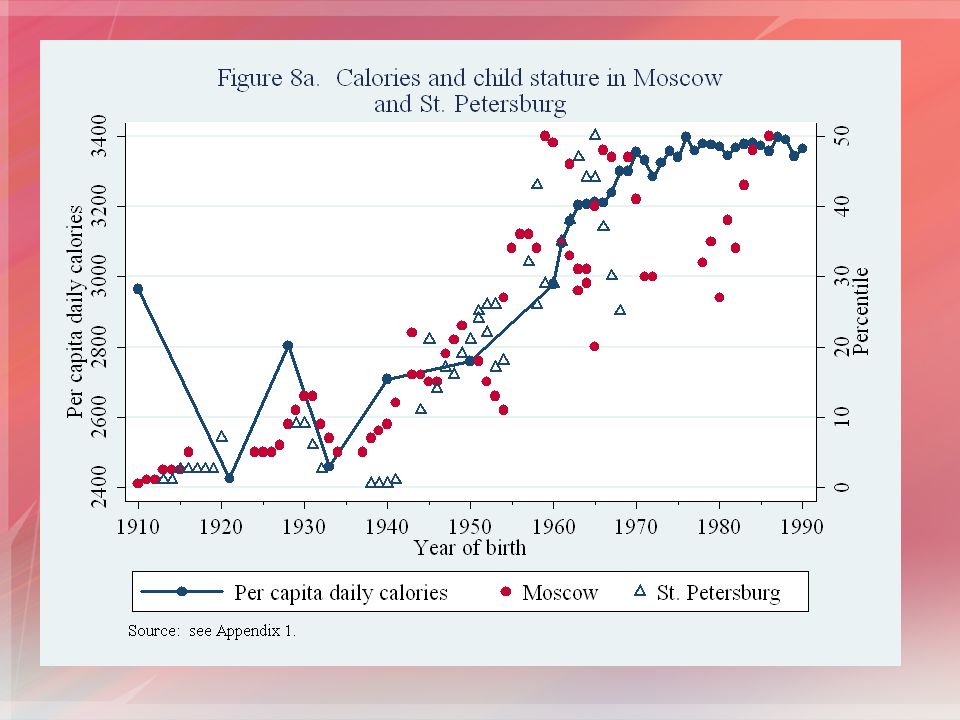
23
Height of children in urban centers of the RSFSR by year of birth as a percentile of U.S. standards, boys age 9

24
Is This Real? Soviet Anthropometric Data, cont. Corroborating evidence: Average stature of male military recruits born 1906 – 1910 was 167.5 cm, the 8 th percentile of the U.S. height standard for 18-year old boys Russian Longitudinal Monitoring Survey, 1994 – 2004: –Measurement of adult height (not self-reported) by exact date of birth –5,476 men and 5,771 women age 22 – 55 (birth years 1939 – 1982) –Problems: small sample; does not cover whole period of interest (2) Adult height data:
 by exact date of birth –5,476 men and 5,771 women age 22 – 55 (birth years 1939 – 1982) –Problems: small sample; does not cover whole period of interest (2) Adult height data:.")
25
Male and female adult height by exact date of birth (RLMS), ages 22 - 55
, ages")
26
Other Evidence (1)Infant mortality rates : –Very high pre-WWII –Significant decline 1945 – 1970 –No improvement 1970 – 1980, with worsening between 1970 and 1975
Infant mortality rates : –Very high pre-WWII –Significant decline 1945 – 1970 –No improvement 1970 – 1980, with worsening between 1970 and 1975")
28
Infant mortality rates in Russia

30
Other Evidence, cont. (1)Life expectancy at birth: –Substantial increases between 1940 and early 1960s; nearly equal to that of U.S. by 1965 –Worsening life expectancy began around 1965 –By 1980: gap between Russian and U.S. life expectancy: 8.5 years for men 4.3 years for women –Occurred in all other USSR republics
Life expectancy at birth: –Substantial increases between 1940 and early 1960s; nearly equal to that of U.S. by 1965 –Worsening life expectancy began around 1965 –By 1980: gap between Russian and U.S. life expectancy: 8.5 years for men 4.3 years for women –Occurred in all other USSR republics.")
32
Male Life Expectancy at Birth, 1958 - 2001 U.S. Russia Belarus Lithuania Estonia Ukraine

33
Inequality in stature: how were the gains distributed across the population? Coefficients from regressions of height on exact date of birth, converted into cm. Bold coefficients are statistically significant at the 1 percent level or less. Bootstrapped SEs.

35
What caused the improvement and subsequent stagnation in population health status? 1.Possible explanations for improvement: Development and expansion of national health care system; particularly effective at controlling infectious diseases Significant increases in female education Improvement in caloric and nutrient content of the food supply Urbanization (clean water, sewers, heat, etc.)
.")
36
Possible causes, cont. 2.Possible explanations for stagnation/decline: Changes in diet; poor agricultural harvests Increase in alcohol consumption Increase in military expenditures crowding out domestic consumption Increased macroeconomic imbalances leading to decreased availability of consumer goods

39
(1)(2)(3)(4) Doctors per capita -.164 (.096) ---.023 (.121) -.046 (.103) Pop. density--.014 (.141) -- % pop. w/>sec. ed. -- -.489 (.278) -.550 (.321) Alcohol cons. per cap. -- -.032 (.065) N R2 216.74 231.74 216.75 175.74 Correlates of log change in infant mortality rates, RSFSR regions, 1959 – 1989 (stacked) Other controls: crude birth rate; large region; decade (1970-1979, 1980-1989; 1959 – 1970 is omitted decade).
 -- % pop. w/>sec. ed (.278) (.321) Alcohol cons. per cap (.065) N R Correlates of log change in infant mortality rates, RSFSR regions, 1959 – 1989 (stacked) Other controls: crude birth rate; large region; decade ( , ; 1959 – 1970 is omitted decade)..")
42
Conclusion: Did the standard of living rise or fall in the Soviet Union in the postwar period? Given poor quality of GNP data, trends portrayed by stature and death rates may be more believable than GNP growth Conventional measures of GNP growth and consumption indicate a long, upward climb in living standards 1950-1989 Corroborated for 1950 – 1970 by increasing child and adult heights, declining IMR and rising life expectancy at birth

43
Conclusion, cont. But evidence of deteriorating living conditions in the mid- to late-1960s: –declining male life expectancy –rising infant mortality, even in regions with reliable vital event data –stagnation or decrease in child heights; –slight decline or stagnation in height of men and women born in early 1970s Underlying reasons for these trends are inconclusive, but may include: –expansion of national health system –increased education –declining availability of consumer goods –increased alcohol consumption

44
Implications and further research More data on food and alcohol consumption, tobacco use Effect of abortion legalization on child and parent/adult outcomes Effect of Chernobyl on child well-being Are deteriorating living conditions of the 1970s related to current high mortality levels in Russia?

Similar presentations


>")


